![]()
Prev Page--Economic geology, Mineral Resources || Next Page--Formations
Quality of Ground Water
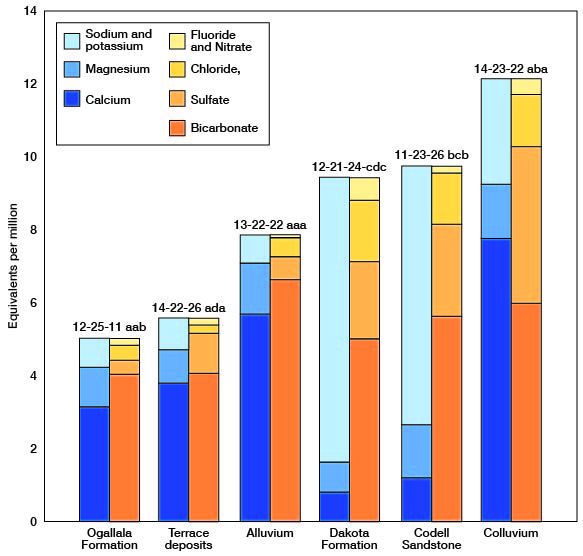
The chemical character of the ground water in Trego County is indicated by analyses of samples from wells deriving water from the principal aquifers (Table 3). The analyses of water were made by Howard A. Stoltenberg, Chief Chemist, in the Sanitary Engineering Laboratory of the Kansas State Department of Health. The results of the analyses are given in parts per million. Factors for converting parts per million of mineral constituents to equivalents per million are given in Table 4. The analyses show only the dissolved mineral constituents and do not indicate the sanitary condition of the water. Representative analyses of ground water from the principal aquifers are shown in Figure 15.
Table 3--Analyses of water from typical wells in Trego County, Kansas (in parts per million, except as otherwise indicated). One part per million is equivalent to one pound of substance per million pounds of water or 8.33 pounds per million gallons of water. Samples analyzed by H. A. Stoltenberg.
| Well no. |
Date of collection |
Depth of well, feet |
Temp °F |
Silica (SiO3) |
Iron (Fe) |
Manganese (Mn) |
Calcium (Ca) |
Magnesium (Mg) |
Sodium and Potassium (Na+K) |
Bicarbonate (HCO3) |
Sulfate (SO4) |
Chloride (Cl) |
Fluoride (F) |
Nitrate (NO3) |
Dissolved solids (residue at 180° C) |
Hardness as CaCO3 | Specific conductance (micromhos at 25° C) |
|
|---|---|---|---|---|---|---|---|---|---|---|---|---|---|---|---|---|---|---|
| Carbonate | Non- carbonate |
|||||||||||||||||
| 10-25-34ddc | 12-1-1952 | 16.0 | 29 | 0.13 | 65 | 15 | 14 | 249 | 11 | 10 | 0.7 | 27 | 295 | 204 | 20 | |||
| 11-22-32bbc | 6-14-1960 | 87 | 36 | .68 | 0.00 | 66 | 6.7 | 15 | 224 | 7.4 | 13 | .4 | 17 | 272 | 184 | 8 | 410 | |
| 11-23-6cdc | 10-24-1960 | 28.7 | 41 | .07 | .00 | 117 | 7.8 | 25 | 310 | 67 | 33 | .3 | 9.3 | 453 | 254 | 70 | 800 | |
| 11-23-11ccc | 10-24-1960 | 37.3 | 58 | 28 | .53 | .45 | 118 | 18 | 44 | 316 | 112 | 59 | .6 | 4.4 | 540 | 259 | 109 | 970 |
| 11-23-26bcb | 10-13-1959 | 320 | 57 | 9.5 | .78 | 24 | 18 | 163 | 344 | 121 | 51 | 2.8 | 1.1 | 560 | 134 | 0 | 955 | |
| 11-24-29bcc | 9-30-1959 | 22.0 | 56 | 39 | .06 | 76 | 18 | 10 | 246 | 12 | 22 | .06 | 49 | 348 | 202 | 62 | 570 | |
| 12-21-2bbb | 9-26-1960 | 54.0 | 31 | .16 | .00 | 82 | 12 | 10 | 283 | 11 | 9.0 | .2 | 25 | 320 | 232 | 22 | 550 | |
| 12-21-24cdc | 10-12-1959 | 665 | 8.0 | .20 | 16 | 10 | 180 | 307 | 101 | 61 | 3.0 | 26 | 556 | 81 | 0 | 950 | ||
| 12-21-28aaa | 10-12-1959 | 48.0 | 60 | 13 | .14 | 600 | 25 | 64 | 293 | 1,360 | 36 | 1.8 | 32 | 2,280 | 240 | 1,360 | 2,600 | |
| 12-22-8bab | 6-14-1960 | 118.0 | 39 | .14 | .00 | 65 | 14 | 7.4 | 252 | 11 | 9.0 | .4 | 4.9 | 275 | 206 | 14 | 450 | |
| 12-22-12aab | 10-12-1959 | 65.0 | 60 | 25 | .13 | 67 | 10 | 9.7 | 242 | 7.8 | 11 | .2 | 8.0 | 258 | 198 | 10 | 415 | |
| 12-22-28bba | 6-14-1960 | 33 | .09 | .00 | 62 | 10 | 16 | 239 | 16 | 9.0 | .3 | 5.3 | 269 | 196 | 0 | 450 | ||
| 12-22-36ccb | 6-14-1960 | 269 | 15 | .20 | .00 | 28 | 15 | 219 | 346 | 150 | 95 | 2.8 | 33 | 728 | 132 | 0 | 1,270 | |
| 12-22-36ccc | 10-24-1960 | 27.5 | 58 | 24 | .20 | .00 | 129 | 15 | 60 | 377 | 69 | 43 | .6 | 88 | 614 | 309 | 75 | 1,070 |
| 12-23-12bab | 6-14-1960 | 103.0 | 43 | .11 | .00 | 66 | 13 | 21 | 264 | 14 | 9.0 | .5 | 23 | 320 | 216 | 2 | 510 | |
| 12-23-20ccc1 | 9-15-1960 | 65 | 28 | .96 | .70 | 86 | 14 | 17 | 302 | 38 | 14 | .3 | 1.5 | 317 | 248 | 24 | 640 | |
| 12-23-30acc1 | 9-20-1960 | 96 | 32 | .05 | .00 | 60 | 16 | 8.7 | 259 | 7.0 | 8.0 | .4 | 3.5 | 263 | 212 | 4 | 460 | |
| 12-23-33bcb | 10-12-1959 | 100.0 | 59 | 25 | .07 | 74 | 9.6 | 12 | 246 | 14 | 13 | .3 | 18 | 287 | 202 | 22 | 490 | |
| 12-24-5cdc | 10-25-1960 | 67.5 | 58 | 41 | .25 | .00 | 89 | 15 | 13 | 295 | 19 | 17 | .4 | 31 | 371 | 242 | 42 | 650 |
| 12-24-30dad | 10-13-1959 | 79.5 | 58 | 25 | .13 | 70 | 13 | 13 | 264 | 5.3 | 14 | .3 | 18 | 289 | 216 | 12 | 490 | |
| 12-25-11aab | 10-25-1960 | 77.5 | 58 | 45 | .48 | .00 | 63 | 13 | 18 | 246 | 18 | 16 | .6 | 8.0 | 303 | 202 | 8 | 510 |
| 12-25-12aaa | 6-14-1960 | 90 | 45 | 2.5 | .00 | 91 | 19 | 13 | 244 | 20 | 41 | .5 | 66 | 416 | 200 | 105 | 690 | |
| 13-22-15daa | 6-14-1960 | 66 | 34 | .54 | .00 | 71 | 16 | 30 | 321 | 12 | 22 | .4 | 1.2 | 345 | 243 | 0 | 600 | |
| 13-22-22aaa | 6-14-1960 | 40 | 35 | 3.9 | .17 | 114 | 17 | 17 | 405 | 30 | 20 | .2 | 1.0 | 433 | 332 | 22 | 740 | |
| 13-23-17aaa | 10-10-1959 | 107 | 27 | .26 | 61 | 11 | 13 | 246 | 6.6 | 7.0 | .2 | 6.6 | 253 | 197 | 0 | 415 | ||
| 13-22-22ccb | 10-12-1959 | 65.0 | 59 | 27 | .12 | 170 | 26 | 45 | 283 | 21 | 91 | .1 | 305 | 825 | 232 | 299 | 1,350 | |
| 13-24-2aaa | 10-12-1959 | 106.5 | 59 | 25 | .11 | 61 | 8.8 | 7.8 | 217 | 7.8 | 8.0 | .2 | 9.3 | 235 | 178 | 10 | 385 | |
| 13-24-36bbb | 10-13-1959 | 31.5 | 58 | 25 | .39 | 110 | 14 | 36 | 285 | 99 | 27 | .4 | 42 | 494 | 234 | 98 | 855 | |
| 13-25-32cbb | 9-27-1960 | 21.0 | 59 | 24 | .06 | .00 | 100 | 8.4 | 11 | 278 | 46 | 14 | .4 | 15 | 356 | 228 | 56 | 630 |
| 14-21-6aba | 10-21-1960 | 21.0 | 58 | 25 | .16 | .00 | 128 | 17 | 46 | 325 | 132 | 52 | .5 | 15 | 575 | 266 | 124 | 1,000 |
| 14-21-30cab | 10-29-1949 | 29.2 | 59 | 32 | 4.7 | 156 | 29 | 39 | 284 | 262 | 29 | .7 | 55 | 772 | 508 | 275 | ||
| 14-21-31cdb | 10-29-1949 | 13.2 | 62 | 39 | .10 | 174 | 43 | 43 | 268 | 416 | 23 | .6 | 22 | 938 | 610 | 390 | ||
| 14-21-34bad | 10-29-1949 | 20.9 | 58 | 36 | .26 | 342 | 48 | 20 | 194 | 496 | 97 | .4 | 348 | 1,480 | 1,050 | 890 | ||
| 14-21-35cab | 10-22-1949 | 19.1 | 59 | 27 | .26 | 214 | 38 | 101 | 224 | 538 | 78 | .5 | 69 | 1,180 | 690 | 510 | ||
| 14-21-35cca | 10-22-1949 | 19.8 | 59 | 45 | .77 | 226 | 78 | 81 | 374 | 648 | 41 | .3 | 26 | 1,330 | 884 | 576 | ||
| 14-22-6aba | 9-29-1960 | 27.5 | 59 | 29 | .04 | .00 | 85 | 11 | 26 | 259 | 44 | 26 | .5 | 22 | 371 | 212 | 45 | 660 |
| 14-22-12ccc | 6-14-1960 | 87.0 | 15 | .23 | .00 | 73 | 40 | 42 | 288 | 142 | 32 | .6 | 11 | 498 | 236 | 110 | 830 | |
| 14-22-26ada | 10-29-1949 | 90.7 | 35 | .19 | 76 | 11 | 20 | 248 | 53 | 9.0 | .4 | 9.0 | 368 | 235 | 32 | |||
| 14-23-9aba | 10-12-1959 | 23.4 | 59 | 24 | .62 | 97 | 8.3 | 11 | 267 | 21 | 20 | .1 | 37 | 350 | 219 | 57 | 600 | |
| 14-23-22aba | 9-28-1960 | 37.5 | 20 | .14 | .00 | 156 | 18 | 66 | 266 | 285 | 51 | .4 | 25 | 752 | 218 | 245 | 1,170 | |
| 14-24-19dda | 10-10-1959 | 300 | 57 | 9.5 | .24 | 4.9 | 4.9 | 362 | 350 | 187 | 232 | 3.2 | 1.8 | 978 | 32 | 0 | 1,720 | |
| 14-24-22baa | 10-10-1959 | 52.0 | 58 | 8.5 | .18 | 82 | 11 | 13 | 259 | 28 | 10 | .2 | 27 | 307 | 212 | 38 | 555 | |
| 14-24-25ddd | 10-10-1959 | 29.0 | 60 | 25 | .04 | 104 | 6.0 | 32 | 307 | 54 | 13 | .1 | 32 | 417 | 252 | 32 | 720 | |
| 14-25-25ccb | 9-28-1960 | 19.0 | 34 | .07 | .00 | 228 | 72 | 106 | 351 | 625 | 87 | .7 | 42 | 1,370 | 288 | 577 | 1,950 | |
| 15-21-5abb | 10-29-1949 | 11.1 | 63 | 36 | .14 | 137 | 14 | 53 | 196 | 98 | 60 | .1 | 208 | 780 | 400 | 239 | ||
| 15-21-16cbc | 6-14-1960 | 32 | 26 | .07 | .00 | 100 | 14 | 34 | 346 | 47 | 29 | .7 | 8.0 | 429 | 284 | 23 | 745 | |
| 15-21-25ddd | 6-14-1960 | 555 | 9.5 | .49 | .00 | 8.3 | 12 | 476 | 415 | 220 | 368 | 5.2 | 3.6 | 1,310 | 70 | 0 | 2,280 | |
| 15-21-36ddd | 6-14-1960 | 45.0 | 21 | .11 | .00 | 110 | 16 | 19 | 300 | 33 | 50 | .3 | 37 | 434 | 246 | 94 | 790 | |
| 15-22-35aba | 9-29-1960 | 660 | 59 | 35 | 1.3 | .00 | 68 | 9.4 | 13 | 246 | 13 | 12 | .5 | 2.9 | 275 | 202 | 6 | 470 |
| 15-23-4bcb | 10-12-1959 | 18.0 | 60 | 16 | .07 | 121 | 24 | 28 | 215 | 239 | 19 | .5 | 10 | 564 | 176 | 224 | 860 | |
| 15-23-14ccd | 10-12-1959 | 8.5 | 60 | 21 | .31 | 281 | 37 | 87 | 307 | 628 | 68 | .9 | 49 | 1,320 | 252 | 601 | 1,820 | |
| 15-23-21ddc | 10-12-1959 | 47.4 | 58 | 18 | .64 | 71 | 10 | 18 | 227 | 16 | 21 | .4 | 31 | 297 | 186 | 32 | 520 | |
| 15-23-35bcb | 9-28-1960 | 35.0 | 60 | 29 | .11 | .00 | 82 | 11 | 33 | 259 | 50 | 37 | .3 | 5.3 | 375 | 212 | 38 | 660 |
| 15-24-15ccc | 9-9-1959 | 618 | 67 | 8.0 | .62 | 9.1 | 7.7 | 398 | 312 | 174 | 336 | 3.2 | .4 | 1,090 | 54 | 0 | 1,930 | |
| 15-24-31ddc | 9-28-1960 | 72.5 | 59 | 31 | 1.8 | .00 | 116 | 17 | 44 | 321 | 58 | 52 | .2 | 71 | 547 | 263 | 97 | 970 |
| 15-24-35ccc | 9-29-1959 | 60 | 54 | 25 | .89 | 102 | 25 | 23 | 246 | 47 | 64 | .7 | 80 | 488 | 202 | 156 | 915 | |
| 15-25-23dad | 9-27-1960 | 72.0 | 59 | 26 | .30 | .00 | 52 | 12 | 11 | 215 | 9.5 | 7.0 | .5 | 5.3 | 229 | 176 | 3 | 400 |
| 15-25-29bba | 9-27-1960 | 35.0 | 21 | .06 | .00 | 115 | 14 | 10 | 315 | 33 | 7 | .3 | 43 | 418 | 258 | 86 | 760 | |
| 15-25-35cdc | 10-13-1959 | 93.0 | 57 | 25 | .03 | 62 | 14 | 9.2 | 231 | 12 | 11 | .4 | 17 | 264 | 190 | 22 | 465 | |
Table 4--Factors for converting parts per million to equivalents per million.
| Mineral constituent |
Chemical symbol |
Factor |
|---|---|---|
| Calcium | Ca++ | 0.0499 |
| Magnesium | Mg++ | 0.0822 |
| Sodium | Na+ | 0.0435 |
| Potassium | K+ | 0.0256 |
| Carbonate | CO3-- | 0.0333 |
| Bicarbonate | HCO3- | 0.0164 |
| Sulfate | SO4-- | 0.0208 |
| Chloride | Cl- | 0.0282 |
| Fluoride | F- | 0.0526 |
| Nitrate | NO3- | 0.0161 |
Figure 15--Graphic represciitation of chemical constituents in samples of water from wells in principal aquifers in Trego County, Kansas.
Chemical Constituents in Relation to Use
The following discussion of the chemical constituents of ground water has been adapted in part from publications of the U.S. Geological Survey and the State Geological Survey of Kansas
Dissolved Solids
The residue that is left after a sample of water has evaporated consists mainly of the dissolved minerals in the original sample, but may also include some organic material and water of crystallization. Water containing less than 500 ppm (parts per million) of dissolved solids generally is satisfactory for domestic and many industrial purposes. Water containing more than 1,000 ppm of dissolved solids is likely to contain enough of certain constituents to cause a noticeable taste or to make the water unsuitable in other respects.
The dissolved solids in the samples of water collected ranged from 229 to 2,280 ppm (Table 3). Most samples contained less than 500 ppm of dissolved solids. Eight samples contained more than 1,000 ppm of dissolved solids.
Hardness
Hardness of water is recognized most commonly by the amount of soap needed to produce a lather or suds and by an insoluble scum that forms during the washing process. Calcium and magnesium cause almost all the hardness of water and are the constituents that contribute to the incrustation that may develop when water undergoes changes in temperature and pressure.
The total hardness of water may be divided into two types--carbonate hardness and noncarbonate hardness. Carbonate hardness includes that portion of the calcium and magnesium that would combine with the bicarbonate and the small amount of carbonate that are present. Carbonate hardness can be virtually removed by boiling the water, thereby causing precipitation of magnesium and calcium carbonate. Noncarbonate hardness is the difference between the total and the carbonate hardness and is caused by that portion of calcium and magnesium that would combine with the sulfate, chloride, and nitrate ions that are present, plus the slight hardness effect of other minor constituents. Noncarbonate hardness cannot be removed by boiling.
Water that has a hardness of less than 60 ppm is classified as soft. Hardness of 60 to 120 ppm will cause an increase in the amount of soap required for washing but will not interfere with the use of the water for most purposes--although water in the upper part of this range will cause considerable scale in steam boilers. Hardness of 120 to 180 ppm will cause a hardness that is quite noticeable. Water that has a hardness of more than 180 ppm is considered very hard. Where municipal water supplies are softened, the hardness is generally reduced to about 100 ppm.
Most samples of the water collected were high in total hardness (carbonate and noncarbonate). Most of them ranged from 100 to 400 ppm, with the greatest proportion ranging from 200 to 300 ppm. Only four samples had a total hardness of less than 100 ppm (Table 3).
Nitrate
The nitrate content of natural water may vary greatly, and in many ground waters nitrates may seem unrelated to any geologic formation. Although some nitrate may be derived from nitrate-bearing rocks and minerals in the water-bearing formation, strong concentrations of nitrate probably are due to other sources. Nitrates are dissolved readily from soils that contain nitrate concentrations derived from plants, nitrate fertilizer, animal waste, or nitrifying bacteria. High nitrate concentrations in water may be due to the flow of surface water into a well. In an area where privies, cesspools, and barnyards are sources of organic nitrogen, a large amount of nitrate in well water may indicate harmful bacteria or pollution.
In the last two decades, investigations into the effects of nitrate on the human system have shown that too much nitrate in water may cause cyanosis in infants (so-called "blue babies") when the water is taken in directly or used in the preparation of the formula for feeding. Both the Kansas State Department of Health and the U.S. Public Health Service regard 45 ppm as the safe limit of nitrate (as NO3). This amount of nitrate is equivalent to 10 ppm of nitrogen. Water containing as much as 90 ppm of nitrate generally is considered very dangerous to infants, and water containing as much as 150 ppm may cause severe cyanosis. Moderate nitrate concentrations seemingly are not harmful to older children or adults. Nitrate cannot be removed from water by boiling.
The nitrate content of the samples of water collected ranged from less than 1 ppm to 348 ppm (Table 3). Most samples were low in nitrate content although eight samples ranged between 45 and 90 ppm and three exceeded 150 PPM.
Fluoride
Fluoride generally is present only in small amounts in ground water. However, the fluoride content of drinking water should be known because if children drink water containing too much fluoride during the formation of permanent teeth, mottling of the enamel may result. If the fluoride content is as much as 4 ppm, about 90 percent of the children using the water may develop mottled tooth enamel (Dean, 1936). Although too much fluoride has a detrimental effect, a smaller amount in drinking water, about 1 ppm, lessens the incidence of tooth decay (Dean, et al., 1941). The U.S. Public Health Service (1962) recommends the standards for content of mineral constituents in drinking water that are to be used on interstate carriers. The recommended maximum content for fluoride is 1.5 ppm.
The fluoride content of the samples of water collected ranged from 0.06 to 5.2 ppm (Table 3). Although most samples contained less than 1.0 ppm, seven samples exceeded 1.5 ppm. Of five analyses of water from the Dakota Formation, four exceeded 1.5 ppm of fluoride.
Chloride
Chloride is abundant in nature and many rocks contain small to large amounts of chloride salts which may be dissolved by ground water. Chloride has little effect on the suitability of water for ordinary use, unless present in such concentrations as to make the water nonpotable or corrosive. Water that contains less than 150 ppm of chloride is satisfactory for most purposes. Water containing more than 250 ppm generally is objectionable for municipal supplies, and water containing more than 350 ppm is objectionable for most irrigation or industrial uses; water containing 500 ppm has a disagreeable taste. However, animals can tolerate water with a much greater chloride concentration (e.g., concentrations of as much as 4,000 to 5,000 ppm can be tolerated by cattle.)
The chloride content of the water samples collected ranged from 7 ppm to 368 ppm (Table 3). Most samples were low in chloride; all but three samples contained less than 100 ppm.
Iron
Iron and manganese in quantities that exceed a few tenths of a part per million are undesirable, as they stain fabrics and plumbing fixtures and produce an objectionable coloration and taste in the water. Water in the ground may contain considerable iron in the ferrous state, but upon exposure to air most of the iron is oxidized and precipitated as reddish-brown ferric hydroxide. Iron can be removed from most water by aeration and filtration, but some water requires additional treatment. Drinking water standards recommended by the U.S. Public Health Service are that the iron content should not exceed 0.3 ppm and that the manganese content should not exceed 0.05 ppm.
The iron content of the water samples collected ranged from 0.03 to 4.7 ppm (Table 3). Most samples contained less than 0.3 ppm of iron, but three samples contained more than 1.0 ppm.
Sulfate
Sulfate (SO4) in ground water is derived principally from gypsum or anhydrite (calcium sulfate) and from the oxidation of pyrite (iron disulfide). Magnesium sulfate (Epsom salt) and sodium sulfate (Glauber's salt), if present in sufficient quantities, impart a bitter taste to the water, and the water may act as a laxative on people not accustomed to drinking it. More than 250 ppm of sulfate in drinking water generally is undesirable.
Most water samples collected were low in sulfate, although nine samples exceeded 250 ppm and one exceeded 1,000 ppm of sulfate (Table 3).
Silica
Silicon combined with oxygen in the form of SiO2 is called silica. Silica is a mineral constituent in most ground waters. Except for the scale it may form, silica has little effect on the use of water for most purposes. Silica may be deposited as scale with other incrustants, generally in the form of calcium or magnesium silicate. The silica content of the water samples collected ranged from 8 to 45 ppm (Table 3). Analyses of water from both the Dakota Formation and the Codell Sandstone Member of the Carlile Shale were characteristically low in silica content.
Bicarbonate
Bicarbonate and carbonate cause alkalinity of ground water. The concentration of bicarbonate, the predominant anion in the samples of water from Trego County, ranged from 194 to 415 ppm (Table 3).
Sodium
The sodium content of water used for irrigation is important because a large percentage of sodium (equivalents per million of sodium divided by total equivalents per million of sodium, potassium, calcium, and magnesium) has an adverse effect on soil, especially where leaching is not adequate. The effect of sodium in irrigation water is discussed in detail in U.S. Department of Agriculture Handbook 60 (U.S. Salinity Laboratory Staff, 1954).
Analyses of water samples from 10 wells deriving water from alluvium, terrace deposits, and the Ogallala Formation were used to illustrate the suitability of water for irrigation. The procedure is based upon methods outlined in U.S. Department of Agriculture Handbook 60.
Figure 16 shows sodium-adsorption ratios determined by plotting the sodium content (equivalents per million) on the left scale (A), and the calcium plus magnesium content (equivalents per million) on the right scale (B). The point at which a line connecting these two points intersects the sodium-adsorption-ratio scale (C) indicates the sodium-adsorption ratio of the water. Table 5 gives sodium-adsorption ratios, electrical conductivities, and values for sodium and for calcium plus magnesium of the water samples for which analyses were plotted.
Figure 16--Nomogram for determining the sodium-adsorption ratio of water.
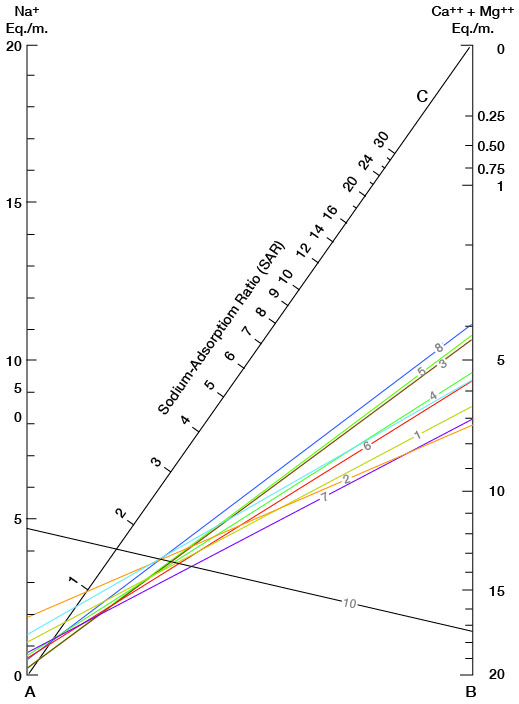
Table 5--Sodium-adsorption ratios (SAR), conductivities, sodium content, and calcium plus magnesium content of water samples from selected wells.
| Well number |
Sample used in Figures 16 and 17 |
Na (equivalents per million) |
Ca+Mg (equivalents per million) |
SAR | Conductivity (micromhos per centimeter at 25°C) |
|---|---|---|---|---|---|
| 11-23-6cdc | 1 | 1.09 | 6.48 | 0.60 | 800 |
| 11-23-11ccc | 2 | 1.90 | 7.37 | 1.00 | 970 |
| 12-22-8bab | 3 | .32 | 4.39 | .20 | 450 |
| 12-23-20ccc | 4 | .73 | 5.44 | .40 | 640 |
| 12-23-30acc | 5 | .38 | 4.31 | .20 | 460 |
| 12-24-5cdc | 6 | .57 | 5.67 | .30 | 650 |
| 13-22-22aaa | 7 | .76 | 7.09 | .40 | 740 |
| 13-23-17aaa | 8 | .55 | 3.94 | .40 | 420 |
| 14-24-25ddd | 9 | 1.37 | 5.68 | .80 | 720 |
| 14-25-25ccb | 10 | 4.63 | 17.30 | 1.60 | 1,950 |
The specific conductance of a water sample can be measured directly in the laboratory, or it can be approximated by multiplying the total equivalents per million of the cations (calcium, magnesium, sodium, and potassium) by 100, or by dividing the dissolved-solids content in parts per million by 0.64.
Sodium-adsorption ratios and electrical conductivities are plotted in Figure 17 to provide a classification of waters for irrigation use. Low-sodium water (S1) can be used for irrigation on most soils with little danger of development of harmful levels of exchangeable sodium. Medium-sodium water (S2) may be used safely on coarse-textured or organic soils having good permeability, but S2 water will present an appreciable sodium hazard in certain fine-textured soils, especially under poor leaching conditions. High-sodium water (S3) may produce harmful levels of exchangeable sodium in most soils and will require special soil-management techniques, such as good drainage, leaching, and additions of organic matter. Very high-sodium water (S4) generally is unsatisfactory for irrigation unless special practices are followed, such as addition of gypsum to the soil.
Figure 17--Classification of water used for irrigation.
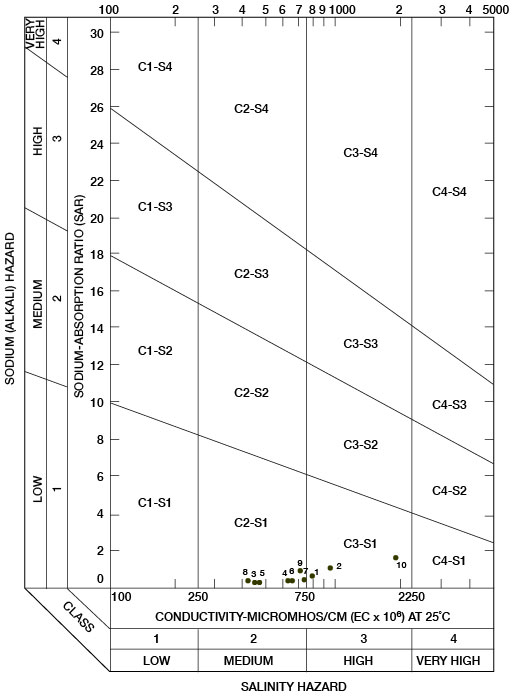
Low-salinity water (C1) can be used for irrigation of most crops on most soils with little likelihood that soil salinity will develop. Medium-salinity water (C2) can be used if a moderate amount of leaching occurs. Crops that tolerate moderate amounts of salt, such as potatoes, corn, wheat, oats, and alfalfa, can be irrigated with C2 water without special practices. High-salinity water (C3) cannot be used on soils having restricted drainage. Very high-salinity water (C4) can be used only on certain crops and then only if special practices are followed. In Figure 17, all the waters were classified as low-sodium water (S1) and either medium-salinity water (C2) or high-salinity water (C3).
Sanitary Considerations
The analyses of water in Table 3 give only the dissolved-solids content of the water and do not indicate the sanitary quality of the water, although a large amount of certain mineral constituents, such as nitrate or chloride, may indicate pollution. Water containing mineral matter that imparts an objectionable taste or odor may be free from harmful bacteria and quite safe for drinking. Conversely, water that is clear and pleasant to the taste may contain harmful bacteria. Great care should be taken to protect domestic and public water supplies from pollution. To guard against contamination, a well must be properly sealed to keep out dust, insects, vermin, debris, and surface water. Wells should not be placed where barnyards, privies, or cesspools are possible sources of pollution.
Prev Page--Economic geology, Mineral Resources || Next Page--Formations
Kansas Geological Survey, Geology
Placed on web Dec. 12, 2008; originally published June 1965.
Comments to webadmin@kgs.ku.edu
The URL for this page is http://www.kgs.ku.edu/General/Geology/Trego/06_qual.html