![]()
Prev Page--Recharge and Discharge || Next Page--Formations
Ground Water, Continued
Utilization of Water
About 80 percent of the wells in Hamilton and Kearny counties supply or have supplied water for domestic and stock use. Most of the water pumped from wells in this area is used for irrigation, although less than 20 percent of the wells are used for this purpose. A few wells are used for public-water supplies and for railroads.
Domestic and Stock Supplies
Domestic wells supply water in homes for drinking, cooking, and washing, and in schools other than those supplied by municipal wells. Stock wells supply water for livestock, principally cattle. Supplies of water for domestic and stock use are obtained almost entirely from drilled wells. The water is moderately hard, but generally is satisfactory for domestic and stock use. Much of the water from wells in the Arkansas valley contains a large amount of sulphate, but most of it can be used for domestic and stock purposes. Much of the ground water in the Syracuse upland area contains sufficient fluoride to be injurious to children's teeth during the period of their formation (see Quality of water).
Public Water Supplies
Syracuse and Lakin are the only cities in the two counties that have public water supplies and they are supplied from wells.
The water supply for Syracuse is obtained from a well (100) belonging to the Atchison, Topeka and Santa Fe Railway Company. It is located at the north edge of the sand-hills area in the north half of sec. 7, T. 24 S., R. 40 W. The early supplies of water for the city were obtained from wells that penetrated the Dakota formation, but the water was relatively hard and was high in fluoride content. The present supply from the sand-hills area is much softer and has a low fluoride content,. The well is 83 feet deep, and the water level is about 15 feet below the land surface. The well has a 22-inch galvanized-iron casing and is equipped with a 5-inch horizontal centrifugal pump operated by a 25-horsepower electric motor. The yield is reported to be about 500 gallons a minute. The well penetrated a few feet of dune sand and then entered the terrace gravels (log 37). The Graneros shale was encountered at a depth of 6.1 feet, and the casing was perforated from 21.8 feet to 62.3 feet. The well pump delivers the water directly into the mains; the excess water is stored in a standpipe and elevated steel tank holding an aggregate of 315,000 gallons. The total capacity of the well is about 720,000 gallons a day, but the maximum daily consumption for public supply has not exceeded 250,000 gallons. An analysis of the water (table 13) indicates a total hardness of 176 parts per million and a fluoride content of 0.3 part per million. The fluoride content is within the safe limit discussed under Quality of water.
Lakin is supplied by two city-owned wells that are equipped with electrically-driven turbine pumps. The older well (294), drilled in 1910, is 231 feet deep and is cased with 15-inch wrought-iron casing. The static water level was about 15 feet below land surface in 1940. The relatively hard water in the alluvium has been cased off to prevent its mixing with the softer water from the underlying beds. The well is reported to yield about 240 gallons a minute with a drawdown of 40 feet. The newer well (293), drilled in 1934, is 273 feet deep and is cased with 18-inch wrought-iron casing. The water level was about 18 feet below land surface in 1940. The well is reported to yield 560 gallons a minute with a draw-down of 40 feet after 20 hours of pumping. The water is pumped directly into the mains, which are 4 to 8 inches in diameter, and the excess water is stored in an elevated steel tank of 50,000 gallons capacity. A pressure of 48 to 60 pounds to the square inch is maintained in the mains, but a maximum pressure of 125 pounds to the square inch can be produced in case of fire. As indicated by analysis 293, the water from these wells has a total hardness of 608 parts per million and a fluoride content of 0.8 part per million. The fluoride content is within the safe limit discussed under Quality of water.
Railroad Supplies
About 10 wells have been drilled in this area to supply water for the Atchison, Topeka and Santa Fe Railway, but only a few of these are now in use. Beginning in 1900, five wells, ranging in depths from 83 to 465 feet, were drilled at Syracuse for the railroad company (logs 33 to 37). Well No. 4 (100) of the company is described in detail under Public water supplies. Each of the wells encountered the Graneros shale below the Quaternary gravels and all but one were drilled into the underlying Cretaceous sandstones.
Four wells that were drilled at Lakin (logs 28 to 31) for railroad use range in depth from 184 to 231 feet. The water was taken from sands and gravels underlying the alluvium of the Arkansas valley. Well No. 4 of the company (log 31) is reported to have encountered "rock" at a depth of 220 feet which may have been a sandstone of the Dakota formation, although no water was reported to have been found at that depth.
Wells also were drilled at Kendall and at Coolidge (logs 32 and 38). The Kendall well (drilled in 1903) encountered redbeds at a depth of 496 feet and the total depth of the well was 537 feet. The well at Coolidge was drilled in 1903 to a depth of 312 feet and encountered four important water-bearing beds. The first water was encountered in the alluvium of Arkansas river at a depth of 25 feet. A water-bearing sandstone was encountered at the top of the Dakota formation from which the water rose to a point 46 feet below land surface. Additional artesian water was encountered in a sandstone of the Dakota formation at a depth of 202 feet, from which the water rose to within 12 feet of the land surface, and in the Cheyenne sandstone at a depth of 300 feet, from which the water rose to within a foot of the land surface.
Irrigation Supplies
Many large wells in this area supply water to irrigate crops--principally row crops, alfalfa, and sugar beets. Much land in the Arkansas valley between the Colorado line and Kendall and between Hartland and Deerfield and in the Kearny County part of the Scott-Finney basin is irrigated by water from wells. According to Sutton (1897, p. 250), the second irrigation project in western Kansas was begun by L. A. Martin in the vicinity of Lakin in 1878. By 1895 there were 64 irrigation plants in Hamilton and Kearny counties, of which 44 pumped water from streams, 18 from wells, and 2 from storage reservoirs. They supplied water for irrigating about 2,840 acres of land.
During the summer and fall of 1940 an inventory was made of the irrigation wells in Hamilton and Kearny counties, and estimates were obtained of the total pumpage and the number of acres irrigated during 1939. The records of all the irrigation wells visited are given in tables 20 and 21 and the locations of the wells are shown on plate 2. Records were obtained of about 96 irrigation plants of which 13 are on the upland north of Deerfield. Seven of these plants had been abandoned. The total reported area in Hamilton and Kearny counties that was irrigated from 73 of these wells in 1939 was 10,650 acres. Twelve of the wells supplied water for the irrigation of about 2,000 acres in Finney County (G. L. Howell, personal communication). The estimated total quantity of water pumped for irrigation during 1939 was 23,600 acre-feet, of which about 3,445 acre-feet was pumped from wells on the upland.
The total annual pumpage for irrigation in this area varies considerably with the climate, particularly with the amount of precipitation during the growing season. During the dry years the pumpage increased greatly and many new plants were put into operation. This allows a more regular moistening of the soil and prevents its cracking as it may do in nonirrigated land between periods of precipitation.
An unique irrigation project in this area is that of the Garden City Company in the vicinity of Deerfield which includes 13 plants that were constructed in 1905-08 by the Bureau of Reclamation (Data supplied by G. L. Howell, superintendent). The plants are situated along a northeast-southwest line from the NW sec. 26 to the NW sec. 13, T. 24 S., R. 35 W. Recently 12 of the plants have been operated by the Garden City Company. Each plant comprises five wells ranging in depth from 30 to 60 feet and cased with 16-inch galvanized-iron casing. The plants are equipped with 12-inch centrifugal pumps powered by 25-horsepower electric motors. The water is pumped into a concrete ditch, is siphoned under Arkansas river, and is carried to a booster station about 1 mile east of Deerfield, where the water is pumped into the Great Eastern canal on the upland in Finney County. The booster station is equipped with a 24-inch pump operated by a 500-horsepower electric motor. The plants are reported to yield an aggregate of about 15,000 gallons a minute when pumping begins, but the yield decreases by about 50 percent after many days of continuous pumping. In 1939, approximately 3,500 acre-feet of water was withdrawn from the ground-water reservoir by these wells. The pumpage was considerably less in 1940.
Yields of irrigation wells--The yields of the irrigation wells in Hamilton and Kearny counties range widely. Some small wells produce less than 100 gallons a minute and the large wells yield as much as 1,700 gallons a minute. Irrigation plants that draw water from a battery of five or six wells may yield as much as 4,000 gallons a minute. Most of the yields of irrigation wells given in tables 20 and 21 were reported by the owners, but a few were measured. The results of pumping tests, including the discharge, draw-down, and discharge per foot of draw-down (specific capacity), are given in table 9.
Table 9--Pumping tests of irrigation plants in Hamilton and Kearny counties1.
| Well no. | Drawdown (feet) |
Discharge (gallons a minute) |
|
|---|---|---|---|
| Total | Per foot of drawdown |
||
| 91 | 30.0 | 532 | 17.7 |
| 34.4 | 520 | 15.1 | |
| 34.55 | 534 | 15.5 | |
| 34.55 | 531 | 15.4 | |
| 34.56 | 525 | 15.2 | |
| 35.34 | 524 | 14.8 | |
| 92 | 12.55 | 700 | 55.2 |
| 13.05 | 693 | 53.0 | |
| 13.25 | 708 | 53.4 | |
| 13.40 | 712 | 53.1 | |
| 13.40 | 719 | 53.6 | |
| 13.65 | 712 | 52.2 | |
| 13.35 | 712 | 53.4 | |
| 13.15 | 707 | 53.6 | |
| 13.13 | 701 | 53.4 | |
| 213 | 77.28 | 791 | 10.3 |
| 78.86 | 813 | 10.3 | |
| 79.45 | 812 | 10.2 | |
| 80.32 | 812 | 10.1 | |
| 80.10 | 812 | 10.1 | |
| 80.32 | 812 | 10.1 | |
| 80.51 | 807 | 10.0 | |
| 80.64 | 810 | 10.0 | |
| 81.42 | 813 | 10.0 | |
| 215 | 41.0 | 915 | 22.3 |
| 217 | 56.2 | 480 | 8.5 |
| 238 | 38.31 | 697 | 18.2 |
| 41.78 | 679 | 16.3 | |
| 39.66 | 653 | 16.5 | |
| 41.56 | 671 | 16.2 | |
| 49.17 | 630 | 12.8 | |
| 49.94 | 617 | 12.4 | |
| 50.66 | 598 | 11.8 | |
| 51.13 | 574 | 11.2 | |
| 252 | 8.92 | 1,810 | 203.6 |
| 254 | 9.83 | 1,625 | 165.9 |
| 268 | 29.14 | 1,103 | 37.9 |
| 32.2 | 1,101 | 34.2 | |
| 32.6 | 1,103 | 33.9 | |
| 32.6 | 1,087 | 33.3 | |
| 32.7 | 1,065 | 32.6 | |
| 32.5 | 1,069 | 32.9 | |
| 32.7 | 1,073 | 32.8 | |
| 32.9 | 1,065 | 32.4 | |
| 32.9 | 1,071 | 32.6 | |
| 287 | 90.0 | 1,280 | 14.2 |
| 1. Pumping tests made by the Division of Water Resources of the Kansas State Board of Agriculture in cooperation with the State and Federal Geological Surveys. Wells 91, 92, 213, 238, and 268 were tested by Melvin Scanlan and W. W. Wilson; wells 215, 217, 252, 254, and 287 were tested by K. D. McCall and M. H. Davison. 2. Battery of five wells. Measurement in one well. 3. Battery of six wells. Measurement in one well. 4. Well draws water from the alluvium and the underlying Tertiary and/or Quaternary sediments. |
|||
Half of the wells tested were in the Arkansas valley and half were in the shallow-water area north of the Arkansas valley. Most of the plants tested consisted of single wells equipped with turbine pumps; however, two plants in the Arkansas valley south of Deerfield each comprised batteries of wells connected to one centrifugal pump, as noted in the table. All the pumps were operated by electric motors. Measurements of the discharge were made using a Collins flow gage. An electrical contact device was used for measuring the draw-downs in the wells while pumping, and a steel tape was used for measuring the water levels when the pumps were not running. The yields of individual wells ranged from 480 to 1,103 gallons a minute, the draw-downs ranged from 12.5 feet to more than 90 feet, and the specific capacities ranged from 8.5 to 55.2. The two batteries of wells yielded 1,810 and 1,625 gallons a minute with draw-downs of 8.9 and 9.8 feet, respectively.
According to L. F. Roderick (personal communication), well 275, in sec. 31, T. 24 S., R. 35 W., in the Arkansas river valley about 2.5 miles southeast of Lakin, had a measured yield in 1938 of 4,480 gallons a minute. This is the largest known yield of any irrigation plant in the Hamilton-Kearny area; it was reported that at one time this plant had the largest yield of any irrigation plant in Kansas. It comprises a battery of six wells ranging in depth from 40.5 to 43 feet, each of which is equipped with an 18-inch perforated galvanized-iron casing. The water level in one well on August 6, 1940, was 13.6 feet below land surface. Water is drawn from the wells by a 12-inch centrifugal pump powered by an electric motor.
Construction of irrigation wells--Most of the irrigation wells in Hamilton and Kearny counties were constructed by professional well drillers; however, a few were drilled by farmers in areas where the water table is relatively shallow and the drilling of a well is comparatively easy. Several methods of well construction have been used in the Hamilton-Kearny area.
In the Arkansas valley, where the water table stands only a few feet below land surface, most of the irrigation wells are constructed by digging a pit nearly to the water table and then drilling a well through the bottom of the pit. The sides of the pit are walled with wood or concrete, The pump may be placed at or near ground level, but in most wells having pits it is placed at the bottom of the pit. Almost all the wells in the Arkansas valley are constructed with galvanized-iron casing but a few are constructed with concrete pipe or oil barrels. The casings generally are perforated to facilitate the entry of water into the well but these perforations may become closed by encrustation after several years of use.
Two types of wells are used for irrigation in the Arkansas valley; although the methods of construction are slightly different the same type of drilling equipment is used in both methods. One type is the gravel-wall well, the construction and advantages of which are described on page 83. The more common type of well in the Arkansas valley is not gravel packed and is constructed by sinking a screened or perforated casing as the well is being drilled. The material is removed by a sand bucket or sand pump and the casing is forced downward by weighting with sandbags.
Most of the irrigation plants in the Arkansas valley comprise two or more wells connected to one pump and commonly called a battery of wells. Such plants are used where the water table is relatively shallow and where the thickness of the water-bearing formation is limited. In the Arkansas valley in Hamilton County the alluvium is underlain by relatively impermeable shale so that it is necessary in most places to construct a battery of wells to obtain a large yield. In eastern Kearny County, however, the alluvium is underlain by additional water-bearing sands and gravels so that a single deep well will yield a large quantity of water. The so-called "second water" that is obtained from the Pliocene and/or Pleistocene deposits is softer than that in the overlying alluvium and is the water used by the city of Lakin for municipal supply. Only a few irrigation wells in the Arkansas valley in eastern Kearny County penetrate the sands and gravels below the alluvium. Additional wells in this area should penetrate all water-bearing formations in order to prevent excessive withdrawal from the alluvium. At present, most of the irrigation plants in this area comprise a battery of about five wells spaced 40 to 50 feet apart. The yield from a battery of wells is greater than the yield from a single well but the yield from each well is less than if the other wells were not being pumped.
There are several irrigation wells on the upland north of Arkansas river in eastern Kearny County. This area is the southwestern part of the Scott-Finney shallow-water basin, where the water level ranges in depth from 25 to about 70 feet below land surface. Several deep wells (275 to 384 feet) that were drilled there many years ago proved unsuccessful, but modern improvements in pumping equipment have made irrigation in this area feasible so that about 10 new wells have been drilled since 1935. Most of the new wells are between 200 and 350 feet in depth, are cased with galvanized-iron casing, and are equipped with electrically-driven turbine pumps.
Wells of greater capacity and efficiency could be obtained in the Hamilton-Kearny area if better methods of well construction were used. Those plants comprising only one well probably would have a greater capacity and greater efficiency if the wells were deepened to penetrate all the water-bearing formations. Many of the plants comprising two or more wells are poorly constructed and most battery wells are not spaced widely enough to prevent excessive mutual interference. In several plants the wells are not aligned in a direction at right angles to the direction of movement of the ground water, causing an increase in the mutual interference of the wells. Some of the wells in the Arkansas valley and in the Scott-Finney basin penetrate water-bearing formations that are so fine-grained that the wells should be gravel-packed in order to keep out the sand and obtain larger yields. Conversely, a few wells have been gravel-packed with gravel that is less satisfactory than the water-bearing material it replaced. Gravel-packing adds to the construction cost and should be used only where water in satisfactory quantities can be obtained in no other way and then only after a thorough study of the water-bearing material to determine the proper size of gravel to be used and, therefore, the proper slot size of the screen. For detailed descriptions of gravel-packing, the reader is referred to Rohwer (1940), Bennison (1943), and Davison (1939).
Depth and diameter of irrigation wells--Most of the irrigation wells in the Hamilton-Kearny area are 30 to 50 feet deep (table 10), a few are less than 30 feet deep, and 19 are more than 100 feet deep. Thirteen of the 19 deep wells are on the upland north of the Arkansas river valley.
Table 10--Irrigation wells in Hamilton and Kearny counties classified according to depth.
| Depth (in feet) |
Number of wells |
|---|---|
| Less than 30 | 7 |
| 30-40 | 26 |
| 41-50 | 37 |
| 51-100 | 7 |
| 101-200 | 8 |
| 201-300 | 5 |
| Greater than 300 | 6 |
| Total | 96 |
The diameters of the irrigation wells range from 8 to 24 inches (table 11). Most of the wells are cased with 15-, 16-, or 18-inch casing.
Table 11--Irrigation wells in Hamilton and Kearny counties classified according to diameter. For dug and drilled wells, diameter of drilled part is given.
| Diameter (in inches) |
Number of wells |
|---|---|
| 8 | 2 |
| 12 | 8 |
| 14 | 2 |
| 15 | 11 |
| 16 | 9 |
| 18 | 8 |
| 19 | 2 |
| 20 | 2 |
| 24 | 1 |
| Unknown | 11 |
| Total | 96 |
Types of irrigation pumps--Most irrigation wells in the Arkansas valley are equipped with horizontal or vertical centrifugal pumps, ranging in diameter of discharge pipe from 3 to 12 inches. All irrigation wells in the upland that are now in use and several irrigation wells in the valley are equipped with turbine pumps. There were 22 turbine pumps in use in the Hamilton-Kearny area in 1940.
Irrigation pump power--Electric motors are used to operate most of the pumps on irrigation wells in Hamilton and Kearny counties. A few pumps, however, are driven by tractors, gasoline engines, or natural-gas engines (table 12). The power units generally are belted to the pump pulleys, but some are direct-connected to the shafts. After the discovery of natural gas in southeastern Kearny County, a few farmers adopted natural-gas engines for power. This economical type of power probably will be more extensively used in the future. For a discussion of energy consumption of irrigation plants using electricity, gasoline, and natural gas, the reader is referred to McCall and Davison (1939).
Table 12--Type of power used for pumping irrigation wells in Hamilton and Kearny counties.
| Type of power | Number of wells |
|---|---|
| Electric motor | 76 |
| Gasoline engine | 13 |
| Natural-gas engine | 5 |
| Tractor | 2 |
| Total | 96 |
Possibilities of Further Development of Irrigation Supplies from Wells
The feasibility of further development of irrigation supplies from wells is dependent upon the safe yield of the ground-water reservoir (the amount of water that can be withdrawn annually over a long period of years without depletion), the cost of drilling and pumping, the types of soil, and perhaps other factors. The ability of an underground reservoir to yield water over a long period of years is limited, as is that of a surface reservoir. If water is withdrawn from an underground reservoir by pumping and by other means (seeps, springs, evaporation, and transpiration) faster than water enters it, the supply will be depleted and the water levels in wells will decline. The amount of water that can be withdrawn annually over a long period of years without depletion of the ground-water reservoir is dependent upon the capacity of the underground reservoir and upon the amount of water that is added annually to the reservoir by recharge.
The cost of drilling and pumping is determined in part by the depth to water level. In areas where the water level is relatively deep the wells must be deeper and the pumping lift is greater. The cost of a well is also determined in part by the permeability and the thickness of the materials. Some wells may encounter relatively fine-grained materials that cause the yield of the well to be relatively small. Gravel-packing may increase the yield somewhat, but it also adds to the cost.
The character of the soil is also an important factor. The soil may be too sandy in parts of the Arkansas valley and, in other parts of the valley where irrigation by surface water has been extensively practiced, the soil may have many "alkali" spots that support only slight plant growth.
For the purpose of more detailed description, Hamilton and Kearny counties may be divided into three areas based upon the possibilities of further development of irrigation supplies from wells: (1) Arkansas valley area, (2) Scott-Finney depression area, and (3) Stanton area.
Arkansas valley area--The capacity of the alluvium in the Arkansas valley appears to be large enough to withstand more pumping for irrigation, particularly in parts of the valley where there is little or no pumping at the present time. The water table in the valley is near the land surface so that pumping lifts are low. In the eastern part of the valley, water from more than 300 feet of water-bearing formations is available to irrigation wells. Also, conditions for recharge are more favorable in the Arkansas valley than in any other part of Hamilton and Kearny counties, with the possible exception of the sand-hills area.
The development of irrigation with water from wells usually results in a decline in the level of the water table. The fact that there is a decline in water levels during a period of development when the rate of withdrawal is increasing is not necessarily an indication of overdevelopment as long as the decline is not so great as to indicate the approach of pumping lifts beyond the economic limit. A study of the relations of water levels in observation wells to the amount of pumpage should furnish reliable information as to the safe yield of the underground reservoir. If the pumpage during a given period does not cause an appreciable permanent lowering of the water table, it may be concluded that the recharge has been about equal to the rate of discharge, including both natural discharge and the withdrawal from wells. Regardless of the diurnal fluctuations of water levels, if, at the end of any period, they return to approximately their original position, the record of withdrawal furnishes a measure of the recharge during the same period minus the natural discharge.
The water levels in the observation wells in the Arkansas valley showed a marked decline from the time observations were begun in September, 1939, until 1941 (figs. 11, 12, and 14). As a result of the above-normal precipitation in 1941 and in the spring of 1942, the water levels in these wells rose rapidly, however, so that in May, 1942, they were higher than they have been at any time since periodic water-level measurements were begun. The water levels in wells 252 and 278 (fig. 11) were first measured in 1924 and 1925, respectively, and since 1934 they have been measured once each year. In October, 1939, monthly measurements were begun on well 252. The measurements from 1934 to 1940 were made during one of the worst periods of drought since the area was first settled and, as a result, the water levels were much lower than they were at the time when the first measurements were made during,the years of above-normal precipitation in 1924 and 1925. As a result of the unusually large precipitation in 1941 and in the spring of 1942, the water levels in these wells were higher than they were when measurements were first made. These wells are in the most heavily pumped area in Hamilton and Kearny counties.
More than 23,000 acre-feet of water was pumped from wells for irrigation in the Arkansas valley in Hamilton and Kearny counties, in 1939. More than 3,500 acre-feet of this was used for irrigation in Finney County; the rest was used in Hamilton and Kearny counties. The water-level fluctuations during the period of record indicate that this rate of pumping is not depleting the ground-water reservoir and that some additional pumping can be undertaken without exceeding the safe yield. Much care, however, should be exercised in spacing the wells, in choosing the well sites, and in construction of the wells.
Further irrigation development could be made in several parts of the Arkansas valley in this area. North of Arkansas river between Lakin and Deerfield much of the land is not irrigated by water from wells, and many new wells probably could be drilled in this area without endangering the safe yield of the ground-water reservoir. The wells should be properly spaced and should penetrate both the alluvium and the underlying Tertiary and Quaternary deposits, which include nearly 300 feet of saturated sediments. South of the river between Lakin and Deerfield more water could be pumped for irrigation, but no additional wells should be drilled in the vicinity of the Garden City Company's project south of Deerfield because this locality probably is already overdeveloped. In 1939, about 20 percent of all the water withdrawn from wells in Hamilton and Kearny counties was pumped by the Garden City Company's 12 plants. Other areas between the river and the sand hills, however, could supply additional water for irrigation without permanently lowering the ground-water levels. Wells in this area should penetrate both the alluvium and the underlying Tertiary and Quaternary deposits. Single deep wells of this type probably would yield 750 to 1,500 gallons of water a minute.
There are only about 20 irrigation plants in the Arkansas valley in Hamilton County and much more water could be pumped for irrigation in that area, particularly north of Arkansas river. Throughout its course in Hamilton County, Arkansas river usually is a gaining stream. Flood waters that move down the channel probably contribute very little water to the ground-water reservoir before reaching the dry section of the stream in eastern Kearny County. If pumping for irrigation were sufficiently increased in the Arkansas valley in Hamilton County, the water level would decline until it would be lower than the level of the stream and Arkansas river would then become a losing stream in that part of its course. As a result, a large quantity of water would be contributed to the ground-water reservoir by the river whenever water moves down its channel. For this reason, it is believed that much more water could be pumped for irrigation in the Arkansas valley in Hamilton County.
The alluvium in most of the Arkansas valley in Hamilton County is underlain by the relatively impermeable Graneros shale; wells, therefore, should not be drilled below the base of the alluvium. Irrigation plants in this part of the valley commonly consist of a battery of shallow wells connected to one pump in order to obtain, greater efficiency. Such plants may be expected to yield 500 to 2,000 gallons of water a minute.
Scott-Finney depression area--Most of the recent development of irrigation with ground water in the Hamilton-Kearny area has been in the southwestern part of the Scott-Finney depression in eastern Kearny County. Considerable irrigation was done here many years ago by the Garden City Company, but this did not prove successful and many of the plants were abandoned. Modern improvements in well construction and in pump efficiency have resulted in the drilling of many new wells in this area since 1935. The water levels in these wells range in depth from about 25 to 100 feet. Because of the greater depth to water, more time is required for precipitation to percolate downward to the water table. Although there was heavy precipitation in 1941 and 1942, the water level in well 209 did not start to rise until the last half of 1941. The water level in well 286, which is at the edge of the valley, began to rise in the fall of 1940. The water level in well 286 was higher in May, 1942, than at anytime since periodic water-level measurements were begun in 1939. The water level in well 209 responded more slowly to the precipitation but exceeded its previous high level by the end of 1942. The records of the water-level fluctuations indicate that, more water could be safely withdrawn from the groundwater reservoir in this area, much of which is undeveloped as far as irrigation using water from wells is concerned.
Irrigation from wells could be developed in most of T. 23 S., R. 39 W., in the south half of T. 24 S., R. 40 W., and in upland part of T. 24 S., R. 39 W. The northernmost irrigation well in the upland north of Deerfield is well 187 in sec. 33, T. 22 S., R. 39 W. West of the areas mentioned above, the pumping lift is too great to permit economical pumping of water for irrigation. The thickness of the saturated sediments decreases rapidly northward so that north of T. 23 S. careful test drilling is necessary before drilling irrigation wells. Irrigation wells in the Kearny County part of the Scott-Finney shallow-water area should penetrate most or all of the water-bearing sediments, which in much of the area exceed 300 feet in thickness. Single irrigation wells here could be expected to yield 500 to 1,500 gallons a minute.
Stanton area--A small amount of irrigation probably could be developed in the Stanton area in southwestern Hamilton County, particularly between Little Bear creek and the 100-foot isobath line (pl. 2). Irrigation wells would have to penetrate all of the saturated material, which probably would not exceed 150 feet. A few plants have been successfully operated in northern Stanton County a few miles southeast of this area. The yields of these wells range from 450 to 800 gallons a minute (Latta, 1941, pp. 51-54).
The above discussion on possibilities of further development of irrigation with water from wells is based entirely upon geologic and hydrologic observations. Many other factors will play an important part in determining the location and extent of irrigation; among these are such factors as character of the soil, type of crops to be grown, and shape and slope of the land to be irrigated.
Quality of Water
The chemical character of the ground waters in Hamilton and Kearny counties is shown by the analyses given in tables 13 and 14. The analyses were made by E. O. Holmes in the Water and Sewage Laboratory of the Kansas State Board of Health. Fifty samples of water were collected from representative wells distributed as uniformly as possible within the area and among the water-bearing formations. The analysis of the water supply at Lakin (listed as well 293) is an analysis of a composite sample from two wells. The constituents listed were determined by methods used by the U. S. Geological Survey.
Table 13--Analyses of waters from typical wells in Hamilton County, Kansas. Analyzed by E. O. Holmes. Values are in parts per milliona with equivalents per millionb shown in italics as the second value in a cell.
| No. on plate 2 | Location | Depth feet |
Geologic subdivision |
Date of collection, 1940 |
Temperature (°F) |
Iron (Fe) |
Calcium (Ca) |
Magnesium (Mg) |
Sodium and potassium (Na+K) (c) |
Bicarbonate (HCO3) |
Sulphate (SO4) |
Chloride (Cl) |
Fluoride (F) |
Nitrate (NO3) |
Total dissolved solids |
Hardness (calculated as CaCO3) |
||
|---|---|---|---|---|---|---|---|---|---|---|---|---|---|---|---|---|---|---|
| Total | Carbonate | Non-carbonate | ||||||||||||||||
| 6 | T. 21 S., R. 40 W. SE SE sec. 8 |
204 | Pliocene and Pleistocene | Nov. 26 | 56 | 3.7 | 46 2.30 |
16 1.32 |
41 1.79 |
182 2.98 |
77 1.60 |
20 0.56 |
1.5 0.08 |
12 0.19 |
308 | 188 | 149 | 39 |
| 16 | T. 21 S., R. 42 W. NW SW sec. 36 |
135 | Pliocene and Pleistocene | Nov. 26 | 59 | 0.35 | 52 2.59 |
22 1.81 |
22 0.94 |
199 3.26 |
63 1.31 |
23 0.65 |
0.7 0.03 |
5.8 0.09 |
288 | 221 | 163 | 58 |
| 27 | T. 22 S., R. 43 W. SE SE sec. 2 |
53 | Pliocene and Pleistocene | Nov. 26 | 57 | 0.76 | 54 2.69 |
23 1.89 |
46 1.99 |
193 3.16 |
127 2.64 |
23 0.65 |
0.6 0.03 |
5.3 0.09 |
376 | 231 | 158 | 73 |
| 28 | SE SE sec. 4 | 516 | Dakota | Nov. 26 | 63 | 0.44 | 20 1.00 |
9.7 0.80 |
161 6.98 |
243 3.99 |
186 3.87 |
29 0.87 |
1.3 0.07 |
1.6 0.03 |
531 | 91 | 91d | 0 |
| 38 | T. 23 S., R. 40 W. SW SW sec. 32 |
260 | Dakota | Nov. 26 | 60 | 0.14 | 52 2.59 |
37 3.04 |
187 8.13 |
238 3.90 |
382 7.95 |
63 1.78 |
1.8 0.09 |
2.2 0.04 |
844 | 282 | 195 | 87 |
| 39 | SW SW sec. 35 | 65 | Pliocene and Pleistocene | Nov. 26 | 58 | 0.9 | 40 2.00 |
14 1.15 |
12 0.53 |
183e 3.00 |
18 0.37 |
5.5 0.16 |
0.4 0.02 |
8 .03 |
190 | 159 | 150 | 9 |
| 52 | T. 23 S., R. 43 W. NW NW sec. 22 |
33 | Alluvium | Nov. 26 | 57 | 0.18 | 520 25.95 |
154 12.66 |
375 16.32 |
226 3.71 |
2247 46.74 |
144 4.06 |
1.2 0.06 |
22 0.36 |
3,576 | 1,931 | 185 | 1,746 |
| 54 | NE NW. sec. 23 | 156 | Dakota | Nov. 26 | 57 | 0.9 | 52 2.59 |
18 1.48 |
64 2.77 |
206 3.38 |
137 2.85 |
19 0.54 |
0.9 0.05 |
1.3 0.02 |
396 | 205 | 169 | 36 |
| 57 | SW NE sec. 24 | 287 | Cheyenne | Nov. 26 | 58 | 0.5 | 62 3.09 |
23 1.89 |
51 2.23 |
204 3.35 |
167 3.47 |
12 0.34 |
0.8 0.04 |
0.7 0.01 |
419 | 250 | 167 | 83 |
| 65 | T. 24 S., R. 39 W. SE SE sec. 1 |
150 | Pliocene and Pleistocene | Nov. 26 | 5.9 | 7 | 42 2.10 |
9.3 0.77 |
6.9 0.30 |
150 2.46 |
19 0.40 |
5 0.14 |
0.5 0.03 |
8.9 0.14 |
174 | 156 | 123 | 33 |
| 68 | T. 24 S., R. 39 W. SE NE sec. 20 |
21 | Alluvium | Nov. 25 | 57 | 0.13 | 506 25.25 |
208 17.10 |
681 29.62 |
326 5.35 |
2794 58.12 |
270 7.90 |
1.5 0.08 |
32 0.52 |
4,666 | 2,118 | 267 | 1,851 |
| 71 | NW SE sec. 35 | 65 | Dakota | Nov. 25 | 57 | 2.1 | 60 2.99 |
15 1.23 |
34 1.47 |
161 2.64 |
124 2.58 |
15 0.42 |
0.7 0.04 |
0.4 0.01 |
332 | 215 | 132 | 83 |
| 94 | T. 24 S., R. 41 W. SE SE sec. 6 |
10 | Alluvium | Nov. 26 | 61 | 3 | 59 2.94 |
14 1.15 |
22 0.95 |
204 3.35 |
68 1.41 |
6 0.17 |
0.6 0.03 |
4.9 0.08 |
277 | 205 | 167 | 38 |
| 100 | NE NE sec. 24 | 82 | Pleistocene | 0.04 | 54 2.69 |
10 0.82 |
34 1.48 |
159 2.61 |
79 1.64 |
4 0.11 |
0.3 0.02 |
7.1 0.11 |
303 | 176 | 130 | 46 | ||
| 104 | T. 24 S., R. 42 W. | 225 | Dakota | Nov. 25 | 61 | 4.6 | 42 2.10 |
19 1.56 |
58 2.52 |
203 3.33 |
122 2.54 |
9 0.25 |
1.1 0.06 |
0.2 0.0 |
357 | 192 | 166 | 26 |
| 106 | T. 24 S., R. 43 W. SE SE sec. 10 |
60 | Pliocene and Pleistocene | Nov. 26 | 58 | 0.7 | 167 8.33 |
48 3.95 |
37 1.62 |
320 5.25 |
215 4.47 |
56 1.58 |
0.7 0.04 |
159 2.56 |
843 | 616 | 262 | 354 |
| 113 | T. 25 S., R. 39 W. SE SW sec. 22 |
100 | Dakota | Nov. 25 | 59 | 27 | 40 2.00 |
26 2.14 |
74 3.23 |
305 5.00 |
94 1.96 |
9.3 0.26 |
2.6 0.14 |
0.8 0.01 |
400 | 208 | 208f | 0 |
| 117 | T. 25 S., R. 40 W. NW NW sec. 7 |
200 | Dakota | Nov. 25 | 58 | 2.8 | 54 2.69 |
25 2.06 |
150 6.51 |
329 5.40 |
228 4.74 |
34 0.96 |
2.9 0.15 |
0.5 0.01 |
662 | 243 | 243g | 0 |
| 121 | SW SE sec. 22 | 276 | Dakota | Nov. 25 | 59 | 0.9 | 41 2.05 |
31 2.55 |
60 2.62 |
290 4.76 |
95 1.98 |
11 0.31 |
3.3 0.17 |
0.2 0.0 |
387 | 232 | 232h | 0 |
| 126 | T. 25 S., R 41 W. NE NE sec. 5 |
250 | Dakota | Nov. 25 | 60 | 7 | 59 2.94 |
29 2.38 |
162 7.02 |
337 5.53 |
276 5.74 |
32 0.90 |
2.6 0.14 |
1.6 0.03 |
738 | 279 | 276 | 3 |
| 132 | T. 25 S., R. 42 W. NW NW sec. 6 |
165 | Dakota | Nov. 25 | 50 | 1.6 | 44 2.20 |
20 1.64 |
66 2.86 |
255 4.18 |
97 2.02 |
12 0.34 |
2.2 0.12 |
2 0.04 |
372 | 195 | 195i | 0 |
| 139 | T. 26 S., R. 39 W. SE SW sec. 22 |
254 | Dakota | Nov. 25 | 58 | 3.4 | 44 2.20 |
24 1.97 |
94 4.07 |
288 4.72 |
145 3.02 |
12 0.34 |
2.8 0.15 |
0.7 0.01 |
470 | 215 | 215j | 0 |
| 143 | T. 26 S., R. 40 W. NW NW sec. 1 |
210 | Dakota | Nov. 25 | 56 | 2.4 | 40 2.00 |
41 3.37 |
48 2.10 |
322 5.28 |
80 1.66 |
12 0.34 |
3.2 0.17 |
1.1 0.02 |
389 | 273 | 264 | 9 |
| 151 | T. 26 S., R. 41 W. NE SE sec. 2 |
145 | Dakota | Nov. 25 | 58 | 2.1 | 85 9.24 |
34 2.79 |
29 1.27 |
312 5.12 |
90 1.87 |
31 0.87 |
0.6 0.03 |
26 0.41 |
454 | 356 | 256 | 100 |
| 156 | T. 26 S., R. 42 W. NW SW sec. 7 |
100 | Pliocene and Pleistocene | Nov. 25 | 59 | 0.63 | 66 3.29 |
19 1.56 |
20 0.88 |
153 2.51 |
130 2.70 |
12 0.34 |
0.7 0.04 |
8.4 0.14 |
333 | 244 | 125 | 119 |
| a. One part per in million is equivalent to one pound of substance per million pounds of water or 8.33 pounds per million gallons of water. | ||||||||||||||||||
| b. An equivalent per million (e.p.m.) is a unit
chemical equivalent weight of solute per million unit weights of solution. Concentration in equivalents per million is calculated by dividing concentration in parts per million by the chemical combining weight of the substance or ion. |
||||||||||||||||||
| c. Calculated. | ||||||||||||||||||
| d. Total alkalinity, 199 parts per million; excess alkalinity, 108 parts per million. | ||||||||||||||||||
| e. Includes equivalent of 2.4 parts per million of carbonate (CO3). | ||||||||||||||||||
| f. Total alkalinity, 250 parts per million; excess alkalinity, 42 parts per million. | ||||||||||||||||||
| g. Total alkalinity, 270 parts per million; excess alkalinity, 27 parts per million. | ||||||||||||||||||
| h. Total alkalinity, 238 parts per million; excess alkalinity, 6 parts per million. | ||||||||||||||||||
| i. Total alkalinity, 209 parts per million; excess alkalinity, 14 parts per million. | ||||||||||||||||||
| j. Total alkalinity, 236 parts per million; excess alkalinity, 21 parts per million. | ||||||||||||||||||
Table 14--Analyses of waters from typical wells in Kearny County, Kansas. Analyzed by E. O. Holmes. Values are in parts per milliona with equivalents per millionb shown in italics as the second value in a cell.
| No. on plate 2 | Location | Depth feet |
Geologic subdivision |
Date of collection, 1940 |
Temperature (°F) |
Iron (Fe) |
Calcium (Ca) |
Magnesium (Mg) |
Sodium and potassium (Na+K) (c) |
Bicarbonate (HCO3) |
Sulphate (SO4) |
Chloride (Cl) |
Fluoride (F) |
Nitrate (NO3) |
Total dissolved solids |
Hardness (calculated as CaCO3) |
||
|---|---|---|---|---|---|---|---|---|---|---|---|---|---|---|---|---|---|---|
| Total | Carbonate | Non-carbonate | ||||||||||||||||
| 166 | T. 21 S., R. 35 W. NE SW sec. 6 |
120 | Pliocene and Pleistocene | Nov. 8 | 59 | 0.47 | 55 2.74 |
30 2.47 |
44 1.91 |
225 3.69 |
96 2.00 |
39 1.10 |
1.7 0.09 |
15 0.24 |
394 | 262 | 184 | 78 |
| 171 | NE NW sec. 35 | 80 | Pliocene and Pleistocene | Nov. 8 | 58 | 0.76 | 46 2.30 |
22 1.81 |
28 1.22 |
220 3.61 |
52 1.08 |
16 0.45 |
1.3 0.07 |
7.5 0.12 |
284 | 207 | 180 | 27 |
| 3 | T. 21 S., R. 36 W. SW NW sec. 27 |
100 | Pliocene and Pleistocene | Nov. 8 | 58 | 0.62 | 47 2.35 |
27 2.22 |
48 2.08 |
210 3.44 |
99 2.06 |
30 0.85 |
1.9 0.10 |
12 0.20 |
371 | 230 | 172 | 58 |
| 176 | T. 21 S., R. 37 W. SW NW sec. 4 |
112 | Pliocene and Pleistocene | Nov. 8 | 59 | 0.57 | 45 2.25 |
33 2.71 |
36 1.57 |
209 3.43 |
83 1.73 |
32 0.90 |
2 0.11 |
22 0.36 |
358 | 249 | 171 | 78 |
| 183 | T. 21 S., R. 88 W. NE SE sec. 19 |
162 | Pliocene and Pleistocene | Nov. 7 | 59 | 0.43 | 51 2.54 |
31 2.55 |
46 2.01 |
173 2.84 |
161 3.35 |
25 0.71 |
1.3 0.07 |
8 0.13 |
410 | 256 | 142 | 114 |
| 193 | T. 22 S., R. 36 W. NW NW sec. 22 |
180 | Pliocene and Pleistocene | Nov. 8 | 59 | 0.39 | 41 2.05 |
18 1.48 |
19 0.82 |
190 3.12 |
38 0.79 |
10 0.28 |
1.1 0.06 |
6.2 0.10 |
229 | 176 | 156 | 20 |
| 199 | T. 22 S., R. 37 W. SE SE sec. 34 |
154 | Pliocene and Pleistocene | Nov. 7 | 59 | 2.4 | 64 3.19 |
22 1.81 |
43 1.85 |
185 3.03 |
144 3.00 |
20 0.56 |
0.9 0.05 |
13 0.21 |
402 | 255 | 152 | 103 |
| 203 | T. 22 S., R. 38 W. NW NW sec. 14 |
180 | Pliocene and Pleistocene | Nov. 7 | 60 | 7.8 | 54 2.69 |
25 2.06 |
37 1.59 |
185 3.03 |
122 2.54 |
22 0.62 |
1.1 0.06 |
5.8 0.09 |
367 | 252 | 152 | 100 |
| 207 | T. 23 S., R. 35 W. SW NW sec. 12 |
75 | Pliocene and Pleistocene | Nov. 8 | 58 | 0.71 | 56 2.79 |
23 1.89 |
21 0.89 |
216 3.54 |
68 1.41 |
16 0.45 |
0.9 0.05 |
7.5 0.12 |
301 | 236 | 177 | 59 |
| 214 | NW NW sec. 29 | 65 | Pliocene and Pleistocene | Nov. 8 | 59 | 0.71 | 56 2.79 |
22 1.81 |
17 0.74 |
212 3.48 |
61 1.27 |
17 0.48 |
0.5 0.03 |
4.9 0.08 |
285 | 232 | 174 | 58 |
| 228 | T. 23 S., R. 38 W. SE NE sec. 5 |
250 | Pliocene and Pleistocene | Nov. 7 | 60 | 4.2 | 51 2.54 |
29 2.38 |
60 2.60 |
106d 3.05 |
170 3.54 |
27 0.76 |
1.5 0.08 |
5.8 0.09 |
441 | 254 | 152 | 102 |
| 230 | SW SE sec. 25 | 223 | Pliocene and Pleistocene | Nov. 7 | 61 | 0.22 | 33 1.65 |
19 1.56 |
14 0.61 |
162e 2.66 |
40 0.83 |
6 0.17 |
0.8 0.05 |
7.1 0.11 |
201 | 161 | 133 | 28 |
| 234 | T. 24 S., R. 35 W. SE NE sec. 3 |
36 | Pleistocene | Nov. 8 | 57 | 0.51 | 276 13.77 |
66 5.43 |
196 8.52 |
229 3.76 |
966 20.09 |
128 3.61 |
0.6 0.03 |
14 0.23 |
1,762 | 961 | 188 | 773 |
| 270 | NW NW sec. 29 | 25 | Alluvium | Nov. 9 | 58 | 0.21 | 253 12.63 |
132 10.85 |
297 12.92 |
237 3.89 |
1420 29.54 |
100 2.82 |
1.6 0.08 |
4.4 0.07 |
2,327 | 1,175 | 104 | 981 |
| 288 | T. 24 S., R. 36 W. SW SE sec. 22 |
25 | Alluvium | Nov. 9 | 62 | 0.18 | 222 11.08 |
105 8.63 |
225 9.77 |
361 5.92 |
944 19.64 |
133 3.75 |
1.6 0.08 |
5.3 0.09 |
1,817 | 986 | 296 | 690 |
| 293 | NW NW sec. 27 | 273 | Pliocene and Pleistocene | 0.08 | 163 8.13 |
49 4.03 |
42 1.81 |
174 2.85 |
457 9.51 |
52 1.47 |
0.8 0.04 |
8.8 0.14 |
964 | 608 | 143 | 465 | ||
| 306 | T. 24 S., R. 37 W. SE SE sec. 20 |
200 | Pliocene and Pleistocene | Nov. 8 | 60 | 0.9 | 33 1.65 |
14 1.15 |
10 0.45 |
168 2.76 |
16 0.33 |
1.8 0.05 |
0.7 0.04 |
4.4 0.07 |
165 | 141 | 38 | 3 |
| 310 | T. 24 S., R. 38 W. NE NE sec. 6 |
174 | Pliocene and Pleistocene | Nov. 7 | 59 | 1.3 | 41 2.05 |
13 1.07 |
9.2 0.40 |
136d 2.23 |
40 0.83 |
6 0.17 |
0.5 0.03 |
6.2 0.10 |
190 | 159 | 119 | 40 |
| 311 | SW SW see. 22 | 145 | Pliocene and Pleistocene | Nov. 8 | 60 | 0.84 | 54 2.69 |
18 1.48 |
25 1.09 |
189 3.10 |
86 1.79 |
9.5 0.27 |
1.2 0.06 |
2.2 0.04 |
291 | 210 | 155 | 55 |
| 315 | T. 25 S., R. 35 W. SE NE sec. 2 |
50 | Pleistocene | Nov. 9 | 59 | 0.25 | 59 2.94 |
11 0.90 |
18 0.78 |
183 3.00 |
62 1.29 |
9 0.25 |
0.7 0.04 |
2.7 0.04 |
254 | 193 | 50 | 43 |
| 341 | T. 25 S., R. 37 W. SW SE sec. 10 |
16 | Alluvium | Nov. 8 | 60 | 0.64 | 323 16.12 |
114 9.37 |
349 15.16 |
215 3.53 |
1620 33.70 |
115 8.24 |
1.3 0.07 |
6.6 0.11 |
2,637 | 1,276 | 176 | 1,100 |
| 348 | T. 25 S., R. 38 W. NW NW sec. 11 |
15 | Alluvium | Nov. 8 | 59 | 0.28 | 45 2.25 |
19 1.56 |
19 0.81 |
185 3.03 |
62 1.29 |
8 0.23 |
0.9 0.05 |
1.2 0.02 |
248 | 191 | 152 | 39 |
| 355 | T. 26 S., R. 87 W. SW SW sec. 35 |
160 | Pliocene and Pleistocene | Nov. 9 | 63 | 2.7 | 58 2.89 |
32 2.63 |
109 4.74 |
227 3.72 |
272 5.66 |
25 0.71 |
2.5 0.13 |
2.2 0.04 |
617 | 281 | 186 | 95 |
| 356 | T. 26 S., R. 38 W. SW SW sec. 3 |
160 | Pliocene and Pleistocene | Nov. 9 | 60 | 0.33 | 44 2.20 |
26 2.14 |
16 0.68 |
243 3.99 |
28 0.58 |
11 0.31 |
1.6 0.08 |
4 0.06 |
252 | 218 | 199 | 19 |
| 359 | SW SW sec. 34 | 135 | Pliocene and Pleistocene | Nov. 9 | 61 | 0.71 | 57 2.84 |
40 3.29 |
38 1.65 |
215 3.53 |
159 3.31 |
25 0.71 |
1.7 0.09 |
8.4 0.14 |
437 | 306 | 176 | 130 |
| a. One part per in million is equivalent to one pound of substance per million pounds of water or 8.33 pounds per million gallons of water. | ||||||||||||||||||
| b. An equivalent per million (e.p.m.) is a unit
chemical equivalent weight of solute per million unit weights of solution. Concentration in equivalents per million is calculated by dividing concentration in parts per million by the chemical combining weight of the substance or ion. |
||||||||||||||||||
| c. Calculated. | ||||||||||||||||||
| d. Includes equivalent, of 4.8 parts per million of carbonate (CO3). | ||||||||||||||||||
| c. Includes equivalent of 3.6 parts per million of carbonate (CO3). | ||||||||||||||||||
Chemical Constituents in Relation to Use
The following discussion of the chemical constituents of ground water in relation to use has been adapted from publications of the United States Geological Survey.
Total dissolved solids--When water is evaporated the residue that is left consists mainly of the mineral constituents listed above and generally includes a small quantity of organic material and a little water of crystallization. Waters containing less than 500 parts per million of dissolved solids generally are entirely satisfactory for domestic use, except for difficulties resulting from their hardness or occasional excessive content of iron. Waters containing more than 1,000 parts per million are likely to include enough of certain constituents to produce a noticeable taste or to make the water unsuitable in some other respects.
The total dissolved solids in samples of water collected in Hamilton and Kearny counties ranged from 165 to 4,666 parts per million. The samples from more than half of the wells contained between 200 and 400 parts per million of dissolved solids (table 15). Two-thirds of the samples of water contained less than 500 parts per million and are, therefore, suitable for most ordinary purposes.
Table 15--Total dissolved solids in water samples from wells in Hamilton and Kearny counties.
| Total dissolved solids (parts per million) |
Number of samples |
|---|---|
| 101-200 | 4 |
| 201-300 | 10 |
| 301-400 | 16 |
| 401-500 | 7 |
| 501-1,000 | 7 |
| 1,001-2,000 | 2 |
| 2,001-3,000 | 2 |
| 3,001-4,000 | 1 |
| 4,001-5,000 | 1 |
| Total | 50 |
Hardness--The hardness of water, which is the property that receives the most attention as a general rule, is most commonly recognized by its effects when soap is used with the water in washing. Calcium and magnesium cause almost all the hardness of ordinary water. These constituents are also the active agents in the formation of the greater part of all the scale formed in steam boilers and in other vessels in which water is heated or evaporated.
In addition to the total hardness, the tables of analyses show the carbonate hardness and the noncarbonate hardness. The carbonate hardness is that due to the presence of calcium and magnesium bicarbonates and can be almost entirely removed by boiling. In some reports this type of hardness is called temporary hardness. The noncarbonate hardness is due to the presence of sulphates or chlorides of calcium and magnesium; it cannot be removed by boiling and has sometimes been called permanent hardness. With reference to use with soaps, there is no difference between the carbonate and noncarbonate hardness. In general, the noncarbonate hardness forms harder scale in steam boilers.
Water having a hardness of less than 50 parts per million generally is rated as soft, and its treatment for the removal of hardness under ordinary circumstances is not necessary. Hardness between 50 and 150 parts per million does not seriously interfere with the use of water for most purposes; however, it does slightly increase the consumption of soap, and its removal by a softening process is profitable for laundries or other industries using large quantities of soap. Waters in the upper part of this range of hardness will cause considerable scale on steam boilers. Hardness above 150 parts per million can be noticed by anyone, and if the hardness is 200 or 300 parts per million it is common practice to soften water for household use or to install cisterns to collect soft rain water. Where municipal water supplies are softened, an attempt is generally made to reduce the hardness to 60 or 80 parts per million. The additional improvement from further softening of a whole public supply is not deemed worth the increase in cost.
Water samples collected in Hamilton and Kearny counties ranged in hardness from 91 to 2,118 parts per million. Thirty-nine of the samples of water had a hardness between 100 and 300 parts per million (table 16). The hardness of eight samples exceeded 400 parts per million.
Table 16--Hardness of water samples from wells in Hamilton and Kearny counties.
| Hardness (parts per million) |
Number of samples |
|---|---|
| Less than 100 | 1 |
| 101-9-00 | 12 |
| 201-300 | 27 |
| 301-400 | 2 |
| 401-1,000 | 4 |
| More than 1,000 | 4 |
| Total | 50 |
Iron--Next to hardness, iron is the constituent of natural waters that in general receives the most attention. The quantity of iron in ground waters may differ greatly from place to place, even though the waters are derived from the same formation. If a water contains much more than 0.1 part per million of iron, the excess may precipitate and settle as a reddish sediment. Iron, which may be present in sufficient quantity to give a disagreeable taste and to stain cooking utensils, may be removed from most waters by simple aeration and filtration, but a few waters require the addition of lime or some other substance.
All but three of the samples of water collected in the Hamilton-Kearny area contained more than 0.1 part per million of iron (table 17). More than 60 percent of the samples contained less than one part per million and five samples contained more than four parts per million of iron.
Table 17--Iron content of water samples from wells in Hamilton and Kearny counties.
| Iron (parts per million) |
Number of samples |
|---|---|
| Less than 0.1 | 3 |
| 0.1-1.0 | 32 |
| 1.1-2.0 | 2 |
| 2.1-3.0 | 6 |
| 3.1-4.0 | 2 |
| More than 4.0 | 5 |
| Total | 50 |
Fluoride--Although determinable quantities of fluoride are not so common as fairly large quantities of the other constituents of natural water, it is desirable to know the amount of fluoride present in water that is likely to be used by children. Fluoride in water has been shown to be associated with the dental defect known as mottled enamel, which may appear on the teeth of children who, during the period of formation of the permanent teeth, drink water containing fluoride. It has been stated that waters containing one part per million or more of fluoride are likely to produce mottled enamel, although the effect of one part per million is not usually very serious (Dean, 1936). If the water contains as much as four parts per million of fluoride, 90 percent of the children drinking the water are likely to have mottled enamel, and 35 percent or more of the cases will be classified as moderate or worse.
More than half of the water samples that were collected in this area contained fluoride in excess of one part per million (table 18). The amount of fluoride in the water samples ranged from 0.3 part to 3.3 parts per million.
Table 18--Fluoride content of water samples from wells in Hamilton and Kearny counties.
| Iron (parts per million) |
Number of samples |
|---|---|
| Less than 1 | 22 |
| 1.0-2.0 | 20 |
| 2.1-3 | 6 |
| More than 3 | 2 |
| Total | 50 |
Water for irrigation--The suitability of water for use in irrigation is commonly believed to depend mainly on the total quantity of soluble salts and on the ratio of the quantity of sodium to the total quantity of sodium, calcium, and magnesium. The quantity of chloride may be large enough to affect the use of the water and in some areas other constituents, such as boron, may be present in sufficient quantity to cause difficulty. In a discussion of the interpretation of analyses with reference to irrigation in southern California, Scofield (1933) states that if the total concentration of dissolved salts is less than 700 parts per million there is not much probability of harmful effects in irrigation use. If it exceeds 2,100 parts per million, there is a strong probability of damage to either the crops or the land, or both. Water containing less than 50 percent sodium (the percentage being calculated as 100 times the ratio of the sodium to the total bases, in equivalents) is not likely to be injurious, but if it contains more than 60 percent its use is inadvisable. Similarly, a chloride content less than 142 parts per million is not objectionable, but more than 355 parts per million is undesirable. It is recognized that the harmfulness of irrigation water is so dependent on the nature of the land and the crops, on the manner of use and the drainage that no hard and fast limits can be adopted.
The amount of dissolved solids in nine of the 50 water samples collected in Hamilton and Kearny counties exceeded 700 parts per million. Four of these samples contained more than 2,100 parts per million of dissolved solids and (according to Scofield) probably are unsuitable for irrigation use. The chloride content of only two samples exceeded 142 parts per million and none exceeded the upper limit of 355 parts per million as set by Scofield. The water from four wells contained more than 50 percent sodium, the percentage ranging from 51.9 to 79.5. All of these samples, however, were obtained from wells that draw water from the Dakota formation in areas where irrigation is not feasible.
Sanitary Considerations
The analyses of water given in tables 13 and 14 show only the amounts of dissolved mineral matter in the water and do not indicate the sanitary quality of the water. An abnormal amount of certain mineral matter, such as nitrate, however, may indicate pollution of the water.
About half of the population of Hamilton and Kearny counties is dependent upon private water supplies from wells, and every precaution should be taken to protect these supplies from pollution. A well should not be located where there are possible sources of pollution, such as barnyards, privies, and cesspools, and every well should be tightly sealed down to a level somewhat below that of the water table. As a general rule, dug wells are more subject to contamination from surface water than are drilled wells, chiefly because they generally are not effectively cased or sealed at the surface. Drilled wells generally are well protected by the casing, although many are poorly sealed at the top.
Quality in Relation to Water-Bearing Formations
The quality of water from the four principal water-bearing formations in Hamilton and Kearny counties is shown in figure 16 and is discussed below.
Figure 16--Analyses of waters from the principal water-bearing formations in Hamilton and Kearny counties.
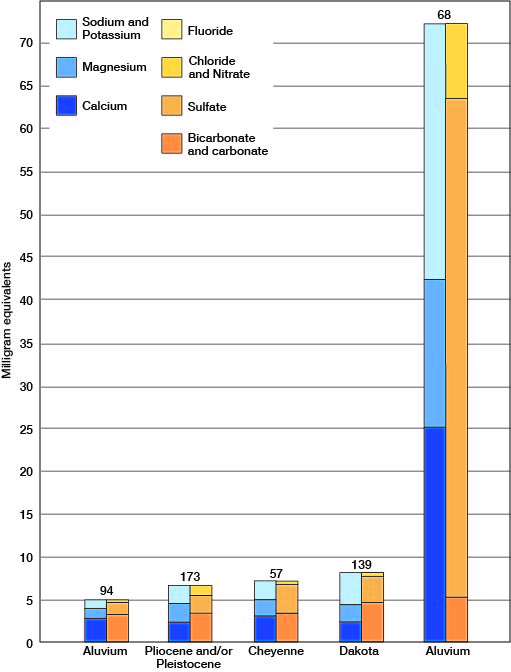
Cheyenne sandstone--The Cheyenne sandstone yields water to flowing wells in the vicinity of Coolidge in western Hamilton County. One sample of water from this formation was analyzed. The sample contained 419 parts per million of dissolved solids and had a hardness of 250 parts per million. It also contained 204 parts per million of bicarbonate and 167 parts per million of sulphate. A few analyses were made by Parker (1911, pp. 104, 105) of water from the Cheyenne sandstone in 1908. One sample contained 483 parts per million of dissolved solids. The sulphate content of four samples ranged from 171 to 222 parts per million and two samples contained 191 and 200 parts per million of bicarbonate.
Dakota formation--Some wells in the western part of Kearny upland and most of the wells in the Syracuse upland obtain water from sandstones of the Dakota formation. Samples of water collected from 13 of these wells ranged in hardness from 91 to 356 parts per million, and averaged about 230 parts per million. The amount of dissolved solids ranged from 332 to 844 parts per million. All but three of the samples contained sufficient fluoride to be harmful to children's teeth. The average fluoride content of the 13 samples was two parts per million. The water from the Dakota formation is comparable in chemical character to the sample of water from the Cheyenne sandstone except that the fluoride content of the Dakota water is higher than the fluoride content of the single sample from the Cheyenne.
Water from the Dakota formation differs from water in the other water-bearing formations in that the ratio of sodium to the total bases is relatively high. This ratio exceeded 50 percent in four of the water samples taken from wells in the Dakota formation. The highest ratio was 79.5 percent in water from well 28. Water from well 28 contained 531 parts per million of dissolved solids, but its hardness was only 91 parts per million. This relatively soft sodium bicarbonate water may represent calcium bicarbonate water that has exchanged its calcium and magnesium for sodium by reaction with base-exchange silicates in the rock as it percolated through the formation. The base-exchange silicates probably are the clay-forming minerals in the Dakota formation. The degree of softening depends upon the amount and softening capacity of base-exchange silicates in the clay and upon the length of time the hard water remains in contact with these silicates. Water in deep wells probably is softer than water in shallow wells because a greater time probably would be required for the water to percolate from the surface down the dip of the bed and possibly because of exhaustion of the softening capacity of the materials nearer the surface. Water in well 28, referred to above, was encountered at a depth of 495 feet.
Undifferentiated Pliocene and Pleistocene deposits--The Pliocene deposits, comprising the Ogallala formation, and the sands and gravels of Pleistocene age yield water to many wells in this area, particularly in Kearny County. Because of the similarity of these deposits and because a large number of the wells probably obtain water from both groups of sediments, the quality of the water from both formations will be discussed in one section.
Samples of water from these deposits range in hardness from 141 to 961 parts per million; the average hardness is about 270 parts per million. The hardest water collected was from well 234 which derives its water entirely from Pleistocene deposits and the softest water collected was from well 306 which probably obtains most of its water from Pliocene deposits. The total dissolved solids in waters from the Pliocene and Pleistocene sediments averaged 410 parts per million. The amount ranged from 165 parts per million in water from well 306 to 1,762 parts per million in water from well 234. The fluoride content of these waters averaged about 1.06 parts per million, and ranged from 0.3 to 2.5 parts. Thirteen of the 29 water samples collected from wells in these deposits contained more than one part per million of fluoride and may be harmful to children's teeth.
Alluvium--Water from wells in the alluvium of the Arkansas river valley is relatively hard. The waters from seven of these wells ranged in hardness from 191 to 2,118 parts per million and averaged about 1,126 parts per million. The amount of total dissolved solids ranged from 248 to 4,666 parts per million. The fluoride content of water from these wells is also relatively high. The average fluoride content of seven samples was 1.2 parts per million. Water from wells in the alluvium near the north edge of the sand hills between Hartland and Coolidge is relatively soft. This is caused by the northward movement of the softer water from the sand-hills area.
Analyses of water from Arkansas river were made in 1906 and 1907 at the chemical laboratories of the University of Kansas (Parker, 1911, pp. 283, 284). The total dissolved solids in 26 samples that were analyzed ranged from 410 to 2,179 parts per million. The average amount of dissolved solids was 1,571 parts per million. The bicarbonate content averaged 231 parts per million and the sulphate content, averaged 826 parts per million.
Prev Page--Recharge and Discharge || Next Page--Formations
Kansas Geological Survey, Geology
Placed on web Oct. 25, 2007; originally published December 1943.
Comments to webadmin@kgs.ku.edu
The URL for this page is http://www.kgs.ku.edu/General/Geology/Hamilton/05_gw3.html