![]()
Prev Page--Geology || Next Page--Recharge and Discharge
Ground Water
Principles of Occurrence
This discussion of the principles governing the occurrence of ground water takes account of conditions in Hamilton and Kearny counties. Preparation of the discussion has been based chiefly on the authoritative and detailed treatment of the occurrence of ground water by Meinzer (1923), to which the reader is referred for more extended consideration. A general discussion of the principles of ground-water occurrence, with special reference to Kansas, has been published by Moore (1940).
The rocks that make up the outer crust of the earth generally are not entirely solid, but have numerous openings, called voids or interstices, which may contain air, natural gas, oil, or water. The number, size, shape, and arrangement of the interstices in rocks depend upon the character of the rocks. The occurrence of water in any region is therefore determined by the geology.
The interstices or voids in rocks range in size from microscopic openings to the huge caverns found in some limestones. The open spaces generally are connected so that water may percolate from one to another, but in some rocks these open spaces are isolated and the water has little chance to percolate. In Hamilton and Kearny counties, the rocks from which most of the ground water is obtained are sandstones and poorly consolidated sands and gravels. Generally the sands and gravels of the Tertiary and Quaternary deposits contain many interstices through which water percolates freely; locally these interstices may be filled with calcium carbonate, clay, or other materials that make the rock relatively impermeable. Much of the silt, sand, and gravel of the Ogallala formation and of the undifferentiated Pleistocene deposits is poorly sorted and the finer particles fill much of the space between the larger particles, thereby decreasing the amount of space available to ground water. The sandstones of the Cheyenne and Dakota formations are cemented with iron oxide, calcium carbonate, or silicon dioxide. The cement occupies a part of the spaces between sand grains, but enough voids are left to contain some water.
The porosity of a rock is the percentage of the total volume of the rock that is occupied by interstices. A rock is said to be saturated when all its interstices are filled with water or other liquid, and the porosity is then practically the percentage of the total volume of rock that is occupied by water. The porosity of a rock determines only the amount of water a given rock can hold, not the amount it may yield to wells. Some rocks may be highly porous but will not yield an appreciable amount of water to a well. The specific yield of a water-bearing formation is defined as the ratio of (1) the volume of water which, after being saturated, it will yield by gravity to (2) its own volume. It is a measure of the yield when it is drained by a lowering of the water table. The permeability of a water-bearing material is defined as its capacity for transmitting water under hydraulic head, and is measured by the rate at which it will transmit water through a given cross section under a given difference of head per unit of distance. A rock containing very small interstices may be very porous, but it would be difficult to force water through it, whereas a coarser-grained rock, although it may have less porosity, generally is much more permeable. Some water is held in rocks by the force of molecular attraction, which, in fine-grained rocks, is sufficiently great to make the rock relatively impermeable.
Below a certain level in the earth's crust, the permeable rocks generally are saturated with water and are said to be in the zone of saturation. The upper surface of the zone of saturation is called the ground-water table, or simply the water table. All the rocks above the water table are in the zone of aeration, which ordinarily consists of three parts: The belt of soil water; the intermediate, or vadose zone; and the capillary fringe.
The belt of soil water lies just below the land surface and contains water held by molecular attraction. In this belt the amount of water must exceed that which will be held by gravity before any water can percolate downward to the water table. The thickness of the zone is dependent upon the character and thickness of the soil and upon the precipitation and vegetation.
The intermediate belt lies between the belt of soil water and the capillary fringe. In this belt the interstices in the rocks contain some water held by molecular attraction, but also may contain appreciable quantities of water while it is moving downward from the belt of soil moisture to the ground-water table. The intermediate belt may be absent, in places, such as in some river valleys where the water table is near the surface, or it may be more than 200 feet thick, as it is in parts of Hamilton and Kearny counties.
The capillary fringe lies directly above the water table and is formed by water rising from the zone of saturation by capillary action. The water in the capillary fringe is not available to wells, which must be deepened to the zone of saturation before water will enter them. The capillary fringe may be absent or very thin in coarse-grained sediments, in which the capillary action is negligible, or it may be several feet thick in fine-grained sediments.
Water in Sand and Gravel
In Hamilton and Kearny counties, water is found in unconsolidated deposits of sand and gravel in the alluvium of the Arkansas river valley, in the Ogallala formation, and in the undifferentiated Pleistocene sediments. The history of deposition of these deposits is given under Geologic history; their character, distribution and thickness, origin, age and correlation, and water supply are described under Geologic formations and their water-bearing properties.
The sorting action of the streams, on these sediments resulted in the deposition of many distinct beds of gravel, sand, silt, and clay. Deposits of such uniform texture may have a relatively high porosity. Coarse, well-sorted gravel of this type has a relatively high specific yield and permeability, and properly constructed wells in this material yield large quantities of water. Some of the stream-laid material is poorly sorted and finer materials occupy much of the pore space between the larger, grains, reducing, the porosity and specific yield.
The deposits of sand and gravel in the alluvium of Arkansas river are among the most important sources, of ground water in the Hamilton-Kearny area. Most of the irrigation and public-supply wells in this area obtain water from these deposits. The yields of wells ending in alluvium range from a few gallons to more than 4,000 gallons a minute.
The Ogallala formation and the undifferentiated Pleistocene deposits also supply water for irrigation wells; in addition they are the source of water for many domestic and stock supplies, particularly in Kearny County.
Water in Sandstone
The particles comprising a sandstone generally are more even-grained and better sorted than those found in unconsolidated sand and gravel. These particles are held together by cementing material that in some places fills the interstices and prevents water from percolating through them. Near Hartland, in Kearny County, the sandstones of the Dakota formation are tightly cemented with silicon dioxide and are relatively impermeable. In most of the area where wells obtain water from the sandstones in the Dakota formation, the water-bearing beds are moderately permeable and yield supplies of water adequate for most domestic and stock needs.
Some water may be found also in the Codell sandstone member in the upper part of the Carlile shale.
Water in Shale
Shale is formed by the induration of clay or of clayey mixtures; it generally has a relatively low specific yield and yields little or no water to wells. In some areas the shale may have many open joints and bedding planes and consequently a higher permeability; in other areas it may contain sand grains in sufficient quantity to make it somewhat permeable. In parts of northwestern Hamilton County, the Codell sandstone member of the Carlile shale is a sandy shale and yields small quantities of water to a few stock wells. Little or no, water is obtained from other parts of the Carlile shale, however.
Water in Limestone and Chalk
Limestones range greatly in their ability to yield water to wells. Large interconnecting cavities or caverns may be formed in limestones by the solvent action of percolating waters, and wells that penetrate such openings in the rocks below the water table generally obtain large supplies of water. In places where the limestone contains only small cracks and crevices, however, little or no water may be secured from wells. Some wells in Hamilton County obtain small amounts of water from the Greenhorn and Fort Hays limestones. These formations have a relatively small number of open spaces, principally joints and bedding planes.
Chalk is a soft friable limestone and may yield moderate quantities of water to wells. Shaly limestones and calcareous shale are intermediate in composition between limestone and shale and may also yield moderate quantities of water to wells. The Smoky Hill chalk member of the Niobrara formation, which underlies the northern part of the Hamilton-Kearny area, is made up of compact shaly chalk and yields little or no water to wells in this area because of its low permeability and because, in much of the area, it lies above the water table.
Permeability of Water-bearing Materials
The rate of movement of ground water is determined by the size, shape, quantity, and degree of interconnection of the interstices and by the hydraulic gradient from one point to another. The capacity of a water-bearing material for transmitting water under hydraulic head is its permeability. The coefficient of permeability may be expressed as the rate of flow of water, in gallons a day, through a cross-sectional area of 1 square foot under a hydraulic gradient of 100 percent, at a temperature of 60° F. (Meinzer's coefficient; see Stearns, 1927, p. 148.) The coefficient of transmissibility is a similar measure and may be defined as the number of gallons of water a day transmitted through each one-foot strip extending the height of the aquifer under a unit-gradient (Theis, 1935, p. 520). The coefficient of transmissibility may also be expressed as the number of gallons of water a day transmitted through each section 1 mile wide extending the height of the aquifer, under a hydraulic gradient of 1 foot to the mile.
The coefficient of transmissibility is equivalent to the coefficient to permeability (corrected for temperature) multiplied by the thickness of the aquifer.
The coefficient of permeability of water-bearing materials can be determined in the laboratory (methods summarized by V. C. Fishel in Wenzel, 1942, pp. 56-58) or in the field. Five pumping tests were made in Hamilton and Kearny counties between December 1, 1941, and March 27, 1942, by Melvin S. Scanlan of the Division of Water Resources of the Kansas State Board of Agriculture and Woodrow W. Wilson of the Federal Geological Survey. Discharge measurements were made using a Collins flow meter, and draw-down and recovery measurements were made using a steel tape and/or an electrical measuring device.
C. V. Theis (1935) has shown that to the extent that Darcy's law governs the motion of ground water under natural conditions and under the artificial conditions set up by pumping, an analogy exists between the hydrologic conditions in an aquifer and thermal conditions in a similar thermal system. Darcy's law is analogous to the law of the flow of heat by conduction, hydraulic pressure being analogous to temperature, hydraulic gradient to thermal gradient, permeability to thermal conductivity, and specific yield to specific heat. From his final equation expressing the relation between the draw-down and the rate and duration of discharge of a well, Theis developed the following recovery formula for determining the transmissibility of an aquifer (as defined above)
in which T = coefficient of transmissibility
q = pumping rate, in gallons a minute
t = time since pumping began, in minutes
t1 = time since pumping stopped, in minutes
s = residual draw-down at the pumped well, in feet, at time t1.
The residual draw-down (s) is computed by subtracting the static water-level measurement (table 3) from depth-to water-level measurements made after pumping stops (fig. 9). The proper ratio
is determined graphically by plotting log10 (t/t1) against corresponding values of s (fig. 9). This procedure is simplified by plotting t/t, on the logarithmic coordinate of semi-logarithmic paper. For any convenient value log10 (t/t1), the corresponding value for s may be found by inspection, provided the curve passes through the origin. If the curve does not pass through the origin, it can be made to do so approximately by applying an empirical correction to the formula as follows:
in which c is a correction factor (Wenzel, 1942, p. 127). The curves for two tests in Hamilton and Kearny counties (wells 92 and 23S) did not pass through the origin. The correction factors needed to make these curves pass through the origin were +525 and +105, respectively.
Table 3--Data on pumping test of well 91, Hamilton County, made on March 13, 1942.
| Time since pumping started (minutes) t |
Time since pumping stopped (minutes) t1 |
t/t1 | Yield (gallons a minute) |
Depth to water level (feet) |
Drawdown (feet) |
Remarks |
|---|---|---|---|---|---|---|
| 25.97 | Static water level | |||||
| Pump started | ||||||
| 9 | 532 | 30.0 | 4.0 | |||
| 34 | 528 | |||||
| 64 | 520 | 34.4 | 8.0 | |||
| 94 | 534 | 34.55 | 8.58 | |||
| 124 | 531 | 34.55 | 8.58 | |||
| 154 | 525 | 34.56 | 8.59 | |||
| 184 | 524 | 35.34 | 9.37 | |||
| 202 | Pump stopped | |||||
| 204 | 2 | 102 | 27.70 | 1.73 | ||
| 207 | 5 | 41.4 | 27.56 | 1.59 | ||
| 214 | 12 | 17.67 | 27.37 | 1.40 | ||
| 224 | 22 | 11.82 | 27.19 | 1.22 | ||
| 229 | 27 | 8.48 | 27.12 | 1.15 | ||
| 244 | 42 | 5.81 | 26.96 | .99 | ||
| 259 | 57 | 4.54 | 26.82 | .85 | ||
| 279 | 77 | 3.62 | 26.71 | .74 | ||
| 299 | 97 | 3.08 | 26.60 | .63 | ||
| 314 | 112 | 2.80 | 26.55 | .58 | ||
| 329 | 127 | 2.59 | 26.49 | .52 | ||
| 359 | 157 | 2.28 | 26.40 | .43 | ||
| 389 | 187 | 2.04 | 26.36 | .39 | ||
| 419 | 217 | 1.93 | 26.31 | .34 |
Figure 9--A, Recovery curve for well 91; B, Curve for pumping test on well 91 obtained by plotting s against t/t1.
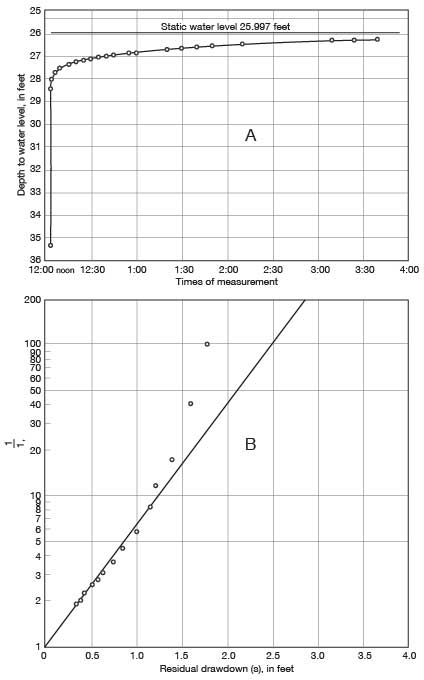
The weighted average discharge (q) of well 91 was 527.2 gallons a minute (table 3). When values for s, t/t1, and q are substituted in the Theis recovery formula, the coefficient of transmissibility of the water-bearing material at the pumped well is found to be 111,300. Dividing the coefficient of transmissibility by the average thickness of the saturated water-bearing material in the vicinity of the well, 60 feet, the coefficient of permeability is found to be about 1,855 (The temperature of the water was 60°F., hence no temperature correction is needed).
Data on the five pumping tests in Hamilton and Kearny counties are listed in table 4.
As indicated in table 4, the coefficient of permeability of the alluvium of the Arkansas valley is much greater than that of the other water-bearing formations penetrated by irrigation wells in the Hamilton-Kearny area. The undifferentiated Pliocene and Pleistocene deposits generally are comprised of silt and sand containing some gravel, whereas the alluvium generally is predominantly sand and gravel.
Table 4--Results of pumping tests in Hamilton and Kearny counties.
| Well no | Water-bearing formation | Discharge (gallons a minute) |
Drawdown (feet) |
Duration of pumping (minutes) |
Specific capacity (a) |
Coefficient of transmissibility |
Approximate thickness of water-bearing material (feet) |
Coefficient of permeability (b) |
|---|---|---|---|---|---|---|---|---|
| 91 | Alluvium | 527 | 11.51 | 202 | 45.8 | 11,300 | 60 | 1,855 |
| 92 | Alluvium | 708 | 10.86 | 180 | 65.2 | 546,800 | 60 | 9,113 |
| 213 | Undifferentiated Pliocene and Pleistocene deposits | 812 | 32.55 | 184 | 24.9 | 79,000 | 320 | 247 |
| 238 | Undifferentiated Pliocene and Pleistocene deposits | 637 | 61.13 | 251 | 10.4 | 98,100 | 350 | 280 |
| 268 | Alluvium and undifferentiated Pliocene and Pleistocene deposits | 1,080 | 19.38 | 216 | 55.6 | 187,500 | 340 | 552 |
| a. The specific capacity of a well is its rate of yield per unit of draw-down and is determined by dividing the tested capacity in gallons a minute by the draw-down in feet. | ||||||||
| b. Coefficient of transmissibility divided by thickness of saturated water-bearing material; water temperature 60°F., hence no correction for temperature is needed. | ||||||||
Artesian Conditions
The head of water has been defined as the height that a column of water will rise in a tightly cased well that has no discharge. Ground water that rises in wells above the level at which it is first encountered is said to be artesian or "piestic" water (Meinzer and Wenzel, 1942, p. 451).
In some of the rock formations in Hamilton and Kearny counties, strata of relatively permeable rock, principally sandstone, alternate with relatively impermeable beds, such as shale or clay. In this area, the strata dip generally northeastward so that water falling on the outcrop area of a permeable bed moves northeastward down the dip between the confining layers of relatively impermeable material and saturates the permeable strata. Under such conditions, wells drilled to the water-bearing beds in this area, encounter water under artesian head, and in the vicinity of Coolidge in western Hamilton County this head is sufficient to cause them to flow.
Artesian water has been encountered in wells in most of the Syracuse upland area in southern Hamilton County and southwestern Kearny County, in the Arkansas valley in western Hamilton County, and in a part of the Kearny upland area in northwestern Hamilton County. In the vicinity of Coolidge the water in about nine wells is under sufficient pressure to flow at.the surface, but the yields of individual wells do not exceed 30 gallons a minute.
In southern Hamilton County, water under artesian pressure is encountered in the sandstones of the Dakota formation. The height above the water table to which water from the Dakota formation will rise is extremely variable. Some wells penetrated sandstone so tightly cemented that it yields very little water. In other wells in this area, the water will rise as much as 125 feet above the top of the formation, or to within 75 feet of the surface.
Only a few wells in the Syracuse upland area have penetrated the Cheyenne sandstone. Water from this formation generally will rise in wells to a level a few feet higher than the water level in wells that penetrate the Dakota formation. A well in the center of T. 26 S., R. 39 W., however, is reported to have penetrated both the Dakota formation and the Cheyenne sandstone, and encountered water at a depth of nearly 500 feet. The water did not rise in the well.
At least three wells in northwestern Hamilton County have encountered water that is under artesian pressure. The wells penetrated sandstones of the Dakota formation. A well (11) of Dan Huser encountered the Dakota formation at a depth of 800 feet and the water rose to about 450 feet below the land surface. When the well was pumped, however, the water level was drawn down to about 750 feet below land surface. The Jacob Behrendt well (29), in the SE sec. 4, T. 22 S., R. 43 W., encountered the Dakota formation at 480 feet and water rose to about 355 feet below land surface. The Fred Behrendt well (28) in the same section encountered a sandstone in the Dakota formation at 495 feet and the water rose to about 370 feet below land surface. Artesian water probably could be obtained from both the Cheyenne sandstone and the Dakota formation in much of the Kearny upland area, but these beds lie at such great depths in this area that it is unprofitable to obtain water from them.
In the vicinity of Coolidge, in the Arkansas valley in western Hamilton County, many wells have encountered water that is under sufficient artesian pressure to cause them to flow. The first artesian well was reported by Mr. J. W. Egger (personal communication) to have been drilled in 1885, but most of the wells were drilled during the period from 1907 to 1910. Many of the wells were reported to have yielded initially as much as 75 gallons a minute (Haworth, 1913) and the water was under sufficient head to cause it to rise nearly 20 feet above the land surface. At present the wells yield from less than 1 to more than 25 gallons a minute and the water will rise in some wells to more than 10 feet above the land surface. The decrease in flow and the apparent decrease in head are probably due to faulty well construction rather than to the depletion of the water supply.
Water under artesian head is obtained from both the Cheyenne sandstone and the Dakota formation in this area. The first artesian water is encountered in a sandstone at the top of the Dakota formation. The water rises to a level between 25 feet below and 5 feet above the static level of the water in the alluvium. No flow is obtained from wells that end in this bed, which is encountered at depths of 80 to 110 feet. Some wells encounter artesian water in a second sandstone bed near the base of the Dakota formation. The water from this bed will rise higher than that from the upper zone. One well (61) that penetrates this bed has a flow of nearly 30 gallons a minute; its initial flow was more than 60 gallons a minute. All but one of the flowing wells obtain water from the Cheyenne sandstone--the third zone, which is encountered at depths of 250 to 300 feet.
The area in which artesian flow probably could be obtained is limited to the Arkansas valley in R. 43 W. and the west half of R. 42 W. Many more wells probably could be drilled in this area without seriously depleting the supply, but they should be properly constructed and should not be permitted to flow except when the water is needed. The source of the water in these beds is discussed under the section on ground-water recharge.
The Water Table
The upper surface of the zone of saturation in ordinary permeable soil or rock has been defined as the ground-water table, or simply the water table. Where the upper surface is formed by impermeable material, as it is in parts of Hamilton County, the water table is absent. The water table is not a plane surface in all parts of the area, but in some places has irregularities comparable with and related to those of the land surface, although it is less rugged. It does not remain in a stationary position but fluctuates up and down. The irregularities are due chiefly to local differences in grain and loss of water, and the fluctuations are due to variations from time to time in gain or loss.
Shape and Slope
The shape and slope of the water table in Hamilton and Kearny counties is shown on the map (pl. 1) by contour lines drawn on the water table. Each point on the water table on a given contour line has the same altitude. These water-table contours show the configuration of the water surface just as topographic contour lines show the shape of the land surface. The direction of movement of the ground water is at right angles to the contour lines in the direction of the downward slope.
In the Kearny upland in northern Hamilton County and in the Syracuse upland in southern Hamilton County and southwestern Kearny County the water-table contours are not shown. Northwestern Hamilton County is underlain in part by relatively impermeable beds; therefore, there is no water table in much of this area. In northeastern Hamilton County, water is encountered at several places at greatly varying depths. The bodies of water are not continuous but are probably "perched" on the shales and chalks of the Carlile and Niobrara formations. These "perched" water tables cannot be shown accurately on the water-table contour map.
In the Syracuse upland, wells obtain water from sandstones of the Dakota formation. The water is under artesian head and may rise from less than 1 foot to more than 100 feet above the point at which it is encountered. This difference in the levels to which the water will rise, together with the fact that the Dakota formation has been faulted and uplifted so that it is in some places at an altitude greater than that of the static water level in adjacent areas, makes it impracticable to draw water-table contour lines for this area.
The map (pl. 1) shows that the general direction of movement of the ground water in Hamilton and Kearny counties is east-southeastward, but that the slope and the direction of movement range considerably from one part of the area to another. The maximum slope is in the northeastern part of Kearny County and is nearly 40 feet to the mile. The minimum slope is in the sand-hills area in the vicinity of Bear creek in south central Kearny County and is about 4 feet to the mile. The average slope in the northern part of the area is about 12 feet to the mile; along the Arkansas valley it is 9.5 feet to the mile; and along the southern border of the area it is about 10 feet to the mile.
The shape and slope of the water table, which determine the rate and direction of movement of ground water, are controlled by several factors. Irregularities in the shape and slope of the water table in the Hamilton-Kearny area may be caused by: (1) the configuration of the underlying Cretaceous floor; (2) discharge of ground water into streams (3) recharge of the ground-water reservoir by ephemeral streams; (4) unequal additions of water to the ground-water reservoir at different places; (5) local differences in the permeability of the deposits; and (6) local depressions on the water table caused by the pumping of water from wells.
The shape of the bedrock floor formed by the underlying Cretaceous rocks controls to some degree the direction of movement of the ground water in this area. The water table in northern Kearny County slopes eastward and southeastward as does the surface of the Cretaceous bedrock (pl. 3). The unusually steep slope of the water table in northeastern and northwestern Kearny County is probably not entirely due to the slope of the Cretaceous floor. A lower permeability or thinner section of the Ogallala formation in this area would tend to increase the slope of the water table.
South of Arkansas river in Kearny County the water table has a more gentle slope, particularly in the southeastern part of the county. The Cretaceous bedrock surface (pl. 3) has a similar slope; however, the relatively high permeability of the gravels in this area probably is the most important factor affecting the slope of the water table. In the Arkansas valley, particularly between Coolidge and Hartland, the slope of the water table is approximately the same as that of the bedrock floor--about 8 feet to the mile, whereas east of Hartland there is no apparent relation between them.
The shape and slope of the water table and the direction of movement of the ground water are also influenced in this area by the discharge of ground water into Arkansas river. In the Arkansas valley in Hamilton County there is a slight upstream flexure of the contour lines indicating that the water is moving toward the river as well as down the valley. In eastern Kearny County the upstream flexure is very pronounced; this is due in part to heavy pumpage of water for irrigation in the valley between Lakin and the Finney county line. Before irrigation was begun in this area, Arkansas river probably had water in it throughout its course through Hamilton and Kearny counties. At that time the water level in eastern Kearny County probably was at about the same altitude as the water level in the northern part of the sand-hills area to the south, but was not as high as the water level in the area north of the river.
Streams that flow only after rains are termed ephemeral or intermittent streams. Their channels lie above the water table and are dry much of the time. During periods of stream flow, part of the water in an ephemeral stream may seep into the stream bed and move downward to the ground-water reservoir. A stream of this type is said to be influent. Bear creek is an excellent example of this type of stream because the dune sand has choked its channelway and prevents the water from emptying into Arkansas river. After each flood, therefore, much of the water must stand in the channelway until it evaporates and/or percolates downward to the water table. Because of its permeable nature, the sand and gravel that underlie the channel permit relatively free passage of the water downward to the ground-water reservoir. The elongated mound on the water table in the southern part of T. 26 S., R. 37 W. (pl. 1) is the result of this type of recharge. In the northern part of T. 26 S., R. 37 W. the channel receives much less flood water; as a result there is no water-table mound but merely a local flattening of an otherwise uniform slope. In southwestern Hamilton County Little Bear creek contributes some water to the ground-water reservoir, but sufficient, data are not available to determine the quantity. The addition of water to the ground-water reservoir by Arkansas river is discussed on pages 70 and 71.
Unequal additions of water to the ground-water reservoir have caused some of the irregularities in the shape of the water table in the Hamilton-Kearny area. In some places, where surface conditions are favorable for ground-water recharge, the water that percolates downward tends to build up the water table to form slight mounds or locally to lessen the slope of the water table. In material of low permeability these mounds or ridges may be relatively high, but in more permeable material the slopes generally are gentle. In the eastern part of T. 22 S., R. 35 W. the slope of the water table changes abruptly from about 20 feet to the mile to about 5 feet to the mile. Farther east in Finney county the slope increases to nearly 10 feet to the mile. This local flattening of the water table is probably due to the recharge of the ground-water reservoir by water from shallow depressions or sink holes. The southeastward flowing intermittent streams in the Kearny upland area terminate in these depressions. After heavy rains the water stands in the depressions until it evaporates and/or percolates downward to the water table. Similar depressions in other parts of the Kearny upland also contribute some water to the ground-water reservoir.
Similar and more favorable conditions for the addition of water to the ground-water reservoir are to be found in the sand-hills area where there are many undrained basins underlain by relatively permeable rocks. There are probably many small mounds on the water table in the sand hills, but there are so few wells that data are lacking for showing such mounds on the water-table contour map.
Local differences in the permeability of the water-bearing beds may also affect the shape and slope of the water table. Other things being equal, the slope of the water table in any area, in general, varies inversely with the permeability of the water-bearing material. If the material has a low permeability, the slope of the water table is relatively steep because of the frictional resistance offered by the small interstices through which the water must move. The relatively steep slope in the northern part of Kearny County is due, at least in part, to the relatively low permeability (locally) of the Ogallala formation through which the water must pass. The gentle slope of the water table in the sand-hills area in Kearny County is caused by the relatively high permeability of the water-bearing material in that area. The sand hills are underlain by thick deposits of coarse sand and gravel.
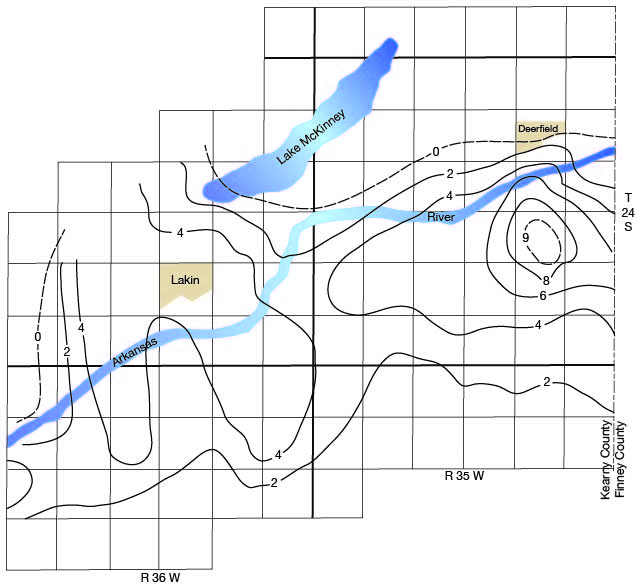
The very sharp upstream flexures of the contour lines in the Arkansas valley in eastern Kearny County are due primarily to heavy pumpage by the irrigation wells. The water level is lowered during the pumping season but rises after pumping has ceased. The map (pl. 1) is based on water-level measurements made during the summer of 1940 when there was much pumpage. As shown in figure 10, the water level was greatly lowered in this area in the summer of 1940, but in December, 1941, after pumping had ceased and following many months of above normal precipitation, the water level in the most heavily pumped area had risen as much as 9 feet above the 1940 level.
Figure 10--Map of the Arkansas valley in eastern Kearny County showing the changes in water level between August, 1940, and December, 1941.
Relation to Topography
The depth to water level below land surface in the Hamilton-Kearny area is controlled largely by the configuration of the land surface. A map (pl. 2) has been prepared showing by isobath lines the depths to water level in wells in Hamilton and Kearny counties. Isobath lines are lines that connect points of equal depth to water level. No attempt was made to draw isobath lines in the western part of the Kearny upland or in the Syracuse upland. In the western part of the Kearny upland it is difficult to find water. It may be encountered in the alluvium of the small intermittent streams, in the sand and gravel just above the Cretaceous bedrock floor, in the Fort Hays limestone member of the Niobrara formation, in the Codell sandstone member of the Carlile shale, or in the sandstones of the Dakota formation. When water is encountered in the Dakota formation it may rise several feet in the well or it may rise several hundred feet. It is, therefore, impracticable to draw isobath lines showing depth to water in this area, for it is difficult to predict at what horizon a supply of water will be found and to what height the water will rise if it is under artesian head. A similar problem exists in the Syracuse upland; however, there it is not so difficult to obtain water because the Dakota formation lies at a much shallower depth. The height to which the water will rise in the well, however, is unpredictable, as it is in the western part of the Kearny upland.
As shown on the map (pl. 2), the depths to water level in the Hamilton-Kearny area range from about 5 feet in the Arkansas river valley to 450 feet on the Kearny upland in northern Hamilton County. The water table is shallowest in the alluvium of the Arkansas river valley and deepest in sandstones of the Dakota formation. For the purpose of detailed description, Hamilton and Kearny counties may be divided into seven areas based upon the depths to water level: (1) Arkansas valley area, (2) Scott-Finney depression area, (3) sand-hills area, (4) Bear Creek depression area, (5) Kearny upland area, (6) Syracuse upland area, and (7) Stanton area. These areas are the same as the topographic divisions, and their locations and areal extents are described in the section on Topography and drainage.
The depths to water level in many of the wells shown on plate 2 are not in complete agreement with the depths to water level in 1913 as reported by Darton (1920, Underground-water maps). This is particularly evident in the Stanton area in southwestern Hamilton County where the average depth to water in 19 wells (as reported by Darton) was 35 feet in 1913. The average depth to water in nine wells in the same area was 102 feet in 1940. Well 158 (plate 2) is 109 feet deep and the static water level in 1940 was about 88 feet. Darton reported that in 1913 a well at the same location was 61 feet deep and had a static water level of 16 feet. Similarly, the water level in well 160 was 64.5 feet below land surface in 1940, whereas in a well at the same site it was reported to be 22 feet in 1913. The depth of well 160 was 78 feet, whereas the depth of the well reported by Darton was 93 feet.
These discrepancies do not necessarily indicate that the water levels have declined greatly since 1913. In fact, the depths to water level in many of the wells reported by Darton were about the same or even greater than in wells measured in 1940. The water level in a well near the middle of the city of Johnson was reported by Darton to be 240 feet below land surface. The water level in a well at Johnson in 1939 was about 165 feet and the water levels in wells near Johnson ranged from 146 to 183 feet below land surface (Latta, 1941, pl. 2). In addition, Darton reported that the water level in a well 200 feet deep in the northern part of Johnson was 10 feet below land surface. This indicates that the water level in one or both of the wells did not represent the main water table. It also indicates that although some water may have been encountered at a depth of 10 feet in the north well the quantity was probably inadequate for domestic and/or stock needs; otherwise the well would not have been drilled or dug to a depth of 200 feet. The average depth of wells reported by Darton is about the same as the average depth of the wells measured in 1940, which probably means that the upper water was "perched" water and hence may not, have been adequate for most needs. A few wells, however, probably were able to obtain a moderate supply from bodies of "perched" water, for it is believed that these wells were not deep enough to reach the main zone of saturation. Most of the early wells in this area were dug, and because of the slow process of construction the relatively poor water-bearing materials were noticed. The newer wells, however, generally are drilled so rapidly that poor water-bearing beds probably are overlooked. Furthermore, the dug wells were able to utilize these zones of poor water-bearing material because their large diameter provided a large infiltration area and allowed ample storage of water. These wells, however, were more liable to fail in dry weather and for that reason most of them probably were deepened to the main zone of saturation. In the modern drilled wells the zones of poor water-bearing material generally are cased off and the water is taken only from the main zone of saturation.
Arkansas valley area--The Arkansas valley is a shallow-water area in which water can be obtained in wells at depths ranging from about 5 to nearly 20 feet; the depths of the wells range from about 10 to nearly 275 feet. The alluvium is the principal water-bearing material, but some of the deeper wells also draw water from the underlying undifferentiated Pleistocene deposits. At Kendall, Syracuse, and in the vicinity of Coolidge some wells penetrate the Dakota formation and the Cheyenne sandstone. The water in wells that penetrate these formations in the Arkansas valley rises nearly to or above the land surface.
An unusual feature of the Arkansas valley is Clear lake, in the NE sec. 13, T. 25 S., R. 37 W., south central Kearny County. The lake, when measured by Slichter (1906, p. 18) in 1904, was 320 feet in length, 280 feet, wide at its narrowest point, and about 16 feet deep. Clear lake probably occupies one of the many depressions or sink holes found in the High Plains area. The surface of the lake represents the level of the water table.
Scott-Finney depression area--As stated in the section on topography and drainage, it is difficult to distinguish the western limit of the Scott-Finney depression because it gradually merges into the Kearny upland. In this discussion the limits shown in figure 2 will be used. The wells in this area range in depth from about 25 feet to nearly 400 feet and the water levels are 20 to 70 feet below the land surface. The shallow wells obtain water from the unconsolidated gravels of Pleistocene age, and the deeper wells obtain water from both Tertiary and Quaternary deposits.
Sand-hills area--The water table in the sand-hills area south of Arkansas river is 25 to almost 125 feet below the land surface. The water level in most of the sand-hills area is less than 50 feet below land surface but in southeastern Kearny County the depth to water level exceeds 100 feet. The wells in this area range in depth from about 30 feet to more than 150 feet. The 50-foot isobath line is a dashed line in most of this area (pl. 2) because of the lack of sufficient control points.
Bear Creek depression area--The Bear Creek depression comprises a relatively small, elongated area in south central Kearny County. Only a few wells were measured in this area and they range in depth from 30 to 60 feet. The depths to water level in the wells that were measured range from 26 to 34 feet below land surface. The principal water-bearing beds are the sands and gravels of Pleistocene age, at least part of which are terrace deposits of Arkansas river.
An unusual feature of the Bear Creek depression area in pioneer days was a "natural well" in the SE sec. 16, T. 26 S., R. 37 W. At this place there was a small pond, similar to Clear lake, that was fed by ground water. The surface of the pond represented the surface of the water table. In recent years the pond has been filled by migrating dune sand.
Kearny upland area--The largest deep-water area is the Kearny upland in northern Hamilton and Kearny counties. Water is obtained principally from the unconsolidated sands and gravels of Tertiary and Quaternary age. In that part of the area where isobath lines are drawn (pl. 2) the water levels range in depth below land surface from about 50 feet at a point near the Scott-Finney depression to more than 225 feet in west central Kearny County. In the western part of the Kearny upland most of the wells encounter water either in the Ogallala formation, the Codell sandstone member of the Carlile shale, or the Dakota formation. The depths of the wells range from about 60 feet to more than 800 feet.
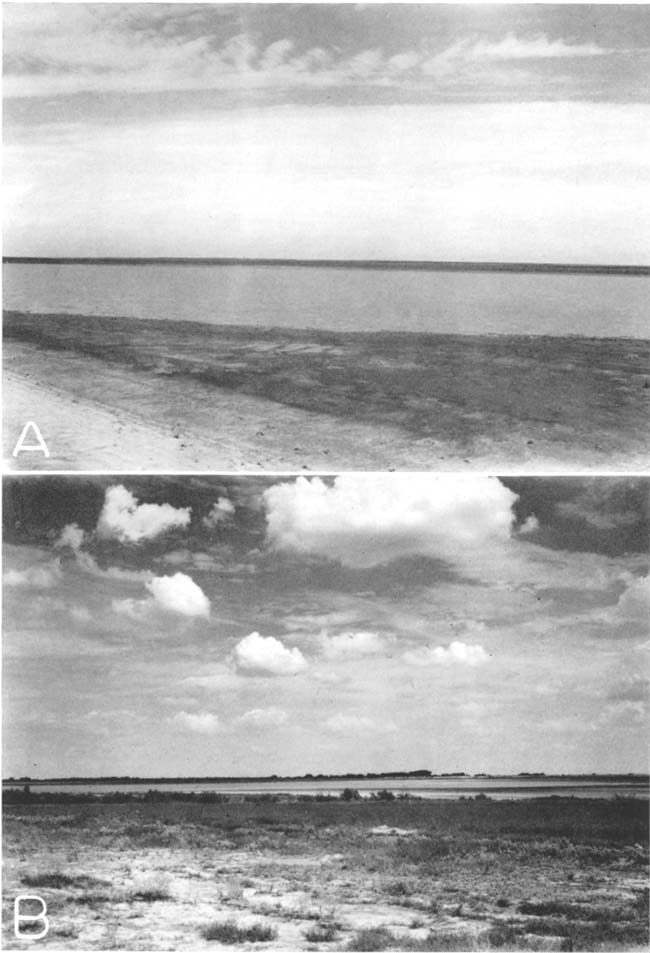
Plate 7--A, Water-filled depression on the Kearny upland in sec. 26, T. 22 S., R. 38 W.; B, Lake McKinney reservoir used for the storage of water for irrigation.
Syracuse upland area--Most of the wells in the Syracuse upland obtain water from sandstones in the Dakota formation; however, a few wells get small supplies of water from the Greenhorn limestone and from the Cheyenne sandstone. Wells that end in the Dakota formation range in depth from about 110 feet to more than 250 feet, and the water levels in these wells range from 100 to nearly 250 feet below land surface. Wells that obtain water from the Greenhorn limestone are less than 100 feet deep. The water in the sink hole south of Coolidge probably is derived from the Lincoln limestone member of the Greenhorn limestone. Wells that enter the Cheyenne sandstone are more than 300 feet deep.
Stanton area--This is an area of intermediate depth to water, the water level in most of the area being between 50 and 150 feet below land surface. In a few wells the water level is as little as 10 feet and in some it is as much as 184 feet below land surface. This area is on the south side of the fault, and the wells obtain most of their water from Tertiary and Quaternary sands and gravels.
Fluctuations of the Water Table
The water table does not remain static but fluctuates much like the water surface of any surface reservoir. Whether the water table rises or declines depends upon the amount of recharge into the ground-water reservoir and the amount of discharge. If the inflow exceeds the draft, the water table will rise; conversely, if the draft exceeds the inflow into the ground-water reservoir the water table will decline. The water table fluctuates more by the addition or depletion of a given quantity of water than does the water surface of a reservoir. If the sand and gravel of a water-bearing formation has an average specific yield of about 25 percent, the addition of 1 foot of water to the sand and gravel will raise the water table in that material about 4 feet. Changes of water levels record the fluctuations of the water table and hence the recharge and discharge of the ground-water reservoir. The safe yield of the ground-water reservoir, therefore, can be estimated by observing the fluctuations of the water levels in wells.
The principal factors that control the rise of the water table (ground-water recharge) in the Hamilton-Kearny area are: (1) the amount of rainfall that penetrates the soil and descends to the zone of saturation, (2) the seepage from streams, depressions and irrigation canals, and (3) the quantity of water added to the ground-water reservoir by underflow from the north and west. The factors that cause a decline in the water table in this area (ground-water discharge.) are: (1) underflow into areas to the east and to the south, (2) evaporation and transpiration, (3) seeps and springs, and (4) pumpage from wells. If the quantity of ground water discharged from a ground-water reservoir during a certain year is greater than the recharge during that year the water table will decline. During a period of dry years the water table may decline, but in a subsequent period of wet years the water table may rise. The decline of the water table during a dry year, therefore, does not necessarily mean that there has been an excessive withdrawal of water from the ground-water reservoir, for during dry years there is less recharge of the ground-water reservoir because of the decreased precipitation. At the same time. the discharge of ground water is increased by greater evaporation and transpiration and by increased pumpage for irrigation. Conversely, during wet years the recharge from precipitation is increased and the loss of water by evaporation, transpiration, and pumpage is reduced.
The fluctuations of the water table in Hamilton and Kearny counties were determined by observing the water levels in wells. In September, 1939, periodic water-level measurements were begun on 39 wells located at strategic points within the area. The depth to water level in each well has been measured once a month in order to determine the fluctuations of the ground-water table. The measurements were made by Richard B. Christy and Woodrow W. Wilson. Since 1934, annual water-level measurements have been made in wells 252 and 278 by the Division of Water Resources of the Kansas State Board of Agriculture.
Water-level measurements made in 1939, 1940, and 1941 have been published in annual water-level reports of the U. S. Geological Survey (Water-Supply Papers 886, 908, and 938), and future measurements will be published in ensuing reports of this series. The well numbers used in this report and in Water-Supply Papers 886, 908, and 938 are given in table 5.Table 5--Observation wells in Hamilton and Kearny counties.
| Hamilton County | Kearny County | ||
|---|---|---|---|
| Well number in this report |
Well number in Water-Supply Papers 886, 908, and 938 |
Well number in this report |
Well number in Water-Supply Papers 886, 908, and 938 |
| 9 | 9 | 167 | 17 |
| 13 | 13 | 177 | 4 |
| 20 | 28 | 183 | 21 |
| 24 | 8 | 189 | 15 |
| 25 | 12 | 196 | 28 |
| 37 | 7 | 202 | 22 |
| 44 | 1 | 205 | 14 |
| 52 | 2 | 209 | 16 |
| 68 | 5 | 219 | 3 |
| 70 | 6 | 232 | 9 |
| so | 3 | 240 | 10 |
| 82 | 4 | 252 | 12 |
| 105 | 20 | 286 | 2 |
| 108 | 22 | 300 | 1 |
| 109 | 17 | 308 | 6 |
| 112 | 16 | 313 | 18 |
| 122 | 27 | 335 | 11 |
| 140 | 19 | 340 | 7 |
| 148 | 11 | 343 | 13 |
| 155 | 24 | 351 | 23 |
| 160 | 23 | 353 | 26 |
The water table in the Hamilton-Kearny area generally reaches its highest stage in the spring and its lowest stage in the fall. When the winters are severe and the ground is frozen, water is unable to reach the zone of saturation and the water table may decline during the winter and early spring. During the summer the great increase in evaporation, transpiration, and pumpage causes the water table to decline. The fluctuations of the water level in 15 wells in Hamilton and Kearny counties are shown in figures 11, 12, 13, and 14.
Figure 11--Hydrograph showing the fluctuations of the water levels in two wells in the Arkansas valley in eastern Kearny County and the cumulative departure from the normal monthly precipitation at Lakin. (Precipitation data in figures 11-14 from U.S. Weather Bureau.) A larger version of this figure is available.
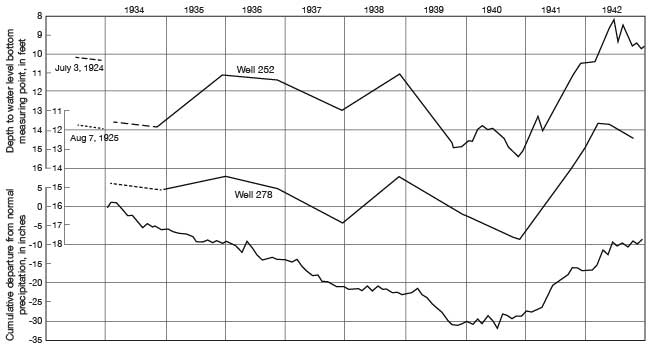
Figure 12--Hydrograph showing the fluctuations of the water levels in six wells in Hamilton County, the departure from normal monthly precipitation at Syracuse, and the cumulative departure from normal monthly precipitation at Syracuse. A larger version of this figure is available.
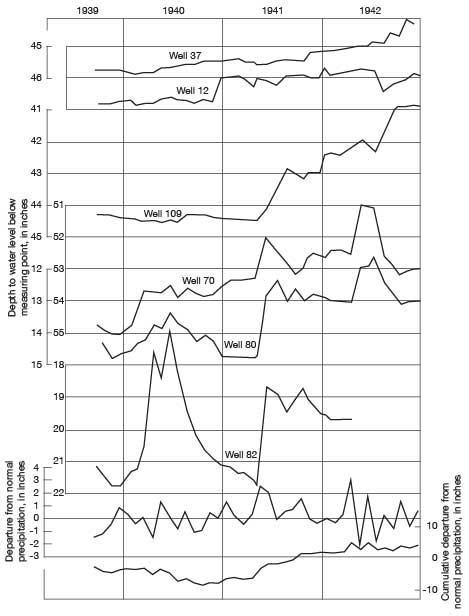
Figure 13--Hydrograph showing the fluctuations of the water levels in four wells in Kearny County, the departure from normal monthly precipitation at Lakin, and the cumulative departure from normal monthly precipitation at Lakin. A larger version of this figure is available.
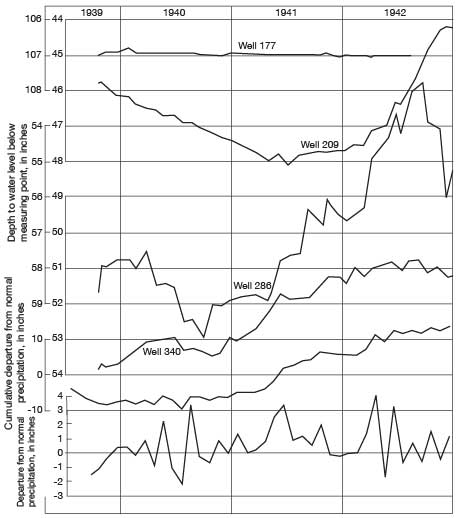
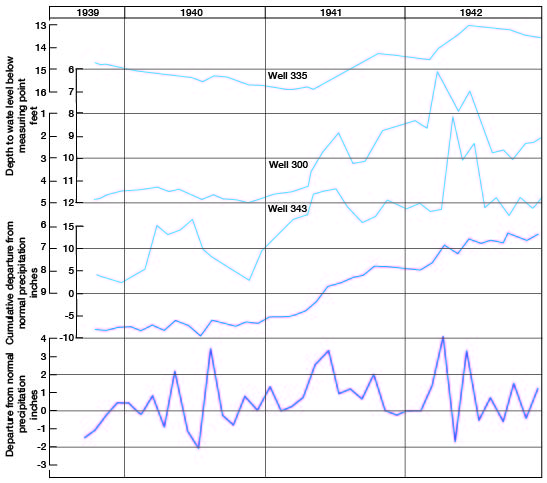
Figure 14--Hydrograph showing the fluctuations of the water levels in three wells in Kearny County, the departure from normal monthly precipitation at Lakin, and the cumulative departure from normal monthly precipitation at Lakin. A larger version of this figure is available.
Fluctuations caused by precipitation--Part of the precipitation in any area may percolate downward through the interstices of the soil and be added to the zone of saturation. The amount and frequency of the recharge depend in part upon the depth to the water table below the land surface and upon the condition of the soil moisture. In areas of relatively shallow water, the recharge generally is greater than in areas where the water table is relatively far below land surface. The fluctuations of the water level in well 177 (water level is about 107 feet below land surface) are slight as compared to those in well 209 in the Kearny County part of the Scott-Finney depression and to those in wells 286 and 340 in the Arkansas river valley (fig. 13). The rise in water levels in the eastern part of the Arkansas valley between 1940 and 1941 (fig. 10) was caused, at least in part, by the above-normal precipitation during that year. The water levels in some deep upland wells may fluctuate greatly, particularly those that obtain water from materials having low specific yield, such as shale. Well 108 in the western part of the Syracuse upland obtains water from such a bed in the Dakota formation. The difference between the highest and lowest recorded water levels in this well is nearly 16 feet.
The condition of the soil moisture has an important influence upon the recharge of the ground-water reservoir, and hence upon the fluctuations of the water levels in wells. After long dry periods the soil moisture may be depleted and therefore must be replenished before any appreciable amount of water can percolate downward to the water table. In areas such as the Kearny and Syracuse uplands, where the belt of soil moisture is relatively thick, several moderate rains may be necessary to replenish the soil moisture. Such rains, therefore, would have little or no effect on the water table. Precipitation that falls in the shallow-water areas, where the soil generally is thinner and more porous, has a greater effect on the fluctuations of the water table. In both deep-water and shallow-water areas, plants use much soil moisture and therefore diminish the effect of the precipitation on the water table.
In Hamilton and Kearny counties, the water levels declined during the years of relatively low precipitation from 1931 to 1939. The decline amounted to several feet in much of the Arkansas valley but was relatively slight in the upland areas. During 1940 and 1941, the precipitation was greatly increased and the pumpage for irrigation decreased accordingly, with the result that the water levels in the Arkansas valley rose to higher levels than any recorded since periodic measurements were begun (figs. 10 and 15). In areas where the water table is relatively far below land surface, the rise in water levels due to increased precipitation was delayed because of the greater time required for the moisture to reach the water table and because of the greater thickness and lower permeability of the soil. The water level in well 209 (fig. 13) declined steadily until the summer of 1941; since that time it has risen steadily.
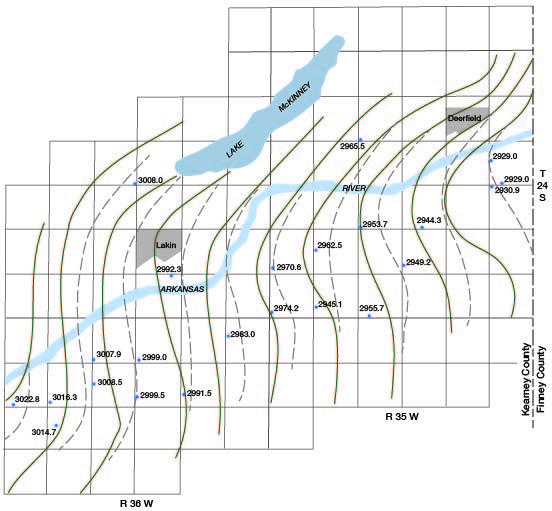
Figure 15--Map of a part of the Arkansas valley showing contours drawn on the water table. Solid lines are contours on the water table in August, 1940; they are based on altitudes shown on plate 1. Dashed lines are contours on the water table in December, 1941, and are based on the altitudes indicated.
Fluctuations caused by transpiration--Ground water may be discharged from the ground-water reservoir by vegetation. The water may be taken into the roots of plants from the capillary fringe, which is supplied with moisture from the zone of saturation, or directly from the zone of saturation. It is then discharged from plants by the process of transpiration. In shallow-water areas, such as the Arkansas valley, many plants extend their roots to the zone of saturation or to the capillary fringe and, therefore, have a direct effect upon the level of the water table. The water table will rise slightly during the night but will decline during the day when the process of transpiration is most active. The plants in upland areas do not extend their roots to the ground-water reservoir, but they may absorb much of the soil moisture which must be replaced before moisture can move downward to the water table. In this manner the plants retard the recharge of the ground-water reservoir and indirectly affect the level of the water table.
Fluctuations caused by pumping--When a well is pumped the water table in the vicinity of the well declines and takes the form of an inverted cone (called the cone of depression). When the pumping ceases, the cone of depression is gradually filled by water withdrawn from adjacent areas. As a result, the regional ground-water level declines somewhat until the surface of the water table again becomes relatively smooth. Most of the wells in the Arkansas valley are pumped intermittently so that cones of depression are being formed in different parts of the valley at different times. Similarly, these cones are being filled in different parts of the valley at different times by inflow from adjacent areas. After the pumping season has ended, the regional water table tends to assume a form similar to the form it had before the pumping began. The level of the water table, however, generally is lower than it would have been had there been no pumping.
The pumping of water for irrigation in the Arkansas valley has an important effect upon the fluctuations of the water table. Generally, the water table declines during the summer even though that is the season of greatest precipitation in this area. This is due to transpiration and to pumping. As illustrated in figure 10, the water table rose in all of the heavily pumped areas in the Arkansas valley in eastern Kearny County between August, 1940, and December, 1941. The greatest rise (about 9 feet) was in the most heavily pumped area south of Deerfield. The water-level measurements of 1940 were made during the pumping season when there were many cones of depression, particularly in the vicinity of the Garden City Company's irrigation project south of Deerfield, where as much as 15,000 gallons of water a minute was withdrawn from the ground-water reservoir. The measurements of 1941 were made in December after pumping for irrigation had ceased and after the water table had risen and become relatively smooth. The sharp upstream flexure of the water table contour lines (pl. 1) in this same area indicate the magnitude of the depression of the water table caused by pumping.
Fluctuations caused by streamflow and by irrigation--When the discharge of Arkansas river increases sufficiently, the surface of the water in the stream rises to a level above the surface of the groundwater reservoir in the area adjacent to the stream. As a result, water from the stream percolates downward and laterally into the underground reservoir until the level of the water table and the level of the water in the stream are about the same altitude. Thus when the stream flow is increased sufficiently, Arkansas river becomes a losing stream (a stream that contributes water to the zone of saturation). Conversely, when the discharge of the river decreases sufficiently, the water surface declines to a point below the level of the water table in adjacent areas and the river becomes a gaining stream (a stream that receives water from the zone of saturation). Arkansas river is unusual in that it may be a gaining stream in one part of the area and at the same time be a losing stream in another part of the area. When ground-water studies were first made in this area by Slichter in 1904 Arkansas river probably alternated frequently from a losing to a gaining stream, but in recent years the increased pumpage for irrigation has caused the river to be a losing stream most of the time in eastern Kearny County. In Hamilton County, however, where irrigation has not been developed so extensively, Arkansas river continues to fluctuate from a losing to a gaining stream. These fluctuations in the stage of the river probably affect the ground-water levels at a considerable distance south of the river where the water table is at essentially the same altitude as the water table near the river. A small rise or fall in the stage of the river, if maintained for a long time, probably would affect the water table in the northern part of the sand-hills area as well as in the valley. The longer the river maintains a high stage the farther southward will the effect upon the water table be noticeable.
The water table may also fluctuate in response to the addition of water from intermittent streams whose beds lie far above the water table at all times. Such streams are losing streams at all times because ground water cannot percolate into them. Bear creek lies above the water table and is an example of this type of stream. Water in Bear creek is prevented by dune sand from reaching Arkansas river, and it must percolate downward or be dissipated by evaporation, or both. As a result, the water table has been built up in the shape of a large mound beneath the stream bed in south central Kearny County. Latta (1941, p. 40) described a similar mound on the water table beneath Bear creek in Stanton County.
The irrigation of land by surface water diverted from Arkansas river and by ground water pumped from wells may also affect the level of the water table. Because of the relatively high porosity of the sandy soil in the Arkansas valley, part of the water that is spread over the land probably percolates relatively rapidly to the zone of saturation. This is especially important in the Arkansas valley in Hamilton County where the soil is very sandy and where the water table is near the ground surface. The ditches that carry this water may also contribute water to the zone of saturation in a manner similar to Bear creek.
Prev Page--Geology || Next Page--Recharge and Discharge
Kansas Geological Survey, Geology
Placed on web Oct. 25, 2007; originally published December 1943.
Comments to webadmin@kgs.ku.edu
The URL for this page is http://www.kgs.ku.edu/General/Geology/Hamilton/05_gw.html