![]()
Prev Page—Geologic History || Next Page—Recharge and Discharge
Ground Water
Occurrence of Ground Water
In order to assist the reader in a better understanding of the groundwater conditions in Barton and Stafford Counties, certain basic principles of the occurrence of ground water adapted from Meinzer (1923) are discussed briefly in the pages that follow. For a more detailed treatment of the subject the reader is referred to Meinzer's report and also to a report by Moore and others (1940).
Ground water, or underground water, is the water that supplies springs and wells. The rocks that form the outer crust of the earth are at very few places solid throughout, but contain numerous open spaces, called voids or interstices. These open spaces are the receptacles that hold the water that is found below the surface of the land and is recovered in part through wells and springs. There are many kinds of rocks, and they differ greatly in the number, size, shape, and arrangement of their interstices and hence in their properties as containers of water. Therefore, the character, distribution, and structure of the rocks of any region, together with the climate and topography, determine the occurrence of water.
The amount of water that can be stored in any rock depends upon the volume of rock occupied by open spaces-that is, the porosity of the rock. Porosity is expressed as the percentage of the total volume of rock that is occupied by interstices. A rock is said to be saturated when all its interstices are filled with water. The porosity of a sedimentary rock is controlled by (1) the shape and arrangement of its constituent particles; (2) the degree of assortment of its particles; (3) the cementation and compaction to which it has been subjected since its deposition; (4) the removal of mineral matter through solution by percolating waters; and (5) the fracturing of the rock resulting in joints and other openings. Well-sorted deposits of unconsolidated silt, sand, or gravel have a high porosity, regardless of the size of the grains. Poorly sorted deposits have a much lower porosity because the small grains fill the voids between the large grains, thus reducing the amount of open space. The pore space in some well-sorted deposits of sand or gravel may gradually be filled with cementing material gradually reducing the porosity.
The capacity of a rock to hold water is determined by its porosity, but its capacity to yield water is determined by its permeability. The permeability of a rock may be defined as its capacity for transmitting water under hydraulic head. It is measured by the rate at which the rock will transmit water through a given cross section under a given difference of head per unit of distance. Rocks that will not transmit water may be said to be impermeable. Some deposits, such as well-sorted silt or clay, may have a high porosity but because of the minute size of the pores will transmit water only very slowly. Other deposits, such as well-sorted gravel containing large openings that communicate freely with one another will transmit water very readily. Part of the water in any deposit is not available to wells because it is held against the force of gravity by molecular attraction—that is, by the cohesion of the water itself and by its adhesion to the walls of the pores. The ratio of the volume of water that a rock will yield by gravity, after being saturated, to its own volume is known as the specific yield of the rock.
Below a certain level, which ranges from the land surface to about 200 feet below the surface in Barton County and from the land surface to about 30 feet in Stafford County, the permeable rocks are saturated with water under hydrostatic pressure. These saturated rocks are said to be in the zone of saturation, and the upper surface of this zone is called the water table. Wells dug or drilled into the zone of saturation will become filled with ground water to the level of the water table.
The amount of water available to wells depends on the saturated thickness of the water-bearing materials and the permeability and specific yield of the material. The amount of water that can be pumped perennially depends also on the periodic groundwater replenishment from precipitation, by percolation from streams, and movement of ground water into the pumped area from the sides.
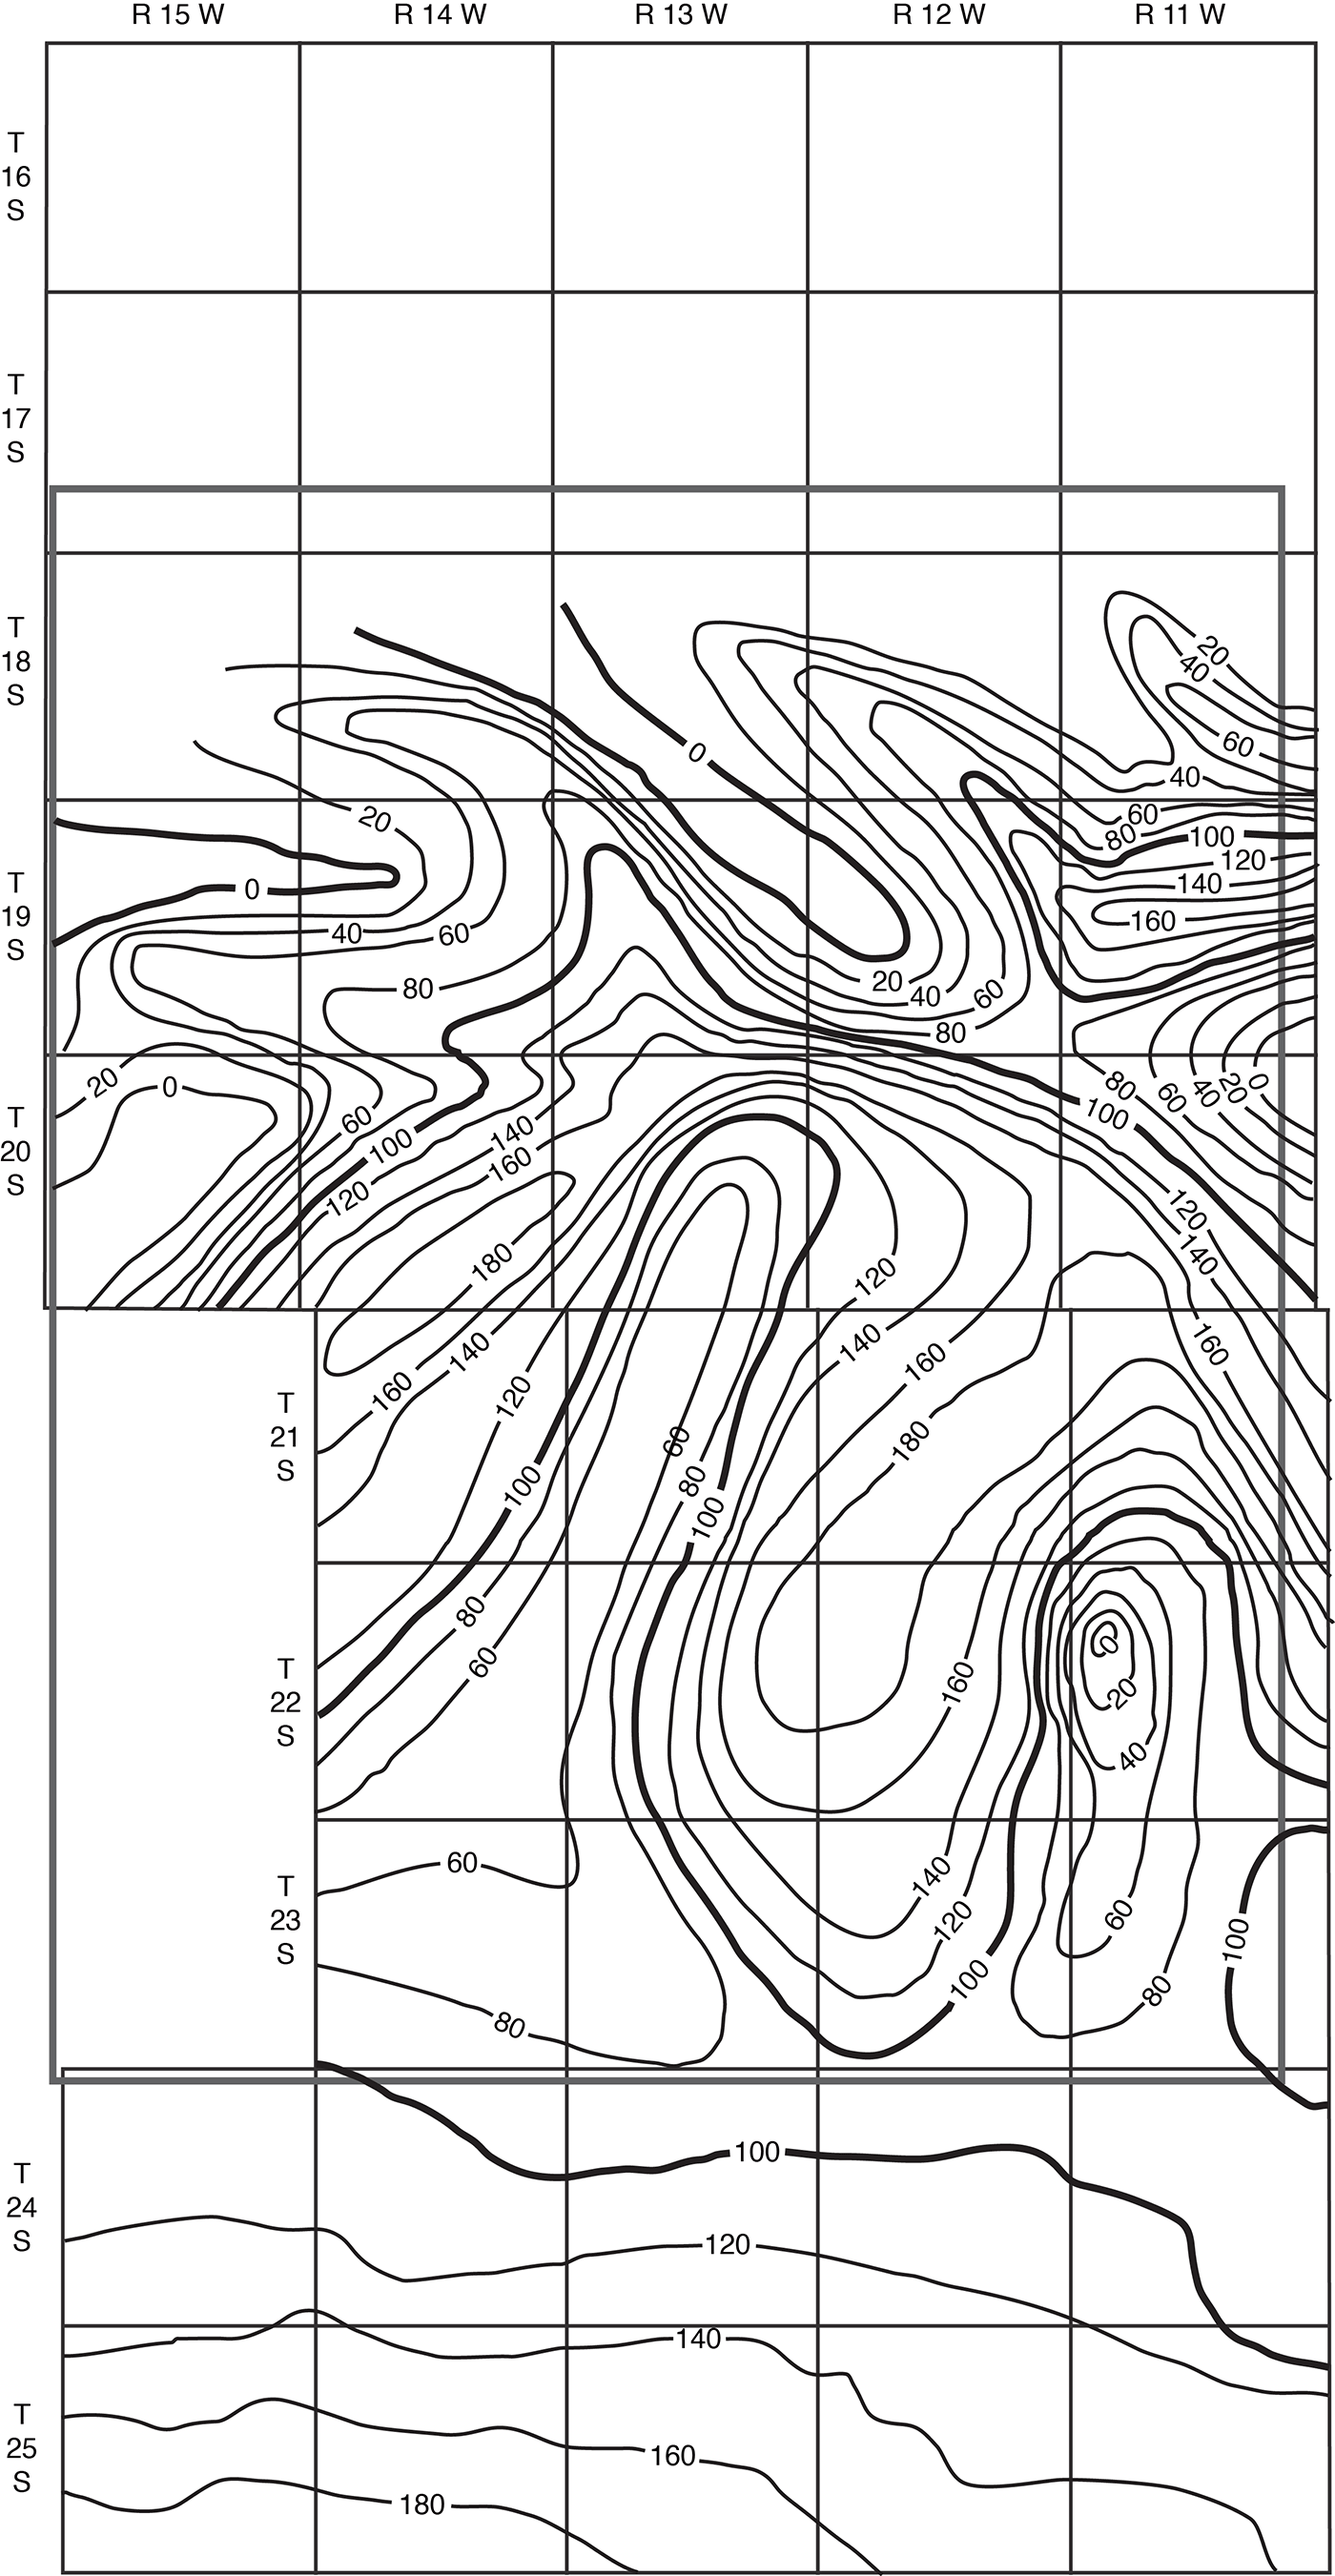
The saturated thickness of the post Cretaceous deposits in Barton and Stafford Counties is shown in Figure 13. The contours showing saturated thickness were prepared by superimposing the water-table contour map (Pl. 1) on the map showing the configuration of the bedrock surface (Fig. 12) and drawing the contours through points of equal thickness. As shown by Figure 13, the water-bearing materials have a thickness of as much as 200 feet in parts of the area. In the area shown outside the zero contour line the water table occurs in the Cretaceous rocks.
Figure 13—Saturated thickness of the post Cretaceous deposits in Barton and Stafford Counties. Prepared by Kenneth L. Walters and Woodrow W. Wilson.
Artesian Conditions
Artesian or confined conditions are said to exist where a waterbearing bed is overlain by an impermeable or relatively impermeable bed that dips from its outcrop to the discharge area. Water enters the water-bearing bed at the outcrop and percolates slowly downward to the water table and then down the dip in the water-bearing bed beneath the overlying confining bed. Down the dip from the outcrop area the water exerts considerable pressure against the confining bed, so that when a well is drilled through the confining bed into the water-bearing bed the pressure is released and the water rises in the well. Because of loss in head resulting from friction as the water percolates down the dip, the water level will not rise to an elevation as high as that of the water table in the outcrop area, and where the land surface is sufficiently low the artesian pressure may be sufficient to raise the water above the surface and flowing wells may be obtained.
The imaginary surface (piezometric surface) defined by the height to which artesian water will rise in wells may be above or below the water table or, especially where the confining bed is of small areal extent, may coincide with the water table. Where there is some degree of interconnection between the artesian aquifer and an overlying unconfined aquifer, the position of the piezometric surface with respect to the water table may be significant in relation to the movement of the water. Where the piezometric surface is higher than the water table, artesian water may be escaping into the unconfined aquifer; where it is lower, the artesian aquifer may be receiving recharge from the unconfined aquifer. Where there is no interconnection between the aquifers, the relative position of the piezometric surface and water table has no particular significance.
Records were obtained of five flowing wells (22-11-9bb, 22-11-10cc, 22-11-35ab, 22-12-12db, and 23-13-3aa) in Stafford County that tap sand and gravel of the Meade formation. All these flowing wells are in topographically low areas and the ground water at each well probably is confined beneath a local lens of relatively impermeable silt or clay. Water encountered in the sand and gravel below the impermeable lenses will rise above the land surface to the level of the water table in the surrounding higher areas; thus, the artesian conditions are strictly local.
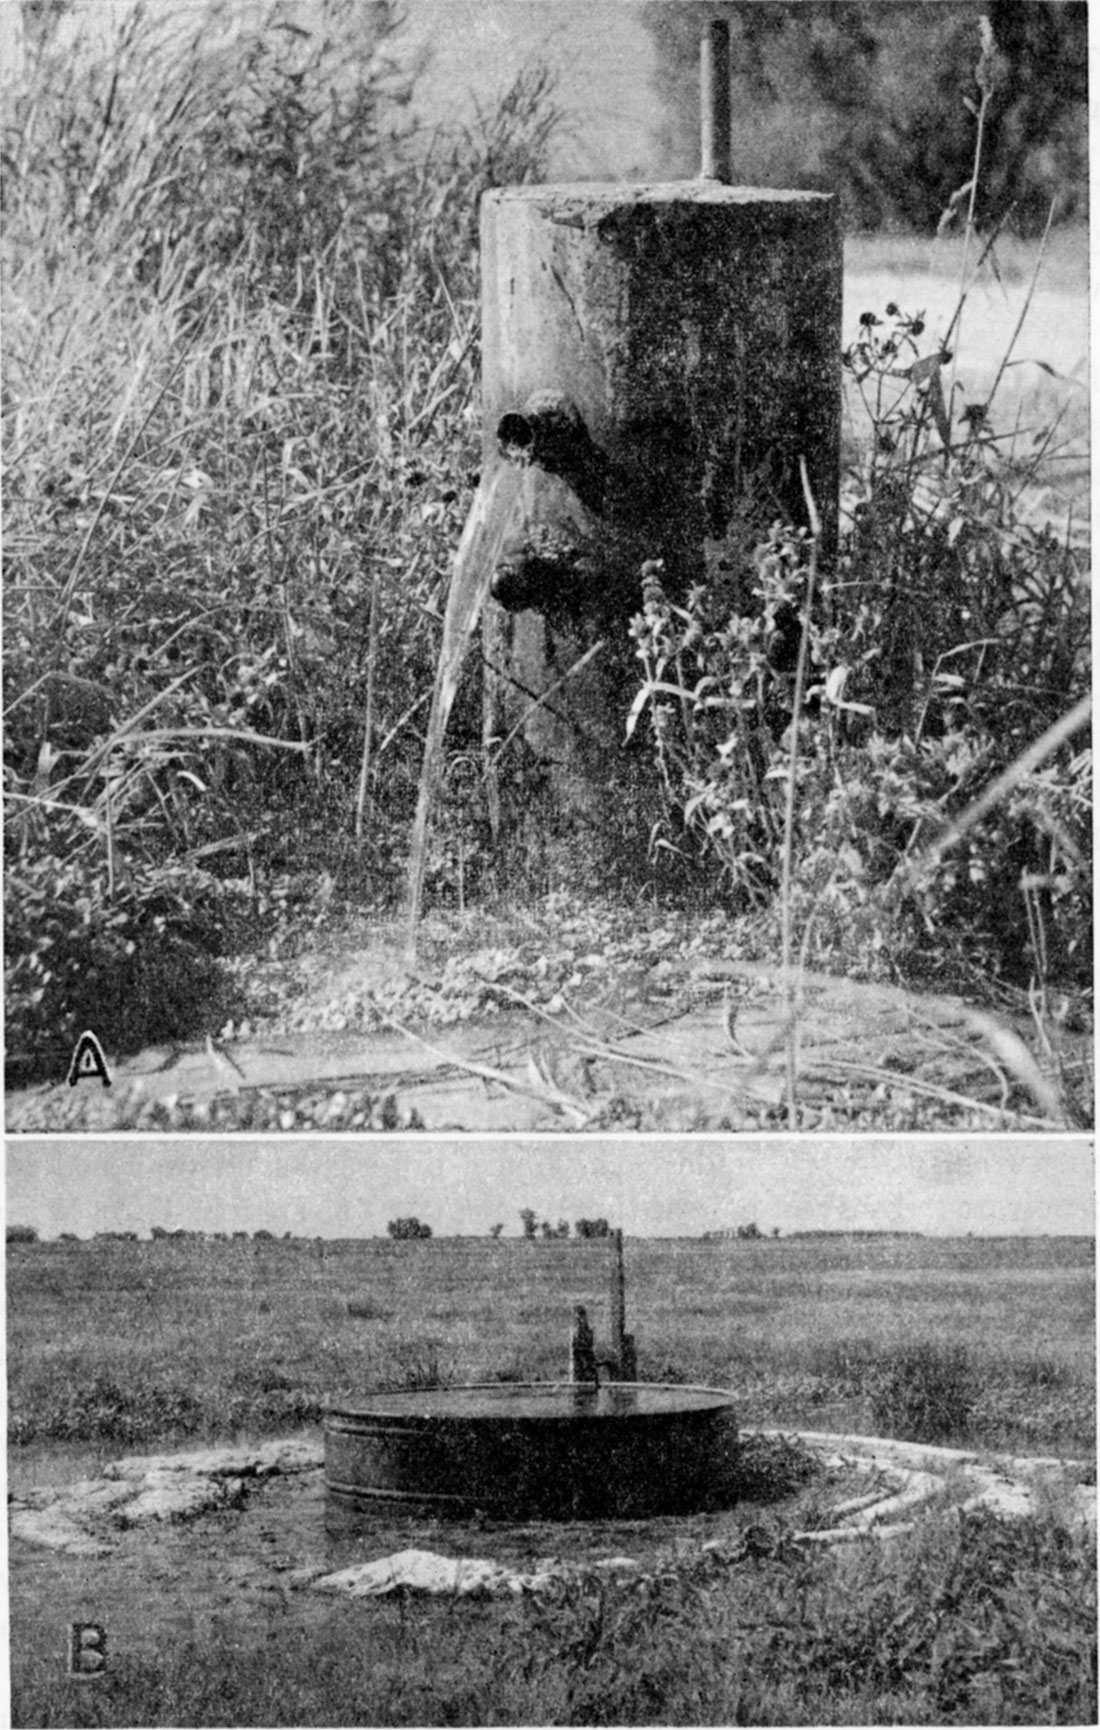
Wells 22-11-9bb, 22-11-10cc, and 22-12-12db on the south side of Big Marsh in northeastern Stafford County (Pl. 2) are 40, 37, and 44 feet deep, respectively. Well 22-11-9bb had a measured flow on October 19, 1942, of 6 gallons a minute and the water rose 4.57 feet above the land surface (Pl. 11A). Well 22-12-12db also had a flow of 6 gallons a minute and the water rose 3.65 feet above the land surface on October 26, 1942 (Pl. 11B). Measurements were not made of the flow and head at well 22-11-10cc.
Plate 11—Flowing wells near Big Marsh in northeastern Stafford County. The measured discharge of each well is 6 gallons a minute. A, Well 22-11-9bb in the NW sec. 9, T. 22 S., R. 11 W. B, Well 22-12-12db in the SE sec. 12, T. 22 S., R. 12 W.
Well 22-11-35ab is on the northwest side of Little Marsh. It is 75 feet deep and on October 26, 1942, had a measured flow of 10 gallons a minute. It was not feasible to measure the head. Well 23-13-3aa is in Rattlesnake Valley in the NE sec. 3, T. 23 S., R. 13 NW. It is 24 feet deep. On October 19, 1942, well 23-13-3aa was flowing at the rate of 6.5 gallons a minute and the water rose 4.7 feet above the land surface.
Wells in Barton County that are drilled into sandstones in the Dakota formation generally encounter confined water under hydrostatic pressure. In most of these wells the water rises considerably above the level at which it is first encountered; however, as far as is known, it does not rise above the general level of the water table anywhere in Barton County. In many places the water level in wells tapping sandstones of the Dakota formation is more than 100 feet lower than the water level in nearby wells that tap younger deposits at shallower depths. For example, on August 8, 1944, the depth to water level in well 16-14-26bb1, a shallow well in the Carlile shale, was 15.4 feet below land surface; whereas in well 16-14-26bb2, less than 50 feet distant and penetrating a sandstone in the Dakota formation, the depth to water level was 140.7 feet below land surface (Table 12). In studying the groundwater conditions in Russell County, which borders Barton County on the north, Frye and Brazil (1943, pp. 53, 56) found that the pressure of water in the Dakota formation varies in the different sandstone beds. This was determined in several test holes in which water-level measurements were made each time a different sandstone bed was penetrated. In a test hole at the SW cor. sec. 31, T. 15 S., R. 14 NW., on the Barton-Russell County line, water-level measurements were made in six distinct sandstones at depths ranging from 200 to 533 feet and the levels of water encountered in the sandstones, in descending order, were as follows: 158.54, 158.78, 168.53, 161.31, 159.28, 164.35, and 28.65 feet (Frye and Brazil, 1943, p. 56). According to Frye and Brazil, in most places in Russell County the water in the deeper sandstone beds is under much greater head than water in the shallower sandstone beds of the Dakota formation; however, they (Frye and Brazil, 1943, p. 56) point out that this situation did not exist in all test holes.
Although data are scanty, it is known that in places the waters in the Kiowa shale, Cheyenne sandstone, and Permian rocks in this area are under artesian head and, locally, the pressure is great enough to cause surface flows. A small flow of water was encountered in the Kiowa shale at a depth of 286 feet in test hole 20-14-5cc at the SW cor. sec. 5, T. 20 S., R. 14 NW., Barton County. The flow was estimated by O.S. Fent to be 0.5 gallon a minute or less. A sample of the water was analyzed and found to contain 28,300 parts per million of chloride (Table 10); therefore, it is too highly mineralized for ordinary uses.
A much greater flow of salt water was encountered in the Cheyenne sandstone in test hole 19-14-17bb at the NW cor. sec. 17, T. 19 S., R. 14 NW., Barton County. A small flow was encountered between depths of 350 and 356 feet. The flow increased somewhat between depths of 360 and 362 feet, and between depths of 416 and 420 feet the flow increased by about four times. O.S. Fent, the driller, estimated the aggregate flow to be 50 gallons a minute or more. A sample of the water contained 33,000 parts per million of chloride (Table 10). An oil-test well drilled about 2 miles southeast of test hole 19-14-17bb in the SE SE sec. 16, T. 19 S., R. 14 NW., also encountered a flow of artesian salt water in the Cheyenne sandstone. According to Mr. Warne Otte of Great Bend, a strong flow of salt water was encountered in this well in a sandstone at a depth of 310 feet. The well was reported to have flowed for about a year before it was properly plugged. That the water was extremely high in salt cannot be doubted, for the area around the well and along the ditch that drained the water away is completely barren of vegetation.
The only information available regarding artesian water in Permian rocks in this area is given in a report by N. H. Darton. He (Darton, 1916, p. 33) states that a well drilled in 1887 about 3 miles north of Great Bend encountered artesian water at a depth of 744 feet under sufficient pressure to cause it to rise to a height of 30 feet above the ground.
The Water Table of Movement of Ground Water
The upper surface of the zone of saturation in ordinary permeable rock has been defined as the water table, except where the upper surface is formed by impermeable material, as it is in parts of Barton and Stafford Counties. The water table is not a static, level surface; generally it is a sloping surface having many irregularities. The causes of the irregularities of the water table in Barton and Stafford Counties are discussed on the following pages.
Shape and slope—The shape and slope of the water table in Barton and Stafford Counties are shown on Plate 1 by means of contour lines. Each point on the water table along a given contour line has the same altitude; hence these water-table contours show the configuration of the water surface just as topographic contours show the configuration of the land surface. Ground water moves in the direction of slope of the water table, at right angles to the water-table contours.
Plate 1 shows that ground water enters Stafford County and southern Barton County from the west and southwest and moves through this area in a general northeasterly direction, but that the direction of movement and slope are not everywhere the same. The average gradient of the water table beneath the Great Bend prairie and the Arkansas Valley area (pp. 43-48) is about 7.5 feet to the mile and ranges from about 2.5 feet to the mile east of Ellinwood to about 30 feet to the mile along the west side of Big Marsh. In the Cow Creek drainage basin (pp. 40-42), the water table slopes from less than 8 feet to the mile to about 75 feet to the mile; whereas beneath Cheyenne Bottoms the slope is everywhere very gentle, being in places only about 2 feet to the mile.
Irregularities in the water table may be the result of various conditions. In places where conditions are exceptionally good for recharge, the water table may be built up to form a mound or low ridge from which the water spreads out, but this spreading takes place very slowly because of the frictional resistance offered by the small interstices through which the water must move. In material of low permeability these mounds or ridges may be very sharp, but in very permeable material the slopes generally are gentle. Depressions in the water table indicate places where ground water is being discharged and may occur along streams that are below the normal level of the water table or in places where water is withdrawn by wells or by vegetation. The permeability of the water-bearing material affects the slope of the water table. If the water is moving through fine-grained sediments the frictional resistance to the movement of the water is great, requiring a steeper slope than when the same quantity of water moves through a more permeable material.
The slight down-slope flexure of the contours between Rattlesnake Creek and the North Fork of Ninnescah Creek indicates that a very broad, low ridge or divide has been formed on the water table in this area. Part of the ground water in this area moves northeastward, thence eastward out of Stafford County. Part moves southeastward toward and is discharged into the North Fork of Ninnescah Creek. A part moves northward and is discharged into Rattlesnake Creek. Similar low divides occur between Rattlesnake Creek and Arkansas River and between Arkansas River and Big Marsh. A more prominent ridge is displayed between Big Marsh and Rattlesnake Creek. The sharp, pronounced down-slope flexure of the contours here indicates that groundwater recharge in this area is unusually high, for there is no evidence that the water-bearing materials are less permeable here than elsewhere.
Rattlesnake Creek and the North Fork of Ninnescah Creek are effluent streams throughout most of their courses in Stafford County; that is, they are perennial streams, the channels of which have been cut down below the water table and are thereby gaining water from the zone of saturation. This movement of water from the underground reservoir to the channels of these streams has caused troughs to be formed on the water table that follow the courses of the North Fork of Ninnescah Creek and Rattlesnake Creek, as indicated by the upstream flexure of the contours. During periods of below-normal rainfall, such as was experienced between 1934 and 1939, when the water table is lower, the upper courses of these two streams in Stafford County are above the water table and, instead of gaining water from the underground reservoir, they lose water to the groundwater reservoir. Under these conditions, a ridge would be formed on the water table beneath the stream channels instead of a trough.
It will be noted on Plate 1 that as the contours cross Arkansas River some of them are flexed slightly upstream whereas others cross without changing direction. This indicates that in places Arkansas River was a gaining stream at the time the water-level measurements were made, but in other places there was an apparent balance between the level of water in the stream and the adjacent water table so that the stream was neither gaining nor losing water.
A depression on the water table has been caused by the discharge of ground water into Big Marsh, the level of which is lower than the surrounding water table. A bedrock ridge trending roughly north-south beneath Big Marsh and the resulting thinning of the pervious water-bearing material is a major factor in causing ground water to be discharged here (Pl. 3, J-J'). The contours show that ground water is moving toward Big Marsh from the northwest, west, and south. On nearing the point of discharge the water table also assumes a much steeper gradient than it has to the west. The shape and slope of the bedrock floor formed by the underlying Cretaceous and Permian rocks may control the slope of the water table in this area to a small extent, but the discharging of ground water into Big Marsh probably is the chief factor causing the steeper slope.
Plate 1 shows that a mound has been developed on the water table beneath the upland area northwest of Pawnee Rock. Water from local rainfall enters the Dakota formation in this area where it is exposed or lies at shallow depth beneath younger unconsolidated deposits of the Sanborn formation. After reaching the underground reservoir, part of the ground water moves south, southeast, and east toward Arkansas Valley and a part moves northeastward into Dry Walnut Valley. The steeper slope of the water table beneath the Pawnee Rock upland area is the result of the low permeability of the fine-grained sandstones in the Dakota formation, through which the ground water moves.
Ground water moves into Dry Walnut Valley from both sides, as shown by the upslope flexure of the contours, and thence down the valley at an average gradient of about 7 feet to the mile. It will be noted that the upstream flexures of the contours in Dry Walnut Valley do not coincide with the stream. This indicates that the channel of Dry Walnut Creek is above the water table and does not receive water from the groundwater reservoir; however, the valley acts as a drain for the adjacent upland areas.
Walnut Creek, on the other hand, is a perennial stream that gains water from the groundwater reservoir. The water-table contours beneath Walnut Valley flex upstream and change direction at the stream channel. Ground water moves toward Walnut Valley from both sides and thence down the valley at an average gradient of about 4 feet to the mile.
The water-table contours beneath the Cow Creek drainage basin are very irregular, owing to the unequal addition of water to the underground reservoir, to the discharge of ground water into Cow Creek and Little Cheyenne Creek, and to differences in the permeability of the water-bearing materials at different places. Recharge is unusually high in the area of sand hills southwest of Claflin. This area is underlain by porous dune sand and a large part of the water that falls as rain seeps rapidly downward to the underground reservoir, where it has built up a prominent ridge on the water table as shown by the long down-slope flexure of the contours. Part of the water beneath this dune area moves eastward toward Cow Creek, a part moves southward toward Little Cheyenne Creek, and a part moves southwestward into Cheyenne Bottoms. The upstream flexure of the contours along Cow Creek and Little Cheyenne Creek indicate that water-table troughs have been formed here because the channels of these two streams in the lower parts of their courses are below the water table. Ground water moves toward and is discharged into these streams from both sides.
A shallow, broad trough has been formed on the water table beneath Cheyenne Bottoms, the shape of which conforms closely with the shape of the underlying Cretaceous bedrock. Ground water moves into the alluvial fill in the Bottoms from all directions except the southeast. It leaves the Bottoms at the southeast side through a narrow, restricted part of the groundwater trough, which coincides with the deep buried channel cut in the bedrock (p. 84). After leaving the Bottoms, the ground water is either discharged into Little Cheyenne Creek or joins the ground water beneath Little Cheyenne Creek.
It will be noted that no contours were drawn in the northern part of Barton County or in parts of central and western Barton County. These areas are underlain by Cretaceous shales, limestones, and sandstones and do not have normal water-table conditions.
Fluctuations—The water table in any area does not remain in a stationary position but fluctuates much like the water in a surface reservoir. Whether the water table rises or declines depends upon the amount of recharge into the groundwater reservoir and the amount of discharge. If the inflow to the underground reservoir exceeds the draft, the water table will rise; conversely, if the draft exceeds the inflow the water table will decline. Thus, the net rate at which the underground reservoir is replenished or depleted controls the rate and magnitude of fluctuation of the water table.
The principal factors controlling the rise of the water table in Barton and Stafford Counties are the amount of precipitation that passes through the soil and descends to the water table, the amount of water added to the groundwater reservoir by seepage from streams, and the amount of water entering the county beneath the surface from areas to the west. Factors controlling the decline of the water table are the amount of water pumped from wells, the amount of water absorbed directly from the water table by plants (transpiration), the amount of water lost from the groundwater reservoir by evaporation, the loss of water from springs, the amount of water discharged by effluent seepage into streams, and the amount of water leaving the county beneath the surface toward the east. The factors causing the water table to rise are discussed in detail under groundwater recharge, and the factors causing the water table to decline are discussed under groundwater discharge.
To determine the character and magnitude of fluctuations of the water table, a group of wells was selected for observation and the water levels in them were measured monthly. Measurements were begun in eight wells in Stafford County and six wells in Barton County during the summer and fall of 1942. Observations were begun in 11 additional wells in Barton County during July 1944. Measurements have been discontinued in four wells in Barton County and three wells in Stafford County. The observation wells were selected by me and periodic measurements were made by W.W. Wilson, A.A. Graffham, K.D. McCall, and Howard Palmer.
The descriptions of the wells and the water-level measurements are given in the annual water-level reports of the Federal Geological Survey (Meinzer and Wenzel, 1944, pp. 71 and 168; 1946, pp. 63 and 152; Sayre and others, 1947, pp. 51 and 126; 1948, pp. 51 and 126). Ensuing annual water-level reports in the same series will give subsequent water-level measurements. Table 7 correlates the observation-well numbers used in this report with those given in Water-Supply Papers 946, 988, 1018, and 1025. The location and description of each well are given in Tables 12 and 13.
Table 7—Observation wells in Barton and Stafford Counties.
| Well number in this report |
Well numbers in Water-Supply Papers 946, 988, 1018, and 1025 |
Date measurements started |
Date measurements stopped |
|---|---|---|---|
| Barton County | |||
| 16-14-34dd | 112 | 13-Jul-1944 | |
| 17-11-10dd | 107 | 8-Jul-1944 | |
| 17-12-24bc | 111 | 12-Jul-1944 | 1-Sep-1945 |
| 17-12-33dd | 103 | 7-Jul-1944 | |
| 17-13-33dc | 104 | 7-Jul-1944 | 1-Feb-1946 |
| 17-14-33aa | 110 | 12-Jul-1944 | |
| 18-11-28dc | 105 | 8-Jul-1944 | |
| 18-15-28cc1 | 109 | 12-Jul-1944 | |
| 19-11-15cd | 35 | 9-Oct-1942 | 19-Feb-1943 |
| 19-13-29cc | 5 | 5-Oct-1942 | 2-Jun-1943 |
| 19-14-16bb | 2 | 7-Aug-1942 | |
| 19-15-17cb | 101 | 7-Jul-1944 | |
| 19-15-22dd | 131 | 22-Jul-1944 | |
| 20-11-3dd | 1 | 7-Aug-1942 | |
| 20-11-20cc | 43 | 12-Oct-1942 | |
| 20-13-12ad | 16 | 7-Oct-1942 | |
| 20-15-11ab | 100 | 14-Aug-1944 | |
| Stafford County | |||
| 21-13-27dd | 19 | 1-Aug-1942 | |
| 22-12-3cc | 26 | 3-Aug-1942 | |
| 23-12-12cc | 3 | 29-Jul-1942 | |
| 23-14-27dd | 38 | 6-Aug-1942 | 28-Apr-1943 |
| 24-11-16aa | 63 | 26-Aug-1942 | 1-Dec-1945 |
| 24-13-28aa | 29 | 4-Aug-1942 | |
| 24-15-3cd | 40 | 8-Aug-1942 | 24-Mar-1943 |
| 25-13-12ab | 25 | 1-Aug-1942 | |
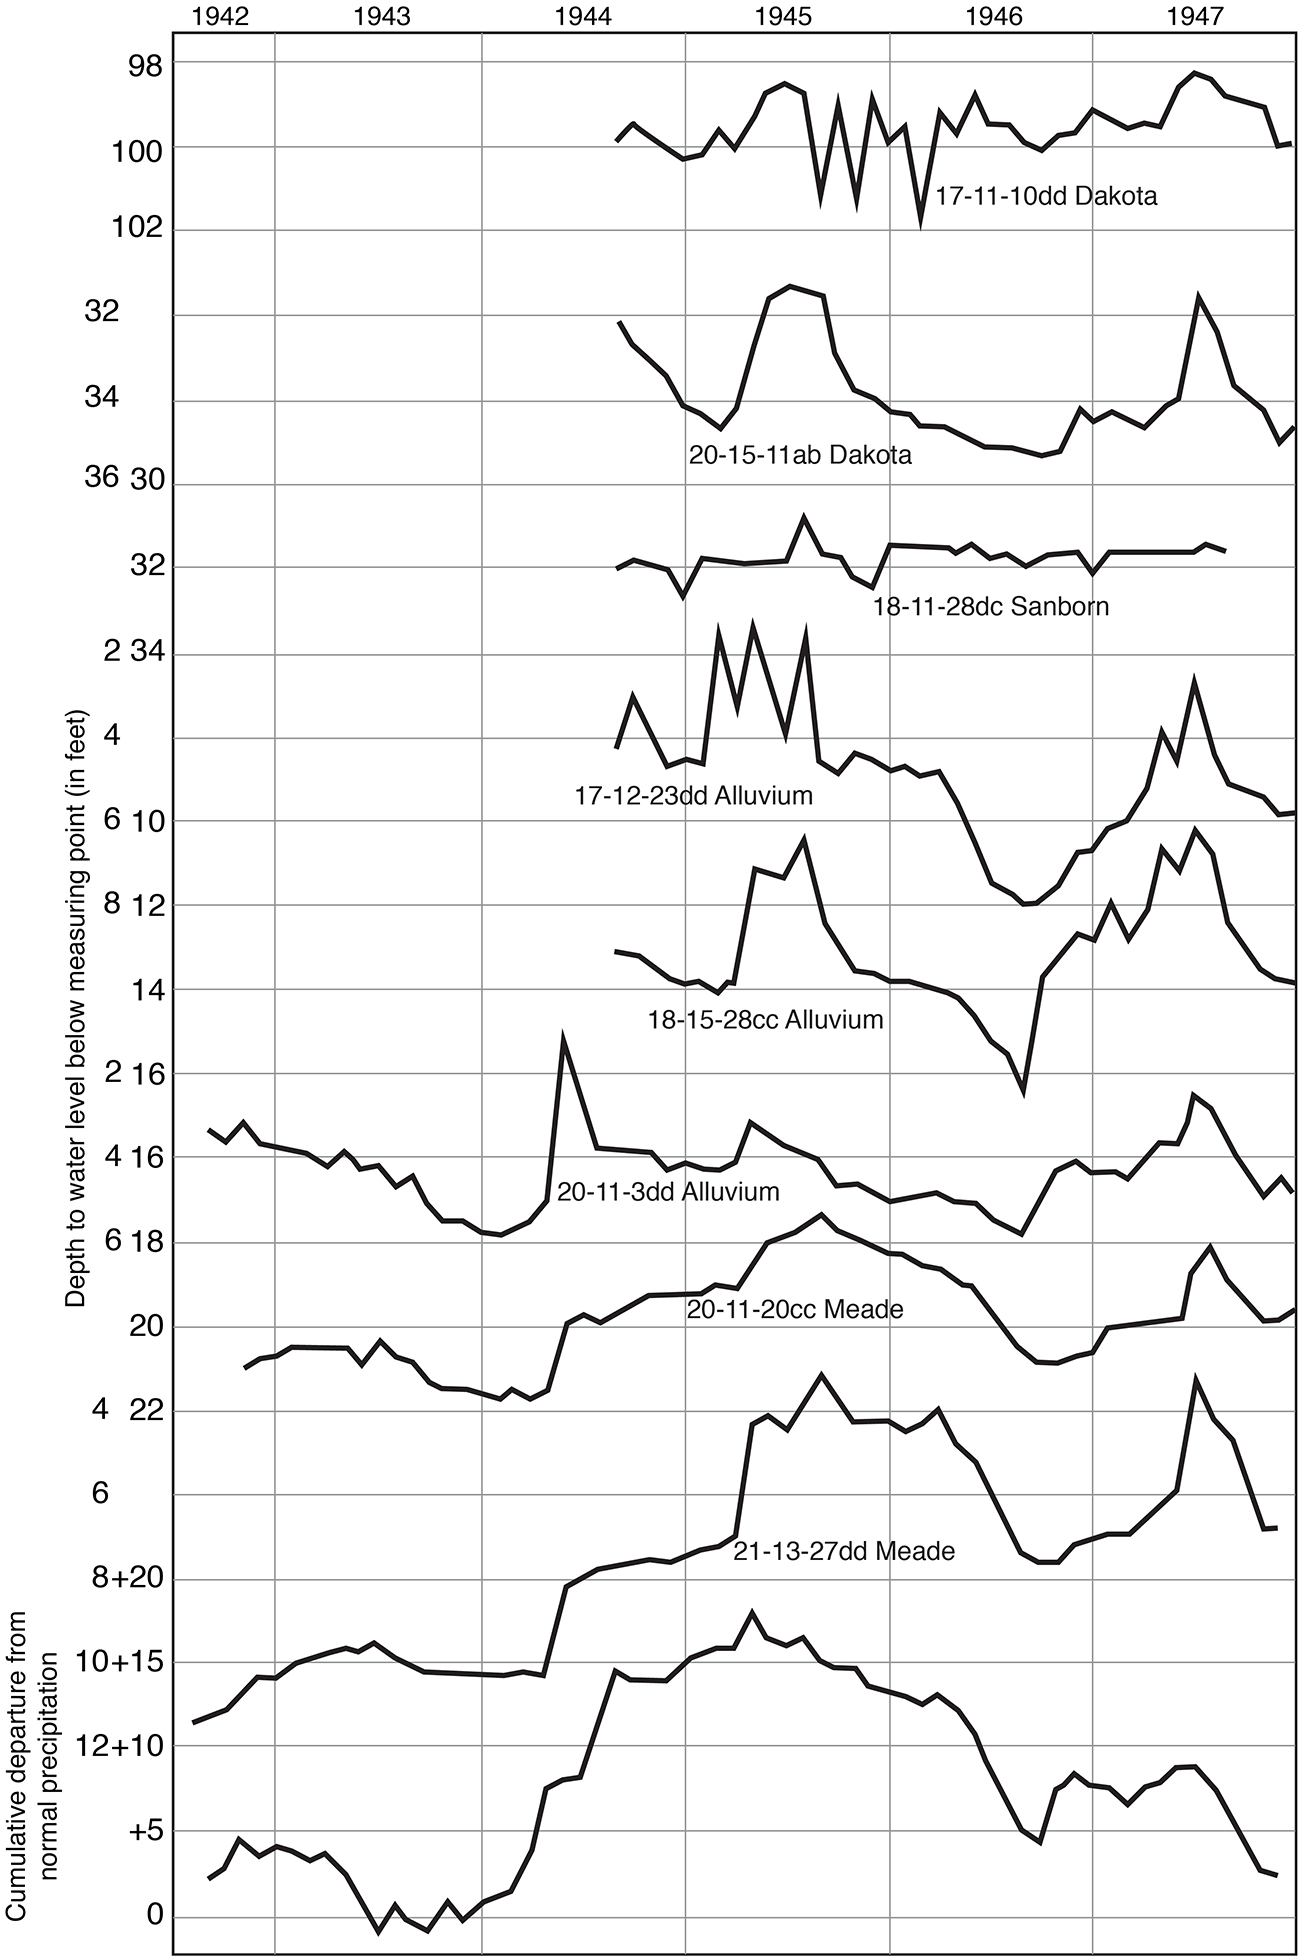
Fluctuations in the water levels in seven typical observation wells in Barton County and one in Stafford County are shown by hydrographs in Figure 14, together with cumulative departure from normal precipitation at Great Bend.
Figure 14—Hydrographs of eight typical observation wells in Barton and Stafford Counties and the cumulative departure from normal precipitation at Great Bend.
Prev Page—Geologic History || Next Page—Recharge and Discharge
Kansas Geological Survey, Barton and Stafford Geohydrology
Web version Dec. 2001. Original publication date Dec. 1950.
Comments to webadmin@kgs.ku.edu
The URL for this page is http://www.kgs.ku.edu/General/Geology/Barton/07_gw.html