Kansas Geological Survey, Subsurface Geology 6, p. 120-132
by
Martin K. Dubois
Consulting Geologist
An Acrobat PDF file containing the complete paper is available (1.1 MB).
Cores from the Lansing-Kansas City "E" Zone are particularly useful in the development and application of exploration strategy in areas without core control by aiding in the recognition and correlation of key units in the "E" Zone on available mechanical well logs. A core on the "E" Zone from the Theodore Gore Company # 1 Williamson "B" well illustrates the complexity of one particular Upper Pennsylvanian sedimentary cycle. At least one and possibly two minor transgressions interrupted the overall regressive portion of the sequence of the "E"-Zone cycle. Oil is produced from carbonate packstones and grainstones that were deposited during two episodes of shoaling within a complex marine- nonmarine sedimentary cycle. Packstones and grainstones are best developed on ancient positive areas of the seafloor, areas where nonmarine sediments overlying these regressive carbonates are thin. After documentation of this relationship, the thickness of nonmarine rock can be mapped in areas without core control by using mechanical well logs. Isopach maps of the nonmarine sediments identify areas with potential for "E"-Zone production.
A core of the Lansing-Kansas City "E" Zone from the Theodore Gore Company # 1 Williamson "B" well, Meeker Canal field, Hitchcock County, Nebraska, was originally studied by the author in Dubois (1979), an unpublished master's thesis. Many of the figures and ideas in this paper are from the earlier work.
Hitchcock County is located along the Nebraska-Kansas state line in southwest Nebraska near the junction of two major, yet low-relief, structural features, the Las Animas arch and the Cambridge arch. Most of the uplift along the Cambridge arch, a northwest to southeast feature that plunges to the southeast, occurred after Mississippian time but prior to deposition of Pennsylvanian sediment (Lee and Merriam, 1954). The Las Animas arch, a southwest to northeast trending structure that currently plunges to the northeast, is a more subtle feature, yet its geologic history is complex. Rascoe (1978) showed that during the late Paleozoic (post-Mississippian) the Las Animas arch plunged to the southwest away from the Cambridge arch, whereas arching in the southwestern portion of the Las Animas during the Mesozoic and Cenozoic resulted in the present-day configuration with the Las Animas arch plunging to the northeast towards the Cambridge arch. The ancestral Las Animas arch may have influenced regional sedimentation in the study area during Upper Pennsylvanian Lansing-Kansas City time.
Figure 1--Index map showing location of Hitchcock County, Nebraska, in relation to major tectonic features (after Dubois, 1979).
Lansing and Kansas City sediments were deposited on the northern, shoreward portion of an extensive, low-relief, gently southward-dipping platform. The platform's margin was near the Kansas-Oklahoma border (Rascoe, 1962) and the platform had paleoslopes as little as 0.1 m/km (0.5 ft/mi) in Hitchcock County (Watney and Ebanks, 1978). The paleogeographic position of Hitchcock County corresponds to Heckel's (1977) northern shoreward-facies belt. During deposition of the Lansing-Kansas City "E" Zone, Hitchcock County probably had a relatively flat to mildly undulating surface with maximum relief on the order of 30-60 ft (9-18 m). Local positive features having a relief of 15-30 ft (4.5-9 m) dotted the landscape (Dubois, 1979). The best "E"-Zone porosity is found on these local positive features.
Lansing and Kansas City Groups are of the Missourian Stage of the Upper Pennsylvanian System (fig. 2). Several schemes of informal classification have been applied to the limestones of the Lansing and Kansas City Groups, herein called Lansing-Kansas City, in Nebraska and Kansas. Letter classification systems are used by most oil operators because they are more convenient than the formal rock formation and member names that have been assigned to these rocks where they crop out in eastern Kansas. Six letters (A-F) were assigned by Kincaid, Trimble, and Larson (in Parker, 1961) to the six uppermost limestone units of the Lansing-Kansas City (fig. 3). I have added a seventh letter, G, for the unassigned interval just above the base of the Kansas City. The six- or seven-letter classification system is used by most oil operators in southwestern Nebraska, and the seven-letter classification system will be used here.
Figure 2--Stratigraphic section in Hitchcock County, Nebraska, correlated with the Rawlins County Type Log (Kansas Geological Society, 1966; after Dubois, 1979).
Figure 3--Stratigraphic classification schemes for the Lansing-Kansas City Groups. Informal classification systems: 1) letter designations commonly used in southwest Nebraska, modified after Kincaid, Trimble, and Larson (in J. M. Parker, ed., 1961); 2) Morgan's (1952) classification system, based on correlations with Watney's (1977) work in northwest Kansas; 3) system based upon depths below the top of the Lansing, used by some operators in central Kansas (W. L. Watney and M. J. Brady, personal communication, 1979). The formal stratigraphic classification is based on Parkhurst's (1961) work. He traced the Lansing-Kansas City into the subsurface from the outcrop and correlated the formation and members with Morgan's (1952) letter designations. The thicker carbonate of the "E" zone is also Morgan's "J" zone, the " 180 foot" zone, and the Winterset Limestone (after Dubois, 1979).
Nearly all the oil produced in Hitchcock County comes from the Lansing-Kansas City. Production in a field may be from any one of seven zones, and most produce oil from two or more zones. The Meeker Canal field produces from the "E" and "F" Zones and to a lesser extent from the "D" Zone. The "D" and "E" Zones remain behind pipe in many wells and will be perforated as the "F" Zone is depleted (Rakaskas, 1982). Ultimate recovery by both primary and secondary methods will average 40-50 thousand bbls of oil per well when developed on 40-acre tracts (J. E. Rakaskas, personal communication, 1979).
Production from the # 1 Williamson "B" well, NW SW sec. 5, T. 2 N., R. 32 W., completed in 1977, is a typical well in the 50-well Meeker Canal field (fig. 4). On a drill-stem test from 3,758 to 3,812 ft, covering the "E" Zone, 280 ft of gas and 270 ft of mud-cut oil were recovered. Shut-in pressures were 989-969 lbs and flow pressures were 40-142 lbs. This zone was perforated from 3,7793,796 ft overall and treated with 3,750 gal of acid. Initial production was 55 bbls of oil and 2 bbls of water per day. Shows in the "D" and "F" Zones were noncommercial due to lack of porosity. Two other wells on the Williamson "B" lease were later drilled. The # 2 well located in the NE SW sec. 5, T. 2 N., R. 32 W., was completed in the "E" Zone in 1979 for 50 bbls of oil and 1 bbl of water per day. The # 3 well, located in the SW SW sec. 5, T. 2 N., R. 32 W., was completed in 1980 for 25 bbls of oil and 8 bbls of water per day from the "F" Zone. By the end of 1982, the three wells had produced 59,955 bbls of oil from the original zones (Rakaskas, personal communication, 1983). The # 1 Williamson "B" well has produced a total of approximately 38,000 bbls and is still making 11 bbls of oil per day and a trace of water after 6 yrs of production (Rakaskas, personal communication, 1983). Production for the Meeker Canal field was 650,276 bbls of oil at the close of 1982.
Figure 4--Lansing structure maps. Tops from approximately 475 wells were used in preparation of the map on the left; the small scale map on the left is after Dubois (1979), and the larger scale map on the right is modified after Rakaskas (1982).
A vast amount of literature deals with Pennsylvanian cyclothems of the Midcontinent. Early workers recognized the transgressive-regressive nature of Pennsylvanian rock sequences (Moore, 1936; Elias, 1937; Weller, 1958). Later work on the Lansing-Kansas City along the outcrop belt in eastern Kansas by Harbaugh (1959), Harbaugh and others (1965), Crowley (1969), Frost (1975), and Heckel (1975a, b, 1977) supported and refined the basic cyclothem theory applied to these rocks by Moore (1936). Watney (1977, 1980) and Watney and Ebanks (1978) applied the principles of cyclothemic theory in their work on the subsurface Lansing-Kansas City rocks in northwestern Kansas and southwestern Nebraska.
The "E" Zone in Hitchcock County is not a simple transgressive-regressive cycle typically recognized in Lansing-Kansas City rocks. At least one and possibly two minor transgressions interrupted the overall regressive sequence (fig. 5). Two pay zones are in the "E" Zone, rock units 3 and 6 in figs. 5, 6, 7, and 8. Both are shallow-water, relatively high-energy packstones and grainstones separated by approximately 10 ft (3 m) of deeper-water, low-energy rocks.
Figure 5--"E" zone cycle of the Meeker Canal field (after Dubois, 1979).
Figure 6--Core description of #1 Williamson "B" well, Hitchcock County, Nebraska. Dunham's (1962) textural classification of carbonate rocks was used.
Figure 7--Gamma ray-neutron log from the Theodore Gore #1 Williamson "B" well, Hitchcock County, Nebraska.
Figure 8--West to east stratigraphic cross section of the "E" zone cycle, Hitchcock County, Nebraska, modified after Dubois (1979).
To facilitate discussion of the "E"-Zone sedimentary cycle, numbers were assigned to specific rock units (lithofacies) that were correlatable both in cores and on mechanical well logs. Rock units 9, 10, and 11 were not cored in the # 1 Williamson "B" well but were observed in other cores in Hitchcock County and are included in the discussion below. The following is a summary of depositional events and resultant rock types of the "E"-Zone cycle.
1. A relatively rapid marine transgression initiated the "E"-Zone cycle and resulted in deposition of a thin transgressive limestone (unit 11), barely detectable on the # 1 Williamson "B" electric log. The limestone is very similar to unit 1, the "D"-Zone transgressive limestone, with the dominant grain types being foram-algal (Osagia)-coated grains, and caliche lithoclasts. Terrigenous clastic influx initiated during further transgression resulted in the accumulation of a maroon-gray to maroon-brown shale with locally abundant bryozoan, crinoids, and brachiopods (unit 10). Unit 10 is stratigraphically equivalent to Heckel's (1977) black, phosphatic core shales of eastern Kansas also recognized further south covering much of western Kansas. This black-shale facies can be recognized on well logs by its characteristic high natural gamma-ray radiation as recorded by the gamma-ray log.
2. A minor regression interrupted the transgression and resulted in deposition of unit 9, consisting of mixed skeletal wackestones and packstones abruptly overlying a mudstone. The unit has considerable lateral variations (phylloid-algal wackestone facies and more grain-supported rocks) northeast of the Meeker Canal field where shallower water most likely existed.
3. Terrigenous clastic influx followed another relatively rapid transgression and the dark shale of unit 8 was deposited. This predominantly dark gray-maroon silty shale has a sparse, but normal, marine faunal assemblage and contains carbonate-enriched nodules and burrows. The carbonate content increases upwards giving the first hints of a relatively slow regression.
4. The slow regression was accompanied by diminished terrigenous clastic influx, clearing of the water, and carbonate-mud production resulting in deposition of a marlstone (unit 7). The marlstone (or shaly and silty carbonate mudstone) consists of a mixture of carbonate mud and terrigenous silt and clay. The silt and clay are concentrated in discrete laminae as well as disseminated throughout the matrix. The carbonate mud is concentrated in nodule-like masses (5-20 cm) or in carbonate-enriched horizontal burrows 1-2 cm in diameter (fig. 9A). Intervals rich in carbonate mud are typically light gray while silt- and clay-rich laminae are light green to maroonish gray.
Figure 9A--Core slab of marlstone (unit 7) at 3,802 ft in the #1 Williamson "B" well. Light areas are carbonate mud-enriched horizontal burrows. Dark areas are gray silty shale laminae (scale is 2 cm).

5. Further regression and cessation of terrigenous influx resulted in more prolific production of carbonate grains in a shallow, moderately agitated environment producing the packstones and grainstones of unit 6 (fig. 9B, C). Two distinct rock types with a gradational boundary make up this interval. The lower one is a coarse-grained bivalve packstone and grainstone, nearly identical to that in the lower part of unit 3, having a slightly restricted faunal assemblage. The upper part of unit 6 is a mixed-skeletal wackestone with a normal marine faunal assemblage similar to that of unit 5. This is the first evidence of another minor transgression. The base of unit 6 is generally an abrupt, scoured, erosional surface.
Figure 9B--Thin section photomicrograph of a bivalve grainstone (base of unit 6) at 3,800 ft in the #1 Williamson "B" well. Rounded grains are predominately bivalves. Most porosity is moldic (arrow at 1). Clear quartz druze cement (arrow at 2) fills much of the porosity; scale is 1 mm, cross-polarized light.
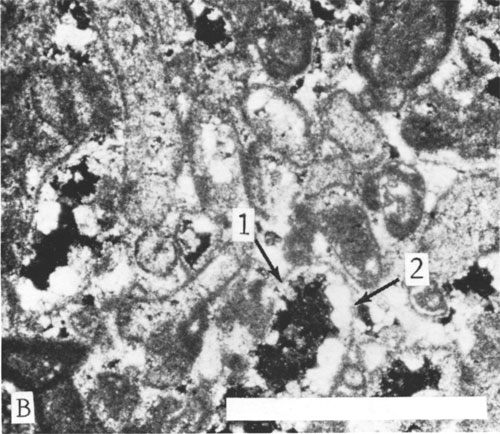
Figure 9C--Oil-stained core slab of a bivalve-mixed skeletal packstone (middle of unit 6) at 3,800 ft in the #1 Williamson "B" well. Lighter areas are cemented with calcite or quartz druze. A red chert nodule that has replaced both grains and matrix is outlined. Examples of bivalve molds, the dominate porosity type, are indicated with arrows (scale is 2 cm).
The neutron-porosity log in the # 1 Williamson "B" well reads only 5-8% and the unit was not perforated. Much of the porosity was occluded by red chert, silica, and calcite cement. The chert apparently is "hot," is associated with abnormally high gamma radiation, and has a distinct signature on the gamma-ray log (fig. 7). This will be discussed later in the text. In parts of the Meeker Canal field, unit 6 is an excellent reservoir with average porosity of 10-15%, but single values are as great as 25%. As is the case in the # 1 Williamson "B" well, porosity is secondary, predominately moldic, and resulted from dissolution of bivalve-shell fragments.
6. The "deeper" water wackestones at the top of unit 6 and the silty shale of unit 5 are evidence of another minor, yet relatively rapid, transgression. The greatest faunal diversity in the entire "E"-Zone cycle is found in this shale interval and includes ramose bryozoan, several genera of brachiopods, fusulinids, crinoids, ostracodes, and bivalves.
7. The marlstone of unit 4 (fig. 10A) signifies another relatively slow regression. It is remarkably similar to unit 7 and undoubtedly deposited in a very similar environment. Differences are primarily diagenetic. Portions of carbonate mud have been replaced with orange or red silica and narrow (cm), near-vertical, solution fissures have been filled mostly with nonmarine red-brown silt and clay from unit 2 throughout unit 4 in the # 1 Williamson "B" core.
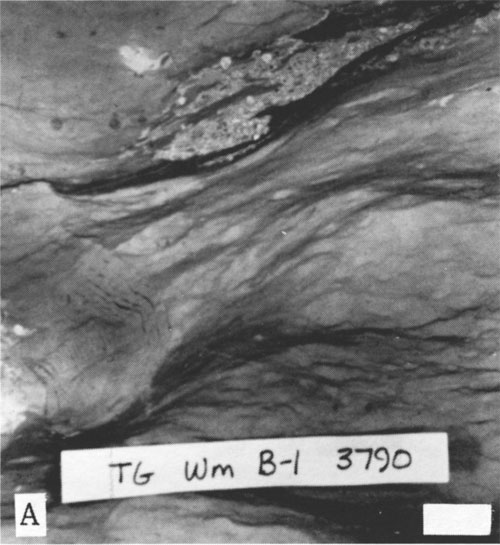
Figure 10A--Core slab of marlstone (unit 4) at 3,790 ft in the #1 Williamson "B" well. Lighter areas are carbonate mud rich and darker areas are green silty shale laminae. The marlstone is very similar to that of unit 7 in figure 9A (scale is 1 cm).
8. As regression continued and terrigenous influx ceased, more prolific carbonate-grain production in a shallow moderately agitated environment resulted in the deposition of packstones and grainstones of unit 3 (fig. 10B, C). In the # 1 Williamson "B" well, two distinct facies are separated by a gradational boundary. At the base is a coarse-grained bivalve grainstone with moldic and vuggy porosity, while the upper part is a fine-grained pellet packstone with predominately secondary intergranular porosity and a more restricted faunal assemblage. Continued regression resulted in subaerial exposure of the "E"Zone carbonate. The top 0.4 ft of this unit is a shaly pelletal-skeletal wackestone and silty shale. The limestone is weathered and contains abundant pyrite. Most of the silt and shale in this interval is derived from the overlying nonmarine silty shale.
Figure 10B--Uniformly oil-stained core slab of a fine-grained pellet grainstone-packstone (unit 3) at 3,784 ft in the #1 Williamson "B" well. Light areas are tightly cemented with calcite. The circular feature is an orthocone cephalopod, one of the rare macrofossils in unit 3 (scale is 1 cm).
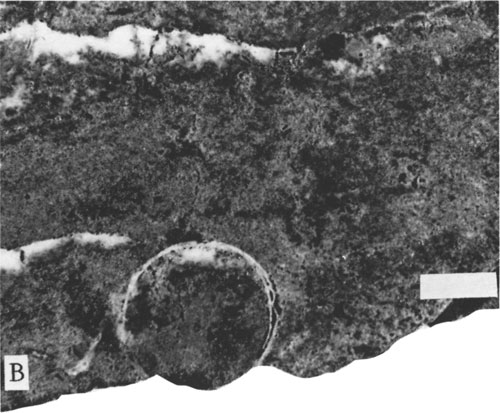
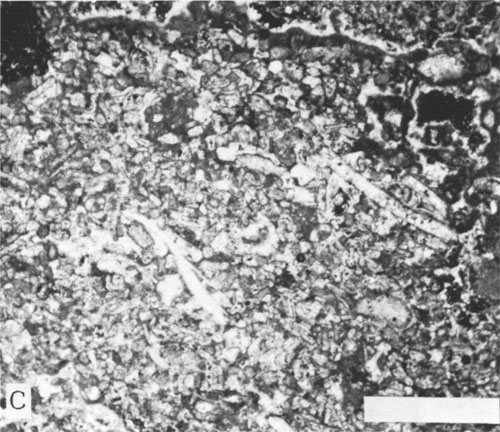
Figure 10C--Photomicrograph of one of the tightly cemented portions of fig. 10B. Most smaller grains are pellets and most larger grains are bivalve fragments (scale is 1 mm, cross-polarized light).
9. During subaerial exposure, porosity in units 3 and 6 was enhanced by freshwater leaching while eolian-derived red silt and clay of unit 2 (fig. 11A) blanketed the region. This silt and clay was redistributed by sheetwash, more wind, and intermittent streams into topographic lows resulting in a much thicker accumulation of nonmarine sediment in the paleolows than on the paleohighs (Dubois, 1979, 1980). Caliche in unit 2 in the cores from the # 1 Williamson "B" well and cores from nearby wells and calcite-filled pedotubules observed in other cores from unit 2 is evidence of soil development in the nonmarine sediment. The caliche occurs as small isolated nodules or may replace nearly 100% of the matrix. This occurrence fits the description of a K-soil horizon, typical of semiarid environments described by Gile and others (1965), where the soil has been indurated with calcite (caliche).
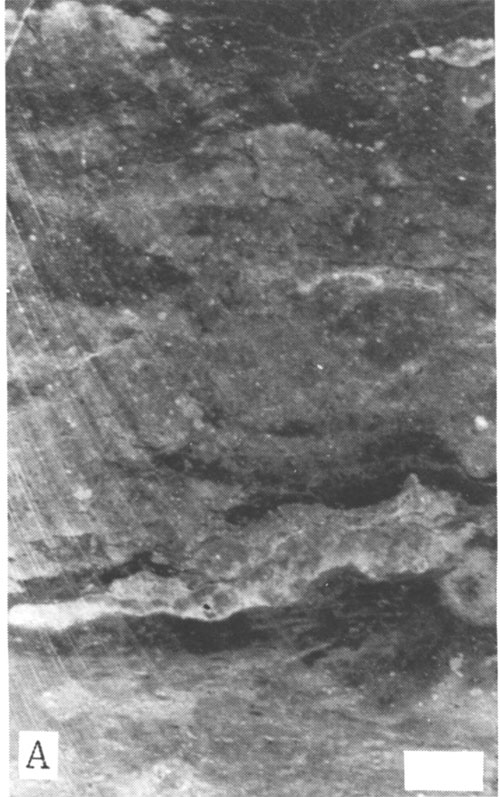
Figure 11A--Core slab of red-brown nonmarine silty shale (unit 2) at 3,782.5 ft in the #1 Williamson "B" well. Much of the matrix has been replaced with caliche. Darkest areas contain the least caliche (scale is 1 cm).
10. Nonmarine conditions ended abruptly with a rapid marine transgression and deposition of unit 1, the transgressive limestone of the "D" Zone (fig. 11B, C). The unit is predominantly a coarse-grained grainstone with most grains being coated grains and caliche interclasts. Grain coatings are an encrusting-foram, blue-green algal consortium (Osagia). At the base is a burrowed green siltstone that was probably deposited in an intertidal environment. A fusulinid wackestone found at the top of unit 1 was most likely deposited in deeper water than the rest of unit 1. Continued transgression resulted in a reduction of carbonate-grain production and an influx of terrigenous clay and silt that comprises the marine shale (fig. 11D) that overlies unit 1.
Figure 11B--Oil-stained core slab of encrusting foram-algal coated-grain grainstone (unit 1) at 3,778 ft in the #1 Williamson well. A large caliche lithoclast (arrow) was derived from the underlying paleosol (scale is 1 cm).
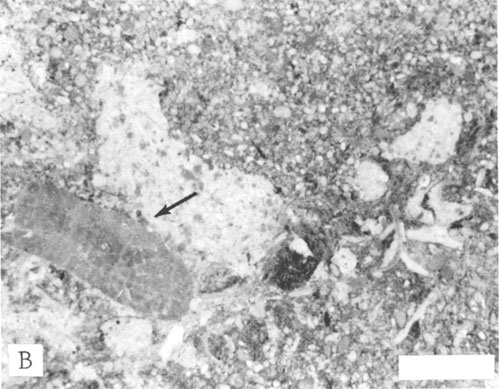
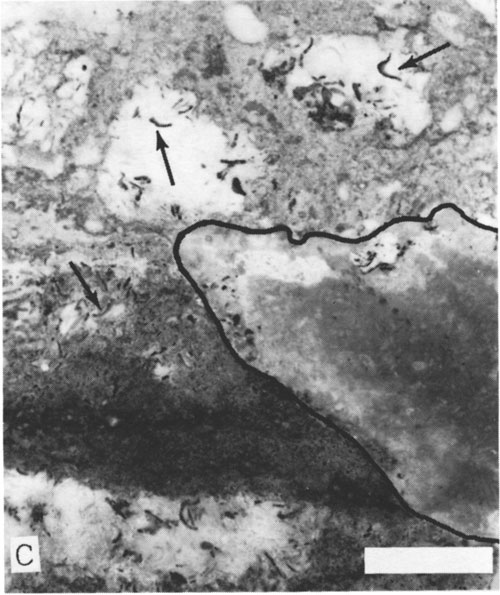
Figure 11C--Photomicrograph of fig. 11B. Tubular-encrusting forams and algae, possibly the blue-green algae Girvanella, coat rounded bivalve (arrow at 1) and caliche lithoclast (arrow at 2) grains (scale is 1 mm).
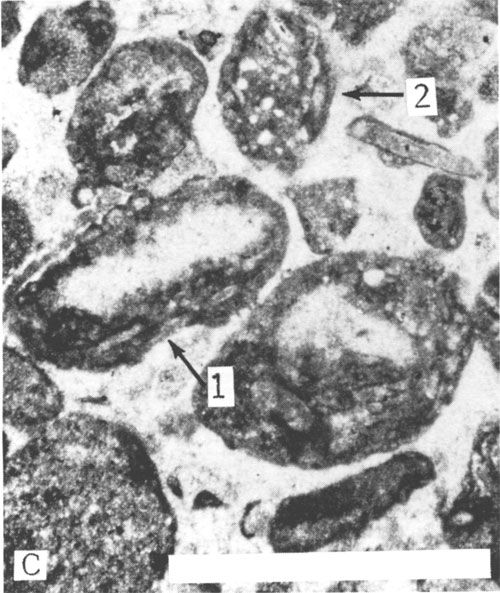
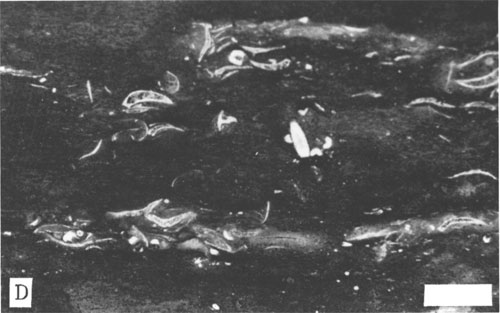
Figure 11D--Core slab of red-brown marine shale overlying unit I at 3,776 ft in the #1 Williamson "B" well contains numerous genera of brachiopods (light arcuate grains; scale is 1 cm).
The existence of three shoaling-upward sequences within one cycle is evidence that three distinct regressions took place. The upper two regressive sequences (rock units 3, 4, and 5 and rock units 6, 7, and 8) are nearly identical. At the base of each is a silty shale which grades upward into a low-energy marlstone. The content of carbonate mud increases upward in the marlstone unit and is truncated by shoal-water packstones and grainstones.
Faunal changes that accompany the vertical lithologic changes further support invoking a fluctuating sealevel in order to explain the complexities in the "E" Zone. Rock units 3 and 6 are dominated by a shallow-water, slightly restricted faunal assemblage consisting of bivalves, gastropods, and tubular-encrusting forams. They also contain substantial amounts of pellets commonly found in shallow-water carbonate sediments. Deeper-water, normal-marine fauna, including numerous genera of brachiopods, crinoids, bryozoans, and fusulinids, are found in the marlstones and silty shales.
The nonmarine rocks of unit 2 vary in thickness more so than any other rock unit in the "E"-Zone cycle, varying from a few feet to more than 30 ft (fig. 12). The difference in thickness over a short distance up to a few miles is presumed to be an estimate of the minimum relief on the exposed "E"-Zone carbonate surface (Dubois, 1980). The datum for the cross section in fig. 8, the base of the "D"Zone transgressive limestone, unit 1, was chosen so that the top of the "E"-Zone regressive carbonate illustrates this minimum topography. Unit 2 in the # 1 Williamson "B" well is only 3.5 ft thick. This thickness as well as the core on the cycle itself is nearly identical to well number 3 in the cross section (fig. 8), the # 1 Wertz, located 3/4 mi to the northwest and also in the Meeker Canal field. Most oil production from the "E" Zone is located where the nonmarine rocks are less than 5 ft thick. Moreover, all significant production is where these rocks are less than 10 ft thick (Dubois, 1979, 1980). Nevertheless, not all thin areas are productive in the "E" Zone. The Republican River field, which produces primarily from the "F" Zone, is an example.
Figure 12--Thickness map of nonmarine sediments of "E" Zone in Hitchcock County, Nebraska.
The relative abundance of grain-supported textures versus mud-supported textures and the presence of subaerial diagenetic patterns corresponds well with the change in thickness of nonmarine rocks. The two producing intervals of the "E" Zone, rock units 3 and 6, show considerably more facies changes, as illustrated in fig. 8, than "deeper"-water carbonates in the cycle. On positive seafloor features (areas having thin nonmarine rocks), both pay zones have grain-supported rock textures and shallow-water, restricted faunal assemblages. Whereas, in paleolows, laterally equivalent rocks generally have mud-supported textures and deeper-water, more normal-marine faunal assemblages.
Freshwater diagenesis during subaerial exposure of the "E"-Zone carbonates and original rock textures was important in generating porous reservoir rocks. Most porosity is secondary, a result of leaching of aragonitic skeletal grains and carbonate mud in packstones and grainstones in the vadose zone on topographic highs. In lows, deep weathering, accompanied by large-scale dissolution formed vertical fissures infiltrated by silt and clay. This completely destroyed any reservoir potential the original rocks may have had.
In areas without core data, abundant radioactivity logs (gamma ray-neutron-guard) may be correlated with logs from cored wells in order to identify rock units and map those areas that seem to have some potential for new production in the "E" Zone. Fig. 8 illustrates that correlation of rock units using gamma ray-neutron logs of cored wells. The most obvious and fruitful application is mapping of the nonmarine rock-interval thickness. Without some core control, identification of the "D"-Zone transgressive limestone (unit 1) on mechanical well logs would be difficult. This correlation was easily made to 220 well logs from other wells with the aid of 21 cores from the Meeker Canal field and 9 cores from other areas to produce the map in fig. 12.
The three distinct regressive sequences are recognizable on the gamma-ray curves of well logs (fig. 7). Carbonate content increases upwards in each regressive sequence. This is reflected in three definite sequences of upward-decreasing intensities on the gamma-ray curve of the "E"-Zone cycle.
"Hot" (radioactive) limestones common in the "E" Zone have created some interpretation problems when no cores are available. The source of the radioactivity is red chert like that in the # 1 Williamson "B" well in rock unit 6, at 3,800 ft on the well log (fig. 7). Without a core of the interval and with only a Radiation Guard Log, a pay zone can be easily mistaken for a shale or shaly limestone when this chert is present, particularly when it has good porosity. High porosity causes the neutron curve to move towards the center of the log. Taken with a high gamma-ray reading, the lithology anticipated without core would be shale. Other "hot" limestones shown on the well logs in fig. 8 include unit 6 of well 2, unit 9 of well 4, and units 6 and 9 of well 5.
It was on highs of the ancient seafloor that porosity was formed and later oil was trapped in the "E" Zone. Here, grain-supported textures prevailed and vadose leaching enhanced the porosity. In surrounding lows, rock textures are generally mud supported, and intense weathering destroyed any reservoir potential the original rock may have had. Other potentially productive paleohighs can be detected by mapping the nonmarine interval that overlies the "E"-Zone regressive limestone using available mechanical well logs in conjunction with core data.
Crowley, D. J., 1969, Algal-bank complex in Wyandotte Limestone (Late Pennsylvanian) in eastern Kansas: Kansas Geological Survey, Bulletin 198, 52 p. [available online]
Dubois, M. K., 1979, Factors controlling the development and distribution of porosity in the Lansing-Kansas City "E" Zone, Hitchcock County, Nebraska: M.S. thesis, University of Kansas.
Dubois, M. K., 1980, Paleotopography's influence on porosity distribution in the Lansing-Kansas City "E" Zone, Hitchcock County, Nebraska (abs.): American Association of Petroleum Geologists, Bulletin, v. 64 p. 701.
Dunham, R. J., 1962, Classification of carbonate rocks according to texture; in, Classification of Carbonate Rocks, William Ham, ed.: American Association of Petroleum Geologists, Memoir 1, p. 108-121.
Elias, M. K., 1937, Depth of deposition of the Big Blue (late Paleozoic) sediments in Kansas: Geological Society of America, Bulletin, v. 48, p. 403-432.
Frost, J. G., 1975, Winterset algal-bank complex, Pennsylvanian, eastern Kansas: American Association of Petroleum Geologists, Bulletin, v. 59, p. 265-291.
Gile, L. H., Peterson, F. F., and Grossman, R. B., 1965, The K-horizon--a master soil horizon of carbonate accumulation: Soil Science, v. 99, no. 2, p. 74-82.
Harbaugh, J. W., 1959, Marine bank development in Plattsburg Limestone (Pennsylvanian), Neodesha-Fredonia area, Kansas: Kansas Geological Survey, Bulletin 134, pt. 8, p. 289-331. [available online]
Harbaugh, J. W., and others, 1965, Field conference guide to Pennsylvanian marine banks, southeastern Kansas; in, Pennsylvanian Marine Banks in Southeastern Kansas: Geological Society of America, Annual Meeting, Kansas City Field Conference Guidebook, p. 1-46.
Heckel, P. H., 1975a, Field guide to Stanton Formation (Upper Pennsylvanian) in southeastern Kansas: Kansas Geological Society, 31st Regional Field Conference Guidebook, p. 2-71.
Heckel, P. H., 1975b, Stratigraphy and depositional framework of the Stanton Formation in southeastern Kansas: Kansas Geological Survey, Bulletin 210, 45 p. [available online]
Heckel, P. H., 1977, Origin of phosphatic black shale facies in Pennsylvanian cyclothems of the Midcontinent North America: American Association of Petroleum Geologists, Bulletin, v. 61, no. 7, p. 1,045-1,068.
Kansas Geological Society, 1966, Type logs of Kansas, 2 volumes.
Lee, W., and Merriam, D. F., 1954, Preliminary study of the structure of western Kansas: Kansas Geological Survey, Oil and Gas Investigations, No. 11, p. 1-23. [available online]
Moore, R. C., 1936, Stratigraphic classification of the Pennsylvanian rocks of Kansas: Kansas Geological Survey, Bulletin 22, 256 p. [available online]
Morgan, J. V., 1952, Correlation of radioactive logs of the Lansing and Kansas City Groups in central Kansas: Petroleum Transactions, AIME, v. 195, p. 111-118.
Parker, J. M., ed., 1961, Oil and gas field volume, Colorado-Nebraska: Rocky Mountain Association of Geologists, Denver, 390 p., 8 maps.
Parkhurst, R. W., 1961, Surface to subsurface correlations and oil entrapment in the Lansing and Kansas City Groups (Pennsylvanian) in northwest Kansas: M.S. thesis, University of Kansas, 71 p.
Rakaskas, J. E., 1982, Meeker Canal field; in, Oil and Gas Fields of Colorado, Nebraska, and Adjacent Areas, C. C. Marshall, ed.: Rocky Mountain Association of Geologists, 2 vol., p. 660-663.
Rascoe, B., 1962, Regional stratigraphic analysis of Pennsylvanian and Permian rocks of western Midcontinent, Colorado, Kansas, Oklahoma, Texas: American Association of Petroleum Geologists, Bulletin, v. 46, no. 8, p. 1,345-1,370.
Rascoe, B., 1978, Late Paleozoic structural evolution of the Las Animas Arch; in, J. D. Pruit and P. E. Coffin, eds., Energy Resources of the Denver Basin, 1978 Symposium, Rocky Mountain Association of Geologists, Denver, Colorado, p. 113-127.
Watney, W. L., 1977, Lithofacies of Upper Pennsylvanian Lansing-Kansas City Groups in northwest Kansas-southwest Nebraska (abs.): American Association of Petroleum Geologists, Bulletin, v. 61, p. 879.
Watney, W. L., 1980, Cyclic sedimentation of the Lansing-Kansas City in northwestern Kansas and southwestern Nebraska: Kansas Geological Survey, Bulletin 220, 72 p. [available online]
Watney, W. L., and Ebanks, W. J., Jr., 1978, Early subaerial exposure and freshwater diagenesis of Upper Pennsylvanian cyclic sediments in northern Kansas and southern Nebraska (abs.): American Association of Petroleum Geologists, Bulletin, v. 62, p. 510-511.
Weller, J. M., 1958, Cyclothems and larger sedimentary cycles of the Pennsylvanian: Journal of Geology, v. 66, p. 195-207.
Kansas Geological Survey
Comments to webadmin@kgs.ku.edu
Web version April 16, 2010. Original publication date 1985.
URL=http://www.kgs.ku.edu/Publications/Bulletins/Sub6/Dubois/index.html