![]()
Prev Page--Introduction || Next Page--Geologic Formations
Geography
Topography
Relief.--The region discussed in this report lies west of the Flint Hills and is included in the Great Bend Prairie physiographic province of Moore (1940). It is characterized by the extreme flatness of large areas and low topographic relief in parts of the area. The belt of sand dunes trending northwest-southeast along the northeast side of the Arkansas River valley, the scarps formed by Cretaceous sandstones in the northwestern and northeastern parts of the area, and the rough area underlain by Ninnescah shale along the Ninnescah River provide the only prominent relief to an otherwise nearly featureless plain.
The lowest points in the area, about 1,280 feet above sea level, occur along the Smoky Hill and Arkansas rivers where these streams flow out of the area. The highest points occur south of Sharps Creek about 3 miles north of Windom, McPherson County, and are about 1,700 feet above sea level.
The wide, flat, poorly drained valley plain of the Arkansas River, and the wide, flat to gently rolling surface of the ancient McPherson Valley comprise most of the area here discussed. Low terraces occur along the Arkansas and Smoky Hill rivers, but are not prominent topographic forms.
Drainage.--Most of the area covered by this report is drained by the Arkansas River and its tributaries. The northwestern part of the area is drained by the Smoky Hill River, a part of the Kansas River system, and the northeastern part is drained by the headwaters of Cottonwood River, a part of the Neosho River system. A few square miles southeast of Newton are drained by small tributaries of Walnut River, which joins the Arkansas River at Arkansas City. The central part of the area is drained by the Little Arkansas River which joins the Arkansas at Wichita. The southwestern part is drained by the north fork of the Ninnescah River which joins the Arkansas River near Oxford in Sumner County. The more important tributaries to the Little Arkansas River are Kisiwa, Emma, Turkey, and Black Kettle creeks; the tributaries to the Smoky Hill River are Sharps, Paint, Indian, and Gypsum creeks.
Climate
The climate of this part of central Kansas is characterized by moderate precipitation, a wide range of temperature variations, moderately high average wind velocity, and comparatively rapid evaporation. The summer days generally are hot, especially during July and August. The winters are moderately cold but generally are free from excessive snowfall. All climatic data presented in this report were compiled from records of the U.S. Weather Bureau.
The mean annual temperature is 56.0°F. at McPherson, and 57.9°F. at Wichita. The highest temperatures occur during the three summer months, the monthly mean at McPherson and Wichita, respectively, being 74.7°F. and 75.0°F. in June, 80.7°F. and 80.4°F. in July, 80.0°F. and 79.6°F. in August. The lowest temperatures occur in winter, the monthly mean at McPherson and Wichita, respectively, being 33.0°F. and 34.7°F. in December, 30.1°F. and 32.1°F. in January, and 33.6°F. and 35.1°F. in February. The highest recorded temperatures at these two stations are 117°F. at McPherson and 114°F. at Wichita. The lowest recorded temperatures are -27°F. at McPherson and -22°at Wichita. The year 1936 was one of unusual extremes, the highest and lowest temperatures having been 117°and -11°F. at McPherson and 114°and -8°F. at Wichita.
The average date of the last killing frost in the spring is April 9 at Wichita and April 22 at McPherson, but there have been killing frosts as late as May 15 at Wichita and May 27 at McPherson. The first killing frost in the fall has occurred as early as September 20 at McPherson and September 26 at Wichita, but the average date for this occurrence is October 16 at McPherson and October 22 at Wichita. The average length of the growing season is 177 days at McPherson and 196 days at Wichita.
Normal annual precipitation and other precipitation data are given in Table 1.
Table 1.--Precipitation data from six U.S. Weather Bureau stations.
| Station | Length of record (years) |
Normal annual precipitation (inches) |
Greatest annual precipitation of record |
Least annual precipitation of record |
||
|---|---|---|---|---|---|---|
| Year | Precipitation (inches) |
Year | Precipitation (inches) |
|||
| Hutchinson | 54 | 28.53 | 1944 | 46.97 | 1921 | 16.20 |
| McPherson | 56 | 28.91 | 1944 | 39.98 | 1921 | 15.57 |
| Mt. Hope | 51 | 28.29 | 1944 | 42.64 | 1910 | 16.38 |
| Newton | 48 | 31.25 | 1922 | 48.69 | 1936 | 18.67 |
| Sedgwick | 28 | 30.20 | 1927 | 42.85 | 1936 | 16.93 |
| Wichita | 56 | 30.37 | 1944 | 43.53 | 1936 | 15.58 |
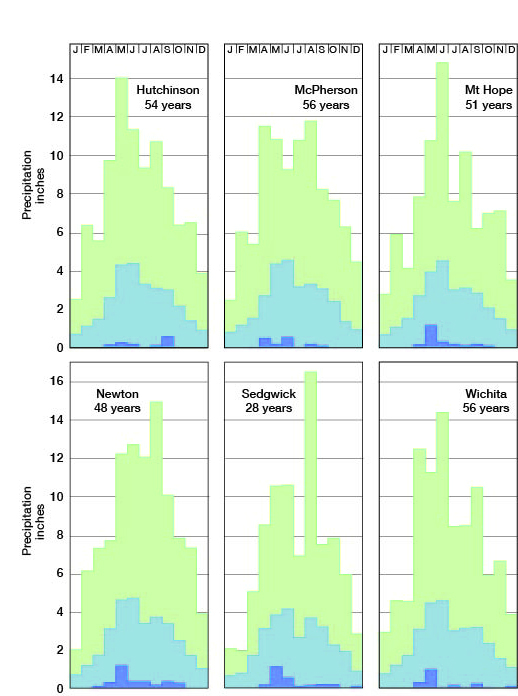
The study of data collected at six U.S. Weather Bureau stations indicates that the least recorded annual precipitation in the area was 15.57 inches at McPherson in 1921 and the greatest recorded annual precipitation was 48.69 inches at Newton in 1922. Annual precipitation at each of the stations is shown graphically in Figures 2 to 7, inclusive. Normal annual precipitation in this region is about 29 inches; at Newton it is 31.25 inches, and at Hutchinson it is 28.53 inches. Deviations from the normal are frequent, however, as shown in Figures 2-7. Precipitation in this area seems to follow more or less irregular cycles in which periods of excessive moisture alternate with periods of deficient moisture or drought. A large proportion of the precipitation falls as torrential rains, followed by periods of scanty rainfall. Between 70 and 75 percent of the annual precipitation falls during the crop-growing season from April through September (Fig. 8). The normal rainfall during June, the wettest month, is about 4.5 inches; during January, the driest month, it is only about 0.7 inch.
Figure 2--Annual precipitation and cumulative departure from normal precipitation at Hutchinson.
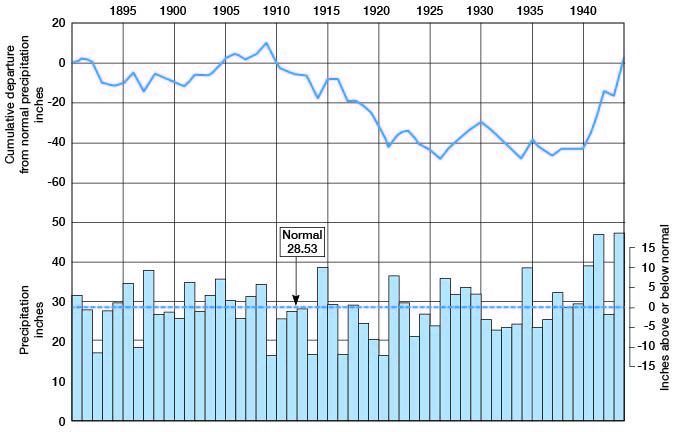
Figure 3--Annual precipitation and cumulative departure from normal precipitation at McPherson.
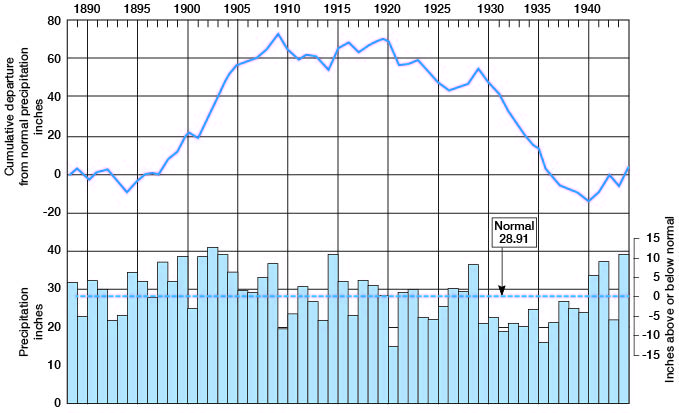
Figure 4--Annual precipitation and cumulative departure from normal precipitation at Mt. Hope.
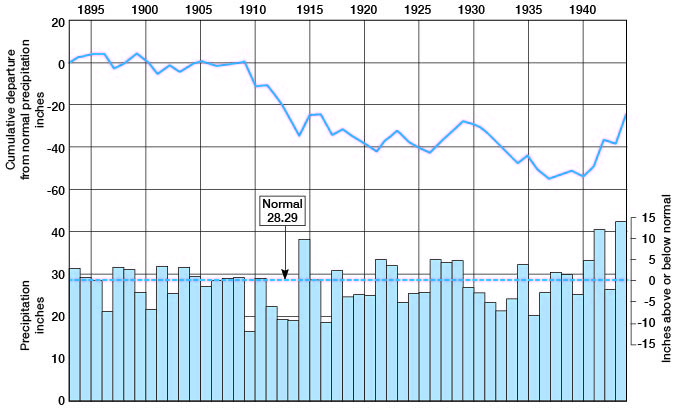
Figure 5--Annual precipitation and cumulative departure from normal precipitation at Newton.
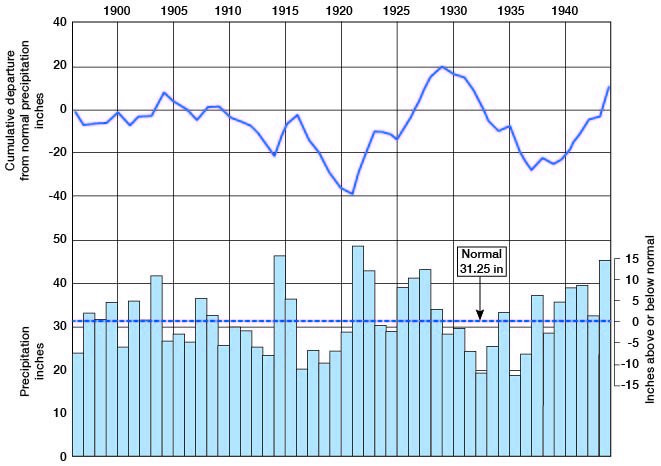
Figure 6--Annual precipitation and cumulative departure from normal precipitation at Sedgwick.
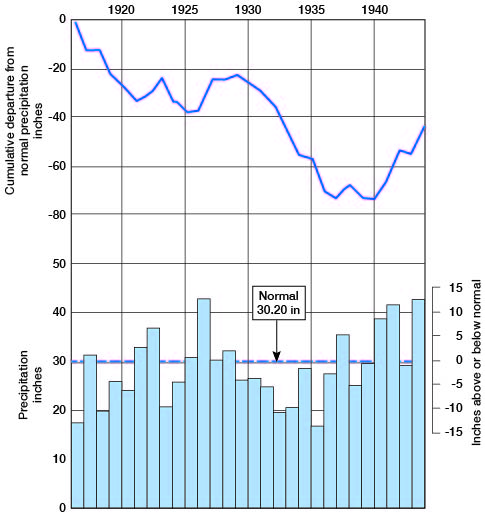
Figure 7--Annual precipitation and cumulative departure from normal precipitation at Wichita.
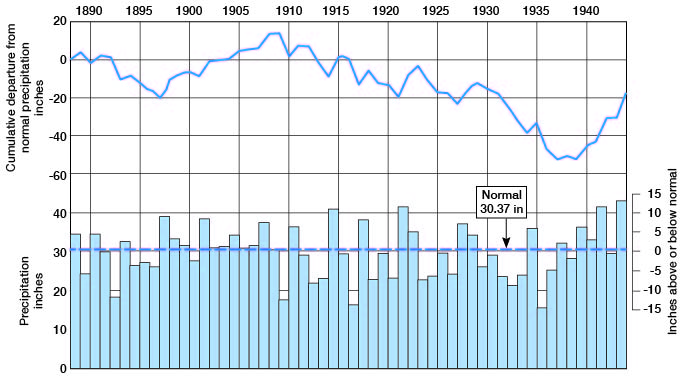
Figure 8--Monthly distribution of rainfall at Hutchinson, McPherson, Mt. Hope, Newton, Sedgwick, and Wichita.
The prevailing winds over this region are from the south, except in February when they are from the north. The greatest wind movement is in March and April, after which it decreases until August, which is the least windy month of the year. The sun shines in Wichita 68 percent of the time possible.
Population
The area included in this report is irregular as far as political boundaries are concerned. It comprises all of McPherson County and unequal parts of Harvey, Marion, Reno, and Sedgwick counties; hence the exact population of this area is not readily determinable. The population in 1940 in each of the counties included wholly or partly in the area of this report is given in Table 2. (The reports of the U.S. Bureau of the Census are the source of population data presented here unless otherwise indicated.) The greatest average population density is in Sedgwick County, owing to the large percentage of urban population.
Table 2.--Population in the counties included in this report.
| County | Total Population, 1940 |
Average population per square mile |
Percent increase (+) or decrease (-) in population |
Urban population (1940) |
Rural population (1940) |
Percent urban population |
Total population, 1945 |
||
|---|---|---|---|---|---|---|---|---|---|
| From 1920 to 1930 |
From 1930 to 1940 |
1930 | 1940 | ||||||
| Harvey | 21,712 | 40.2 | +6.6 | -1.8 | 11,048 | 10,664 | 49.9 | 50.9 | 21,030 |
| Marion | 18,951 | 19.8 | -9.5 | -8.6 | 18,951 | 17,408 | |||
| McPherson | 24,151 | 27.0 | +8.0 | +2.4 | 7,194 | 16,957 | 26.1 | 29.8 | 22,314 |
| Reno | 52,165 | 41.6 | +7.6 | +9.2 | 30,013 | 22,152 | 56.7 | 57.5 | 50,607 |
| Sedgwick | 143,311 | 143.5 | +47.8 | +5.1 | 114,966 | 28,345 | 81.5 | 80.2 | 203,398 |
The population in 18 cities in this area having public water supplies is given in Table 3. The increase in population in the City of Wichita from 114,966 persons in 1940 to about 183,000 persons in 1944 (Table 4) is indicative of the magnitude of the city's participation in war industry. This city was fortunate in that just before the war period, it had developed a water supply adequate to meet the demands of a rapidly expanding population and industry.
Table 3.--Population in 1930, 1940, and 1945 of cities in the area having public water supplies.
| City | Population in 1930 | Population in 1940 | Population in 1945 |
|---|---|---|---|
| Buhler | 520 | 634 | 605 |
| Burrton | 649 | 842 | 787 |
| Canton | 728 | 796 | 662 |
| Galva | 358 | 463 | 384 |
| Halstead | 1,373 | 1,397 | 1,331 |
| Haven | 553 | 653 | 642 |
| Hesston | 526 | 403 | 414 |
| Hutchinson | 27,085 | 30,013 | 30,981 |
| Inman | 533 | 507 | 551 |
| Lindsborg | 2,016 | 1,913 | 1,955 |
| Marquette | 714 | 609 | 641 |
| McPherson | 6,147 | 7,194 | 7,038 |
| Moundridge | 870 | 864 | 767 |
| Mt. Hope | 466 | 422 | 458 |
| Newton | 11,034 | 11,048 | 10,970 |
| Sedgwick | 832 | 738 | 801 |
| Valley Center | 896 | 700 | 669 |
| Wichita | 111,110 | 114,966 | 155,968 |
Table 4.--Population in the City of Wichita and in Greater Wichita, including the city.
| (1) 1930 | (1) 1940 | (2) 1943 | (3) 1944 | |
|---|---|---|---|---|
| City of Wichita | 111,110 | 114,966 | 174,000 | 183,000 |
| Greater Wichita | 119,831 | 128,010 | 194,000 | 204,000 |
| 1. From statistics published by U.S. Bureau of the Census. 2. From a publication by the City of Wichita, "Wichita's population," p. 49, Table 3. 3. From estimate by city officials, in a letter dated Nov. 28, 1944. | ||||
Transportation
The area is well served by lines of six railroads including two main transcontinental lines (Pl. 1). The main line of the Atchison, Topeka and Santa Fe Railway crosses the middle of the area through Newton, Halstead, Burrton, and Hutchinson; a branch line extends south from Newton through Sedgwick, Valley Center, and Wichita to points in Oklahoma and Texas; and another east-west line goes through Lehigh, Canton, Galva, McPherson, and Conway. The main line of the Chicago, Rock Island, and Pacific Railroad traverses part of the area through Canton, Galva, McPherson, Inman, Medora, and Hutchinson, and a branch line connects Wichita with states to the north and south. The Missouri Pacific Railroad has lines connecting Wichita and Hutchinson, Wichita and points south and east, and a freight line connecting Newton and McPherson through Hesston and Moundridge. A line of the St. Louis and San Francisco Railroad connects Wichita, Bentley, Burrton, Buhler, Medora, and points to the west. A branch line of the Union Pacific Railroad connects McPherson and Lindsborg with a through line at Salina.
The network of modern highways which traverse the area is shown on Plate 1. The greatest traffic moves on U.S. Highway 81 through Wichita, Newton, McPherson, and Lindsborg; U.S. Highway 54, east and west through Wichita; U.S. Highway 50S through Newton, Burrton, and Hutchinson; and U.S. Highway 50N, through Canton, Galva, McPherson, and Conway. Numerous improved county roads and one state highway (Kansas 17) connect with the main highways. Most of the township roads are graded.
Agriculture
This area is dominantly agricultural although recently the trend has been toward industrialization. The soils of the area are of several types, most of which are suited to the growing of wheat and other small grains. Alfalfa and other legumes are grown in the stream valleys. The sand hills and parts of the areas underlain by Cretaceous and Permian rocks comprise grazing lands. Irrigation is practiced only on a few farms. Acreages devoted to the principal crops are given in Table 5.
Table 5.--Acreage of farms and principal crops in this area in 1945 (From U.S. Census Bureau).
| County | Number of farms |
Acres in farms |
Average acreage per farm |
Acres of wheat |
Acres of corn |
Acres of sorghum |
Acres of oats |
Acres of alfalfa |
Acres of hay crops (exclusive of alfalfa) |
Acres of pasture |
|---|---|---|---|---|---|---|---|---|---|---|
| Harvey | 1,529 | 323,930 | 211.9 | 110,104 | 24,248 | 25,753 | 28,652 | 21,155 | 2,834 | 77,119 |
| Marion | 2,246 | 579,571 | 258.0 | 123,399 | 51,380 | 51,413 | 56,839 | 17,324 | 10,133 | 216,249 |
| McPherson | 2,274 | 560,629 | 246.5 | 243,811 | 23,946 | 38,287 | 30,271 | 17,114 | 7,783 | 147,515 |
| Reno | 3,058 | 806,666 | 263.8 | 344,606 | 17,687 | 93,188 | 25,370 | 26,849 | 4,796 | 194,807 |
| Sedgwick | 3,025 | 582,549 | 192.6 | 214,113 | 45,603 | 34,148 | 50,220 | 36,027 | 9,542 | 126,634 |
Natural Resources and Industries
The rich soil and abundant ground-water supply are foremost among the natural resources of this area. Natural gas and petroleum are produced from many oil fields, especially in McPherson and Harvey counties. Salt is mined at three plants in Hutchinson and vicinity. Sand and gravel deposits are abundant in this area and the material is exploited widely from many pits (Pl. 1).
Wichita is an important transportation and distribution center and many industries and establishments in the city are devoted to these services. The City of Wichita has attained national prominence in the manufacture of aircraft and this industry employs many people living in this area. Other important industries are the production and refining of petroleum products, the milling and storage of grain, meat packing, the production and processing of salt, and the manufacture of foundry products.
Prev Page--Introduction || Next Page--Geologic Formations
Kansas Geological Survey, South-central Kansas
Comments to webadmin@kgs.ku.edu
Web version April 2005. Original publication date July 1949.
URL=http://www.kgs.ku.edu/Publications/Bulletins/79/04_geog.html