![]()
Prev Page--Topography || Next Page--Stratigraphy
Climate
General Features
The climate of southwestern Kansas is the subhumid to semiarid type. The following description, from the U. S. Weather Bureau Climatic Summary of Western Kansas (Flora, 1932a, p. 1), outlines the general conditions:
The western half of Kansas is characterized by a rather dry climate, abundant sunshine, warm summer days that are alleviated by a good wind movement and low relative humidity, pleasantly cool summer nights, and by winters that, while cold, are commonly free from excessive snowfall and the damp, cloudy days that occur so often over most parts of the country farther east. Hot winds occasionally blow during a dry, heated period and are the cause of great crop damage and much discomfort while they are occurring.
Winter months, as a rule, are slightly colder and windier than in eastern Kansas, but are drier. Cold waves occasionally bring pronounced drops in temperature and are often accompanied by driving snow.
A more detailed discussion of climatic factors, summarized from U. S. Weather Bureau publications (chiefly Flora, 1932-1939) is given below. For additional data, the reader is referred to the works of Johnson (1901), Ward (1925), and Bates (1935).
Precipitation
The average annual precipitation of southwestern Kansas decreases from about 22 inches at the east to about 17 inches at the west. Departures from the average, however, are frequent and extreme, resulting in irregular alternations from periods of excessive moisture to periods of notably deficient moisture or drought (fig. 3). In wet years precipitation reaches 30 inches or more, and in dry years it declines to 10 inches or less. On the whole, the number of years in which the rainfall is below average is considerably greater than the number in which it is above average: In general, yearly totals for different recording stations rise or fall together, but the amount of rise and fall is not always proportionate, and, owing to the local or "spotty" nature of the rainfall, minor reversals between different stations are common.
Figure 3--Annual variations in southwestern Kansas rainfall. Based on data tabulated by the U. S. Weather Bureau (Flora, 1932-'39). Blank spaces in the records for Richfield and Syracuse indicate gaps in the period of observation. The dashed lines indicate averages for the years up to and including 1930.
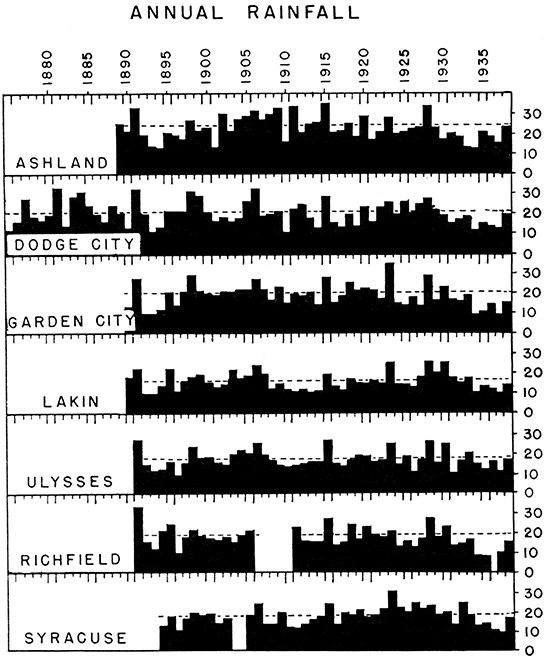
The recent drought, beginning in 1931, is the most severe on record, but is not without precedent. Other notably dry periods occurred in 1892-'94, and in 1910-'14. If longer records were available, others of equal or greater duration and severity would undoubtedly be shown, and their recurrence in the future is to be expected. This variability in rainfall has been the governing factor in the agricultural history of the region. Wet years brought "boom" times, immigration, and agricultural expansion. Dry years led to crop failure, bankruptcy, and emigration. This cycle has been repeated several times, and it remains to be seen whether lessons have been learned.
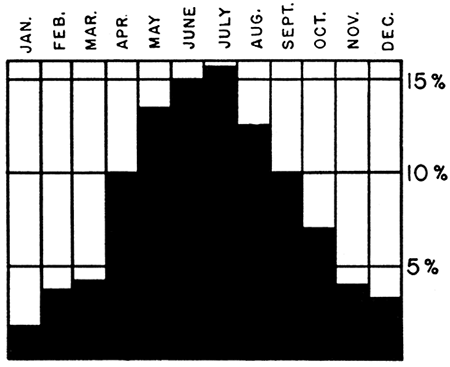
Of the total annual precipitation, by far the greater part falls during the summer months (fig. 4), thus allowing maximum utilization by growing crops. July is the wettest month and January the driest. In detail, however, precipitation is generally local and sporadic. Torrential downpours, or "cloudbursts," are common, and, although fairly wide areas may be affected by a single storm, the intensity of rainfall varies markedly from one locality to another. Records at Dodge City show many falls of 2 to 3 inches in 1 hour, and of 6 inches in 24 hours.
Figure 4--Average monthly distribution of precipitation in southwestern Kansas.
During the winter months, from November to April, a part of the precipitation takes the form of snowfall, which may total as much as 20 inches. Generally the snow drifts considerably, and rarely does it cover the ground for longer than a week at a time. February is the month of maximum snowfall.
During the summer months, especially June and July, hail storms are not uncommon, and some are very destructive to crops.
Temperature
Average monthly temperature ranges from about 30° in January to about 78° in July. Average monthly maxima, however, range from about 43° to 93° for the same months, and average monthly minima from about 17° to 65°. Detailed monthly variations for Lakin, most nearly representative of the few stations for which complete temperature records are available, are given in figure 5.
Figure 5--Monthly temperature ranges at Lakin.
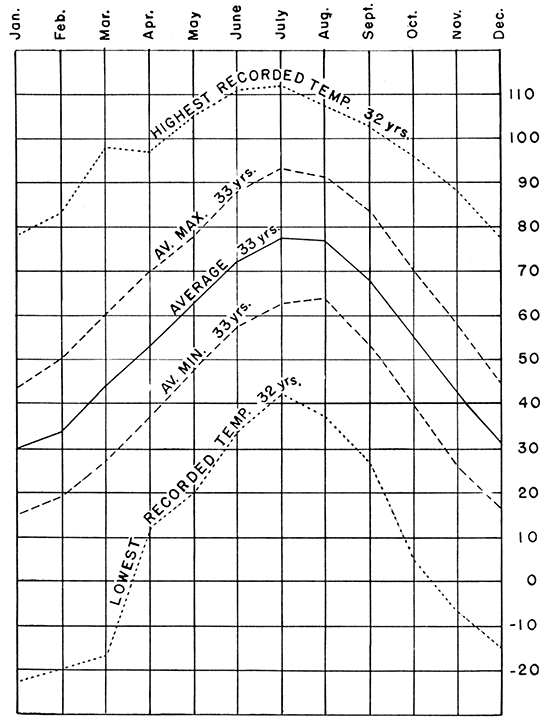
Daily temperature ranges during the summer months are commonly as great as 30°, thus making for relatively cool nights after even the hottest days. Daily ranges sometimes reach 50°.
The highest recorded temperature in the area was 116°, at Hugoton, Stevens County. The lowest recorded temperature was -28°, at Ulysses, Grant County.
Wind
The only station in this area at which complete wind observations have been made is the one at Dodge City. There the prevailing wind direction is northwest for 5 months of the year--November to March, inclusive--and southeast for the remaining 7 months, except September, when it is south. At Johnson, in Stanton County, prevailing wind directions are essentially the same. At Liberal, partial records kept by the Soil Conservation Service from March, 1936, to November, 1939, inclusive, show that the prevailing winds were northerly for the 4 months November through February, and southerly for the 6 months, May through October. During March northerly and southerly winds were about equally important, but in April the northerly winds were again prevalent. Southerly winds are significant during every month of the year, and reach the peak of their activity in July and August, when their strength and constancy considerably exceed those of the northerly winds at their best.
The average hourly wind velocity at Dodge City ranges from 9.1 miles per hour in August to 11.8 in April. Maximum wind velocities, however, reach 58 miles per hour, and are greatest in the winter and spring months. Winds of maximum velocity blow from the northern quadrant for 8 months of the year--January to March, and July to November.
Tornadoes, although infrequent, have occurred in the area in every month of the year except December and January. They are more common in May and June.
Sunshine and Cloudiness
Records at Dodge City show an average of 178 days of the year to be clear, 65 to be cloudy, and 122 to be partly cloudy. The number of clear days is relatively greater during the summer and early fall months.
Humidity and Evaporation
On the whole, the air is very dry in southwestern Kansas, and the relative humidity is low. Thirty-year records at Garden City Experimental Farm show the following average rates of free surface evaporation for the months of the growing season: April, 6.68 in.; May, 8.46 in.; June, 10.25 in.; July, 11.90 in.; August, 10.42 in.; September, 8.10 in. It may be noted that maximum evaporation occurs during the month of maximum rainfall, and that the rate of evaporation greatly exceeds the rate of precipitation.
Dust Storms
Local dust storms have been known in western Kansas since the country was first settled. (Throckmorton and Compton, 1938, pp. 7-8.) It was not until the recent drought, however, that dust storms became so frequent, so severe, and extended over so wide an area as to attract national attention. After several dry years, dust blowing became severe in 1934, and reached a climax in 1935. During some of the storms of that year--
dust became so thick in the southwestern part of the state as to cause total darkness early in the afternoon and chickens went to roost as early as 3 p. m. In some localities schools in the western counties were closed on account of the danger to children in going and coming through the dust. In several of them all forms of travel, including trains and busses, were stopped in the vicinity of Dodge City and highways were closed. (Flora, 1935, p. 104.)
At several times, these dust storms extended beyond the eastern border of the state. Dust blowing continued during 1936 and 1937, but, although locally severe, generally did not extend eastward nearly so far. In 1938, increased rainfall brought considerable alleviation in many places. Table 1 shows the frequency of dust storms of different intensities at Garden City from early in 1935 through 1937, and table 2 presents similar data for Liberal.
Table 1--Number of days per month on which dust storms were recorded at Garden City Experimental Farm. (Data from Susan Hadley, Secretary.) Intensity of dust storma: (A) Dusty, but visibility greater than 1/4 mile; (B) very dusty, visibility 100 feet to 1/4 mile; (C) extremely dusty, visibility less than 100 feet.
| Date of Storms | Intensity | ||
|---|---|---|---|
| A | B | C | |
| 1935--March | 1 | 1 | 1 |
| 1935--April | 6 | 16 | 1 |
| 1935--May | 3 | 2 | |
| 1935--June | 1 | ||
| 1936--February | 1 | 1 | |
| 1936--March | 3 | 2 | |
| 1936--April | 1 | 2 | 1 |
| 1936--May | 6 | 1 | |
| 1937--January | 1 | 1 | |
| 1937--February | 1 | 6 | 1 |
| 1937--March | 4 | 4 | 2 |
| 1937--April | 8 | 3 | 2 |
| 1937--May | 7 | 7 | 1 |
| 1937--June | 3 | 1 | 1 |
| 1937--July | 5 | ||
Table 2--Number of dusty days recorded at the U. S. Soil Conservation Service office at Liberal. (Data from M. M. Taylor and E. O. Hill of that office.) Intensity of dust storms: (A) Dusty but visibility greater than 0.2 mile; (B) very dusty, visibility less than 0.2 mile.
| Month | A | B | Month | A | B | |
|---|---|---|---|---|---|---|
| 1936--Mar | 11 | 11 | 1938--Jan | 6 | 3 | |
| 1936--April | 14 | 1938--Feb | 6 | 3 | ||
| 1936--May | 12 | 2 | 1938--Mar | 13 | 3 | |
| 1936--June | 5 | 1938--April | 12 | 2 | ||
| 1936--July | 1938--May | 10 | 2 | |||
| 1936--Aug | 1 | 1938--June | 16 | 1 | ||
| 1936--Sept | 1 | 1938--July | 8 | |||
| 1936--Oct | 2 | 1938--Aug | 17 | |||
| 1936--Nov | 2 | 1938--Sept | 6 | |||
| 1936--Dec | 1938--Oct | 9 | ||||
| 1937--Jan | 1 | 1938--Nov | 6 | |||
| 1937--Feb | 8 | 1 | 1938--Dec | 5 | ||
| 1937--Mar | 2 | 2 | 1939--Jan | 5 | ||
| 1937--April | 5 | 2 | 1939--Feb | 8 | ||
| 1937--May | 1939--Mar | 6 | ||||
| 1937--June | 1 | 1 | 1939--April | 10 | ||
| 1937--July | 1 | 1939--May | 11 | |||
| 1937--Aug | 6 | 1939--June | 10 | |||
| 1937--Sept | 2 | 1939--July | 8 | |||
| 1937--Oct | 1939--Aug | 7 | ||||
| 1937--Nov | 1 | 1939--Sept | 8 | 1 | ||
| 1937--Dec | 1 | 1939--Oct | 12 | |||
| 1939--Nov | 5 |
Dust storms occurred most frequently in the late winter and early spring months, but began as early as January and continued until summer. In the extreme southwestern counties, sporadic dust "blows" of varying intensity occurred in every month of the year. Dust-bearing winds came from all points of the compass, and not infrequently shifted their direction 1800 or more during a single storm. Records at Garden City show dust storms of all intensities occurring at all wind velocities from 5 to more than 30 miles per hour. Obviously, decreasing wind velocity favors settling of dust already in suspension, so that, away from the source of the dust, no definite relation between wind velocity and dust intensity can be expected.
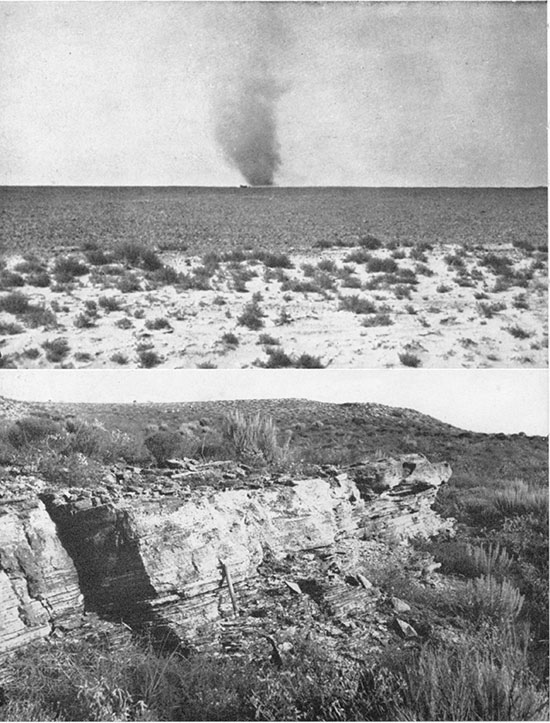
Minor dust storms that I observed in the summer of 1937 were of two types. The first type involved a gradually increasing haziness of the air as more and more dust was stirred up by strong, steady winds (pl. 7A) . This type lasted hours or days, until the strength of the wind declined. The second type came more abruptly, after the fashion of a thunder-shower. It progressed in wavelike manner and showed a steeply inclined and sharply defined front, resembling an irregularly lobate dark cloud rolling over the ground (pl. 7B). With this cloud came strong, gusty currents of air and temporary darkness, and in its wake were lingering swirls and streamers of dust and a gradually decreasing haziness. This type of dust storm generally came late in the afternoon, and sometimes was followed immediately by a slight amount of rainfall, though more commonly by nothing more than a somewhat clouded sky. Preceding such storms, dust whirls or "dust devils" were usually conspicuous (pl. 8A).
Plate 7--A, Dust storm at Wilburton, in Morton County, August, 1937. B, Approaching dust storm southwest of Satanta, July, 1937.
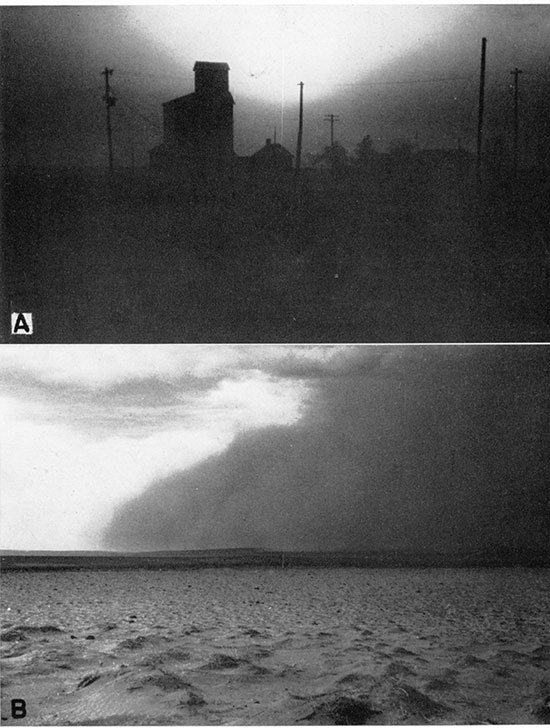
Plate 8--A, Dust whirl. B, Lower Pliocene (?) beds of southeastern Seward County.
Prev Page--Topography || Next Page--Stratigraphy
Kansas Geological Survey, Geology
Placed on web Feb. 8, 2017; originally published September 15, 1940.
Comments to webadmin@kgs.ku.edu
The URL for this page is http://www.kgs.ku.edu/Publications/Bulletins/34/04_clim.html