Previous--Roland SE Field, Rush County || Next--Damme Field, Finney County
1Pickrell Drilling Co., Inc., and 2Consultant
This article available as an Acrobat PDF file (9 Mb).
Lexington field is located in northeastern Clark County, Kansas, principally in secs. 19 and 20, T. 31 S., R. 21 W. Geologically, the field is situated on the northeastern shelf of the Hugoton embayment of the Anadarko basin, near the eastern limit of Morrowan Stage deposition. The field has yielded over 4 million bbls of oil and about 4 BCF gas from combined Morrow and Mississippian reservoirs. Fluvial sandstones within the Morrow section are responsible for over 96% of the oil and about 75% of the gas produced from the field.
Productive Morrow sandstones within the field were deposited in a deeply incised fluvial channel. The Morrow trap is stratigraphic with reservoir sandstones being effectively encased in impermeable shales. Mississippian production, in contrast, is primarily related to the development of highly fossiliferous zones which have reservoir-quality porosity over a limited area. This anomalous porosity is erosionally absent in the productive Morrow channel region. Productive Mississippian wells are situated on both sides of the channel.
The discovery well in the field was drilled on a structural high with the Mississippian and Ordovician as potential reservoir targets. Morrow reserves were fortuitously encountered during field development.
The seismic expression of the channel environment is somewhat subtle. After-the-fact modeling is of assistance in characterizing the Morrow-Mississippian interface. Conventional data evaluation, coupled with trace-attribute analysis, has resulted in a fairly comprehensive understanding of this complex subsurface system.
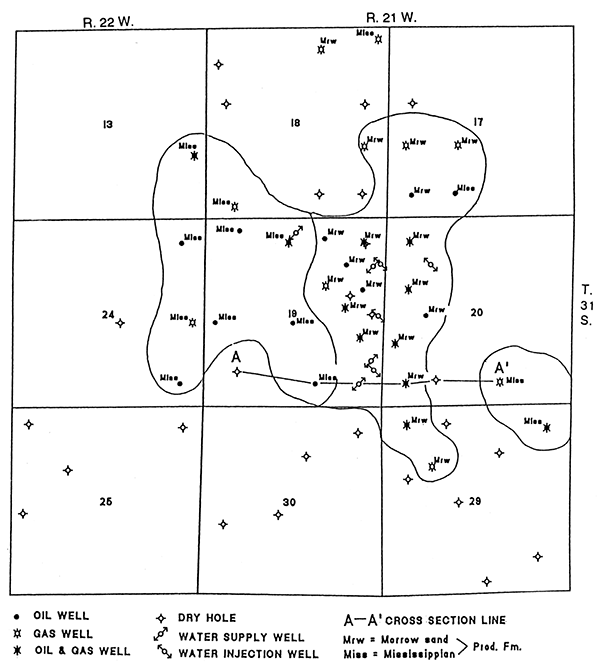
The Lexington field discovery by Mesa Petroleum in 1977 (discovery well: Mesa 1-19 Seacat, SW SE sec. 19, T. 31 S., R. 21 W.) did not receive excessive industry attention (figs. 1 and 2). The initial Mississippian production of 94 BOPD and 603 MCFGPD were good numbers for probable commercial production, but not overly so. However, the December 1978 Morrowan "re-discovery" with flowing potential of 984 BOPD and 374 MCFGPD rekindled a heated exploration play which had already resulted in significant Morrow production at Harper Ranch and other proximal fields. Final field extents and a production index map are provided in fig. 3.
Figure 1--Regional location map showing project proximity to geologic provinces.
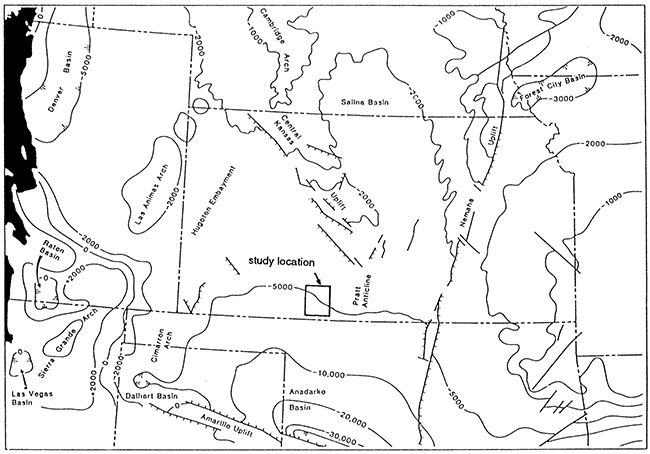
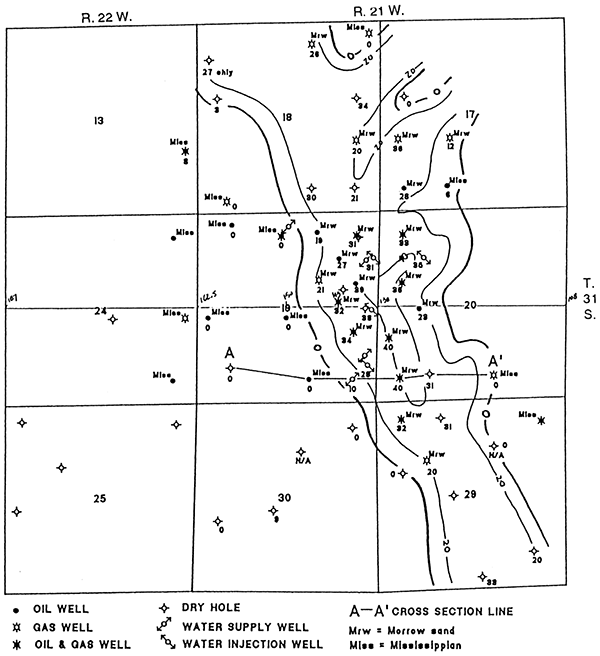
Figure 2--Production index map, highlighting Morrow production.

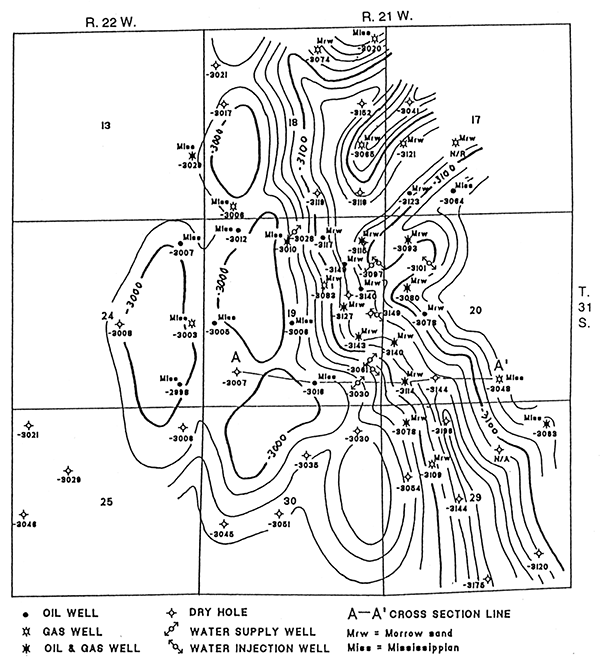
Figure 3--Lexington fleld extents and local production index, contour interval = 20 ft (6 m).
An excellent paper by Emery and Sutterlin (1986) provides insight regarding depositional environments in the Morrowan section. Included in that paper are numerous subsurface maps and discussion related to the structural and depositional history of the Lexington area. Additional reservoir insights and production data are given by Wilkins (1985). Related research pertaining to regional Morrowan deposition is given by Swanson (1979).
The major focus in this paper is the reexamination of the subsurface work in light of all released well data and available seismic control. Our efforts are concentrated on Morrowan stratigraphy and seismic expression. The seismic profile incorporated in this paper crosses a "typical" estuarine channel sandstone reservoir. The exact location of the seismic profile made available for the study is not shown in order to preserve the proprietary integrity to the current data owners (Samson Resources, Tulsa, Oklahoma).
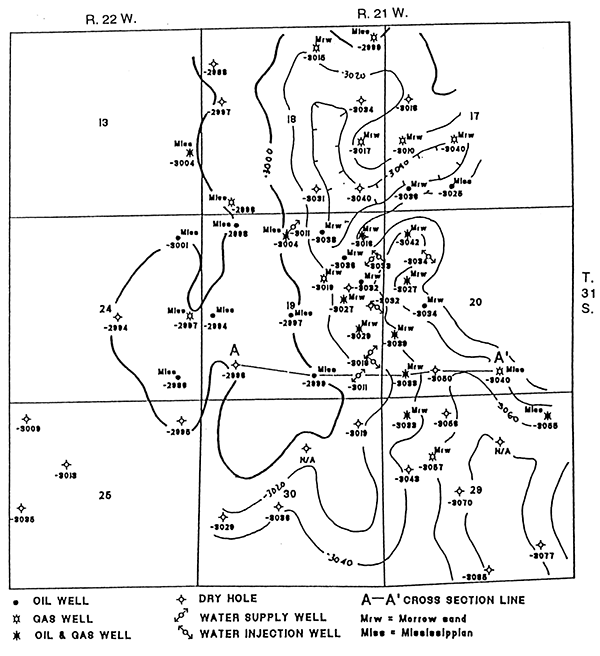
The estuarine channel into which the Morrow reservoir sandstones at Lexington field were deposited is the product of regional uplift which either precipitated or substantially enhanced the erosional intensity at the Mississippian unconformity. Relief on the unconformable surface has been defined by drilling to be as much as 150 ft (45 m) over a distance of 1/4 mi (l/2 km) (fig. 4), indicating a dip rate of about 600 ft/mi (114 m/km), or about a 6.5° incline from channel "bluff' to channel "bottom." Long, narrow channel segments and abrupt local offsets in the Mississippian incisement reasonably suggest fault control.
Figure 4--Geologic structure, top Mississippian, contour interval = 20 ft (6 m).
A variety of sediments have filled in the postulated estuarine environment. According to Emery and Sutterlin (1986), four subfacies of the productive Morrow sandstone are recognized:
The gross stratigraphic interval attributable to the Morrow section (base Inola-top Mississippian) ranges from a minimum of about 6 ft (1.8 m) on unscoured Mississippian ridges to a maximum of about 117 ft (35 m) near the depocenter of the channel. The map configuration of the Morrow interval is an inverse image of the Mississippian surface (fig. 5).
Figure 5--Isopach map, base Inola to top Mississippian, contour interval = 20 ft (6 m).
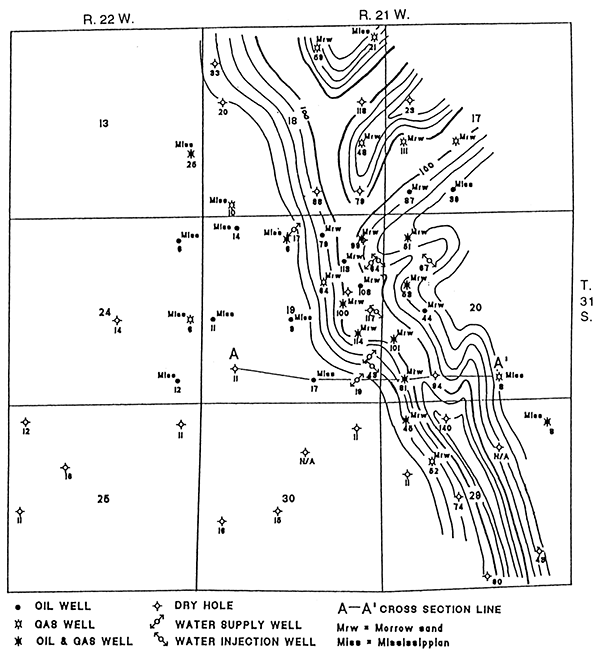
Encased within this interval, sandstones of variable lateral extent and thickness occur. The maximum sandstone thickness attained is about 40 ft (12 m) (fig. 6).
Figure 6--Isopach map, Morrow sand, contour interval = 20 ft (6 m).
At the base Inola (top Morrow shale) marker, structure is greatly subdued owing to the relatively level channel infilling (fig. 7). Some evidence of differential compaction of shale and sandstone material is suggested within the channel. At Lansing time (map not shown), little more than a nominal re-entrant of contours gives a hint of the structural sag over the channel.
Figure 7--Geologic structure, base Inola (top Morrow), contour interval = 20 ft (6 m).
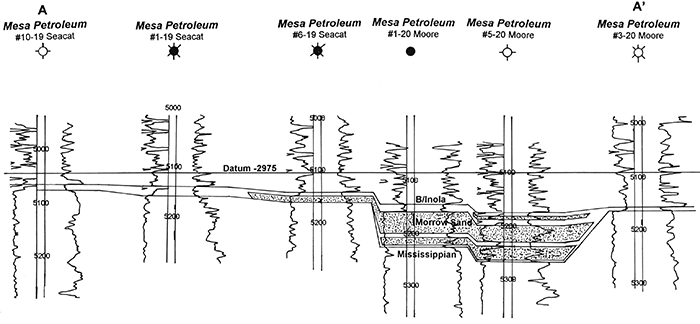
Structural log profile A-A' shows the morphology and infilling of the channel (fig. 8). The productive channel well in this cross section is the original Morrow "rediscovery." Note that at the west end of the cross section, the well with the highest Mississippian datum is not productive in any zone. Apparently, porosity/permeability are the predominant controls for Mississippian production.
Figure 8--Structural log cross section A-A'.
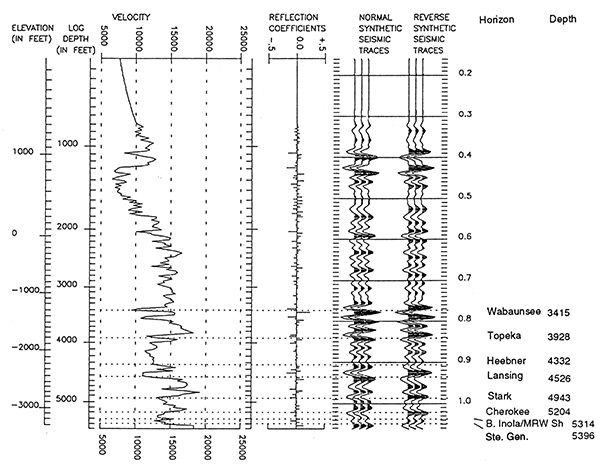
After the fact modeling was accomplished by digitizing sonic log data from a well which is representative of conditions in the vicinity of the seismic profile. A full-length synthetic seismogram for this well is given with horizon picks on fig. 9. This seismogram was generated using parameters designed to match the data as originally acquired: sample rate of 4 msec, frequency bandwidth 17-56 Hz.
Figure 9--Synthetic seismogram, Mesa Petroleum Moore 1-20, SW SW sec. 20, T. 31 S., R. 21 W. Filtered at 14-17/50-56 Hz.
An additional seismogram segment highlighting particularly the section from Cherokee through Mississippian was generated with sonic and density data, with identical filter and parameters as the full-length seismogram and is used as a basis for the simplified 44-trace model (fig. 10). The model illustrates in graphic detail the synthetic seismic response predicted when the scoured Mississippian surface has been filled with a maximum of 106 ft (32 m) of Morrow sediments. Model traces on the extreme left and right represent the reflection sequence predicted when only a thin veneer (8 ft, 2.4 m) of Morrow rests on the Mississippian. Upon comparing the model to actual processed results, one can see encouraging agreement and some moderate departures from actual data. One possible explanation for some of these deviations may be related to amplitude variation with offset (AVO) effects. The synthetic model was developed on the basis of "zero offset" conditions. The maximum offset utilized in processing this dataset was 5,720 ft (1,716 m).
Figure 10--Two-dimensional model derived from sonic and density logs, Mesa Petroleum Seacat 7-19, 1,900 ft (570 m) FSL and 510 ft (153 m) FEL, sec. 19, T. 31 S., R. 21 W. Maximum channel thickness = 106 ft (31 m); Morrow thickness outside channel = 8 ft (2.4 m).
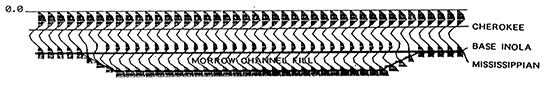
Whatever the case for relative deviations from theoretical models, this simplified model demonstrates our improving ability to extract challenging anomalies from such a dataset. Bear in mind also that modern data acquisition has a minimum 2-msec base sample rate as compared to the 4-msec rate of these data.
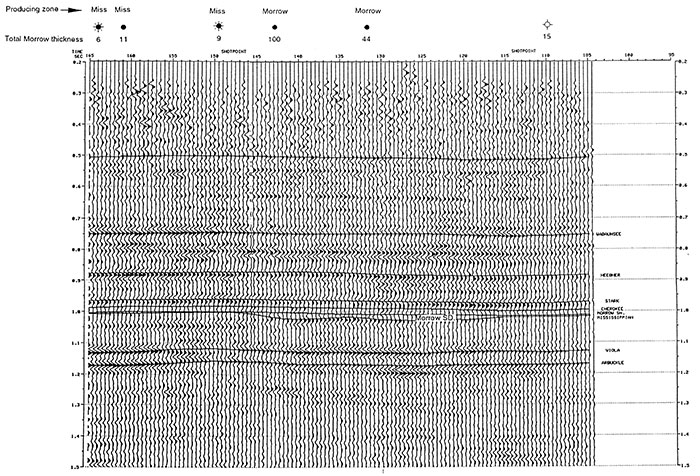
Representative uninterpreted and interpreted stacked seismic sections presented in figs. 11 and 12, respectively, illustrate the seismic signature of the Morrow channel sandstones at Lexington field. As mentioned previously, proprietary constraints prevent revealing the exact line location. The west end of the profile is left. Polarity of the data is normal. Several select wells have been judiciously tied to the seismic profile.
Figure 11--Representative seismic profile from study area. Group interval = shot interval = 220 ft (66 m). Nominal 24 fold. Datum = 2,900; velocity = 10,000 ft/sec,
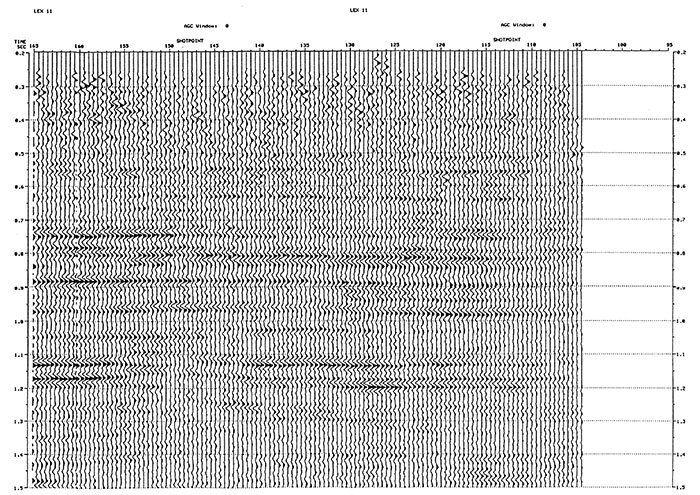
Figure 12--Annotated conventional stacked profile. Note amplitude buildup at approximately 1,025 msec, between stations 145-115.
By today's standard, the data were acquired using a relatively low-frequency input pilot of 17-56 Hz. In spite of this limitation, the seismic stratigraphic signature of the channel anomaly, while subtle at first look, becomes more discernible with successive passes of data analysis. Evidence corroborating the anomaly occurs as follows:
Figure 13--Instantaneous frequency display of previous conventional stacked data; note frequency anomalies especially between stations 142-135 and 130-124.
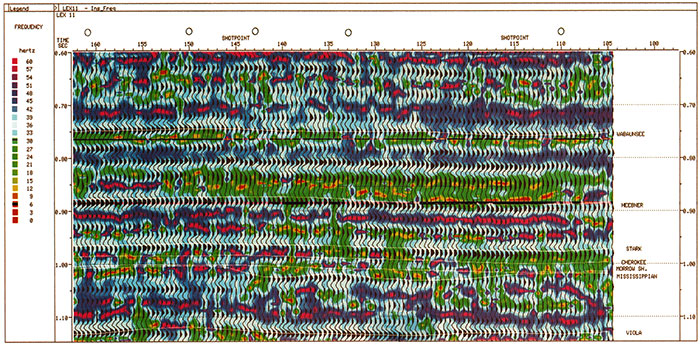
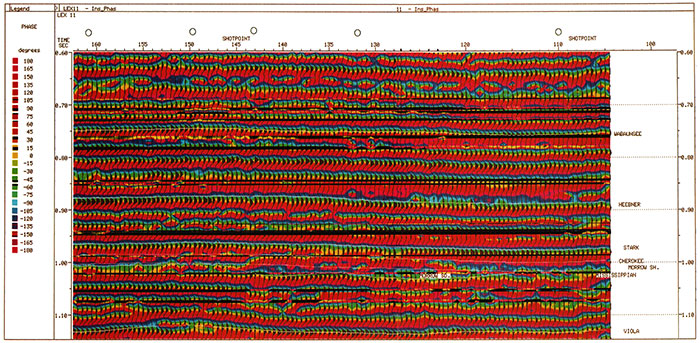
Figure 14--Instantaneous phase display; note anomalous character between stations 142-120.
As a final note concerning overall seismic response, note that the Viola event, occurring at about 1,130 msec, largely parallels the Mississippian surface, whereas Morrow and younger sediments show some sense of draping over channel infilling.
Data provided for review and examination in this study are valuable for several reasons: 1) the structural content of the reprocessed data holds a high level of integrity against actual well ties; 2) the stratigraphic content, while lacking modern resolution, is still of considerable value in relating to actual geology; and 3) calculation of instantaneous attributes also yields encouraging agreement to known anomalies.
The writers greatly appreciate the initial contribution and approval for data release by Mesa Petroleum, Amarillo, Texas. Later contribution of actual field tapes for reprocessing and workstation evaluation was approved by current data owners, Samson Resources, Tulsa, Oklahoma. Reprocessing was provided by Production Geophysical Services (PGS), Englewood, Colorado.
Emery, M., and Sutterlin, P. G., 1986, Characterization of a Morrowan sandstone reservoir, Lexington field, Clark County, Kansas: Shale Shaker, Oklahoma City Geological Society, v. 37, no. 2, p. 18-33 (also appears in the American Association of Petroleum Geologists, Treatise of Petroleum Geology, Atlas of Oil and Gas Fields, Stratigraphic Traps II)
Swanson, D. C., 1979, Deltaic deposits in the Pennsylvanian upper Morrow formation of the Anadarko basin; in, Pennsylvanian Sandstones of the Midcontinent, N. J. Hyne, ed.: Tulsa Geological Society, Special Publication No. 1, p. 115-168
Wilkins, G. C., 1985, Lexington field; in, Kansas Oil and Gas Fields, P. G. Gerlach and T. Hansen, eds.: Kansas Geological Society, v. V, p. 159-166
| Acquisition (Western Geophysical, June 1977) | |
|---|---|
| Source: | Vibroseis, four vibrators times 16 sweeps |
| Pilot: | 17-56 Hz, 7 sec |
| Sample rate: | 4 msec |
| VP interval: | 220 ft (66 m) |
| Group interval: | 220 ft (66 m) |
| Seismometers/group: | 36 |
| Spread: | Split |
| Near offset: | 660 ft (198 m) |
| Maximum offset: | 5,720 ft (1,716 m) |
| Filters: | out/out |
| Instruments: | DFS-3 |
| No. channels: | 48 |
| Nominal fold: | 24 |
| Processing (Production Geophysical Services, January 1992) |
|---|
|
Previous--Roland SE Field, Rush County || Next--Damme Field, Finney County
Kansas Geological Survey
Comments to webadmin@kgs.ku.edu
Web version placed online Sept. 9, 2015. Original publication date 1995.
URL=http://www.kgs.ku.edu/Publications/Bulletins/237/Richardson/index.html