Previous--Minneola Complex, Ford and Clark Counties || Next--Subtle Stratigraphic Trap, Lexington Field, Clark County
Balcron Oil
This article available as an Acrobat PDF file (5 Mb).
Roland SE field is located in the northwest portion of Rush County, Kansas (fig. 1). Although the field was discovered in 1968, it was not effectively developed until 1988. At the present time, there are 10 producing wells at Roland SE. Production is from the Cambrian-Ordovician Arbuckle Group with the exception of one well, Baldwin #1-36, which produces from the Pennsylvanian Lansing Group (fig. 2). Ultimate recovery at Roland SE is projected to be 444,000 BO, with the average well producing 44,000 BO.
Figure 1--Rush County Arbuckle production.
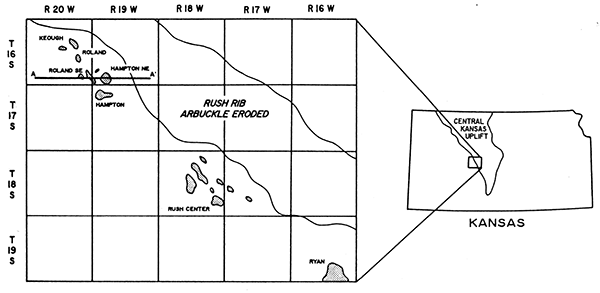
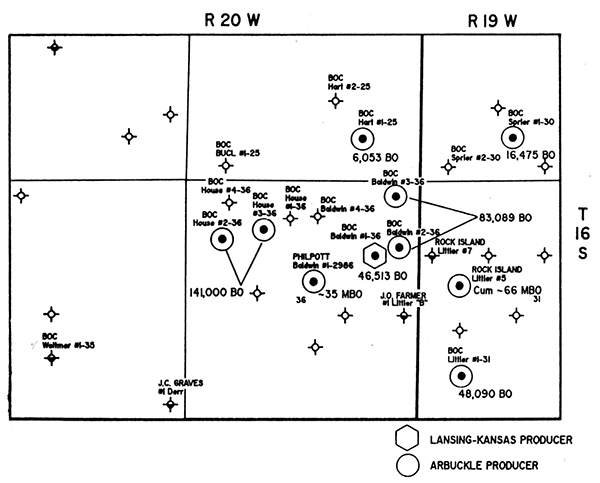
Figure 2--Production map, estimated ultimate recoveries.
The Arbuckle dolomite is an excellent reservoir at Roland SE field, as illustrated by 6 ft of Arbuckle core from the House #3-36. Measured porosities average 23.7% while the average permeability is 1,540.7 millidarcies.
In Rush County, oil is trapped within closed structures along the irregular Arbuckle subcrop, a major angular unconformity (fig. 3). Rush County is located on the western flank of the Central Kansas uplift. The uplift comprises several anticlines or horsts that were created by uplift of Precambrian basement granites and quartzites during late Mississippian time.
Figure 3--Cross section A-A'; not to scale.
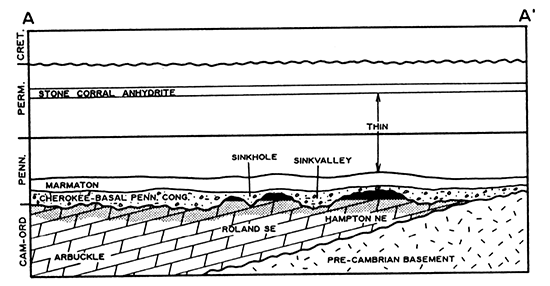
Rush Rib is the local northwest-southeast-trending structure that sets up the Arbuckle play in Rush County. Arbuckle beds are truncated and overlain by Pennsylvanian rocks along each flank. Arbuckle rocks are absent on the crest of the rib, where Precambrian basement rocks are in direct contact with Pennsylvanian strata (fig. 3).
During pre-Pennsylvanian time the uplifted rib was subject to extensive karstification. The karst topography resulted in a series of paleotopographic closed structures that are the main target for oil exploration.
These ancient hills are pitted with various sized sinkholes and bisected by larger sink valleys. Deposition of the overlying Pennsylvanian Cherokee Group followed. The Cherokee is a conglomerate of varicolored shales and chert that filled in the sink features and provide the impermeable cap rock for the Arbuckle reservoirs.
Due to differential compaction, Pennsylvanian and Permian beds are structurally closed across paleotopographic Arbuckle highs (fig. 3). Most of this compaction-related structure occurs within the Marmaton and Cherokee intervals. However, sizable Arbuckle hills affect strata as high as the Permian Stone Corral anhydrite. Many Pennsylvanian Lansing-Kansas City reservoirs owe their structure to this compaction process. Larger Arbuckle structures are identifiable as thins with isopach mapping of the Stone Corral anhydrite to the Marmaton interval (fig. 3).
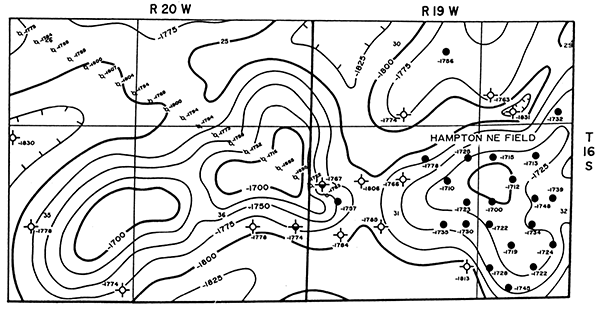
Production at Roland SE was initiated upon the completion of the Rock Island Oil and Refining Company #5 Littler well (SE SW NW sec. 31, T. 16 S., R. 19 W). Subsequent unsuccessful tests to the north and west seemed to indicate that the well was associated with production at Hampton NE field. An Arbuckle structure was inferred just west of the Littler #5 well (fig. 4). The prospect was supported by the presence of two nearby show wells, the Littler #7 (NW SW NW sec. 31, T. 16 S., R. 19 W) and the #1 Littler "B" (NE NE SE sec. 36, T. 16 S., R. 20 W), both of which recovered free oil from drill-stem tests within the Arbuckle (fig. 2).
Figure 4--Pre-discovery Arbuckle structure, May 1988; contour interval = 25 ft (7.6 m).
In March of 1988, Balcron Oil drilled the #1-36 Baldwin (NW SE NE sec. 36, T. 16 S., R. 20 W.). Although the Arbuckle was structurally low and nonproductive, pay was established within the Lansing. No shows were encountered in the Arbuckle, but a nearby structure seemed likely based on presence of closure at the Lansing horizon. Subsequent drilling of the #2-36 Baldwin, just east of the #1-36 Baldwin, resulted in the discovery of additional Arbuckle production at Roland SE.
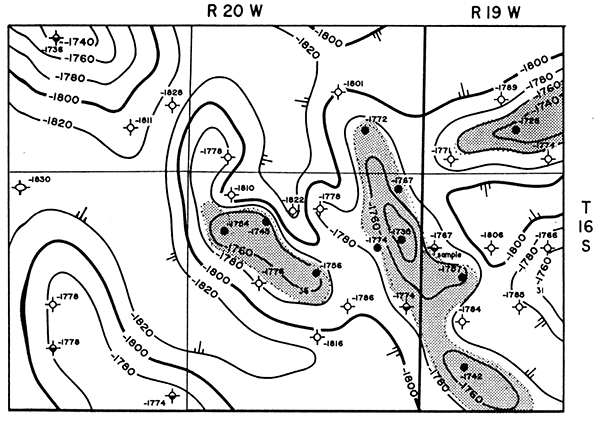
Figure 5 represents the updated version of the Arbuckle structure. Roland SE, as interpreted, comprises three separate structural reservoirs created by the very irregular Arbuckle paleotopography. Although the three distinct pools are structurally separated, they share a common oil-water contact at -1,774 ft.
Figure 5--Arbuckle structure; contour interval = 20 ft.
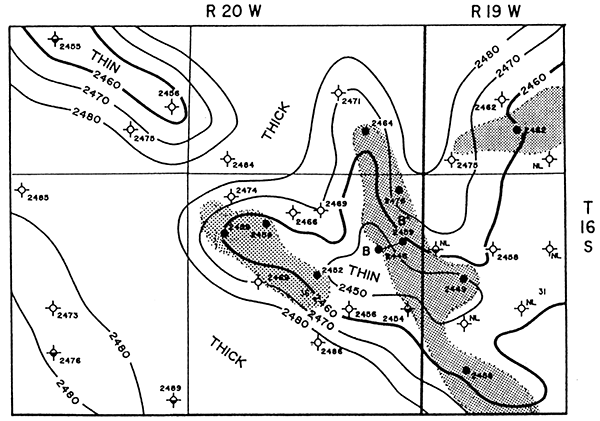
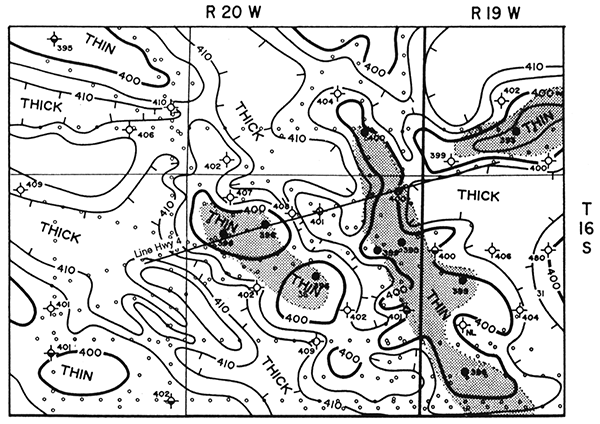
The isopach map of the Stone Corral anhydrite-Marmaton interval (fig. 6) illustrates a general thin, due to compaction, across the Roland SE feature. The isopach thin corroborates with the deeper Arbuckle structure, but fails to identify the dissected Arbuckle horizon. In retrospect, the anhydrite-Marmaton isopach appears to be a very useful tool for exploration, both geologically and seismically, but has limited use when determining development locations.
Figure 6--Isopach map, Stone Corral-Marmaton; contour interval = 10 ft.
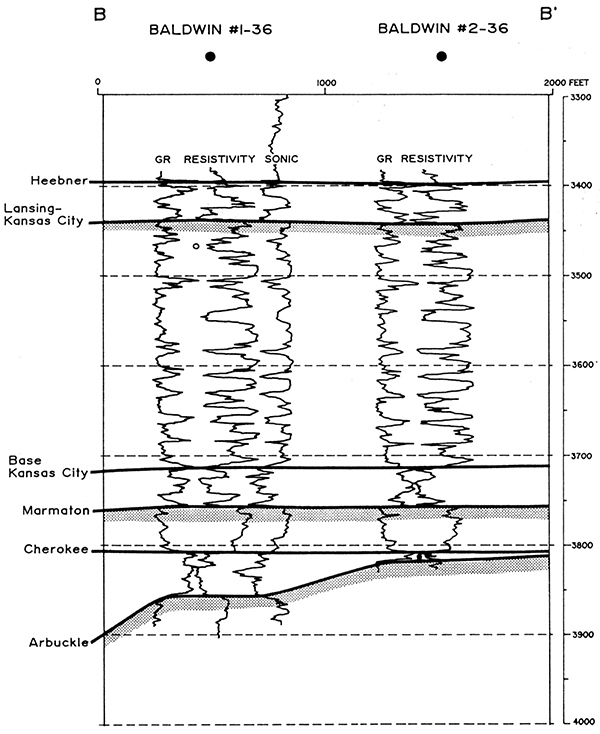
Cross section B-B' (fig. 7) shows the off-structure thickening in the Cherokee conglomerate that has filled in the Arbuckle low. An inverse relationship is seen between the Cherokee thickness and the anhydrite-Marmaton isopach values of the two Baldwin wells. This is attributed to the amount of chert in the conglomerate. The author's experience has been that, in many cases, Arbuckle sinkholes are filled with chert-rich conglomerates that are less susceptible to compaction. In this manner, local Arbuckle lows can be masked within a relatively larger Arbuckle structure.
Figure 7--Type log cross section.
After the Baldwin #1-36 wildcat was drilled, the decision was made to use more detailed CDP seismic control to position wells. Seismic data were acquired in three phases and resulted in an irregular seismic grid that covered nearly every selected drill site. All data are 15-fold and were acquired using a Vibroseis source and 60-channel recording equipment. Vibrator source points were spaced at 165 ft (50 m) with geophone groups at 82.5 ft (25 m). Data were shot using a symmetrical split spread with a maximum spread length of 2,640 ft (805 m). Vibrator sweeps ranged from 14 to 96 Hz over 12 secs.
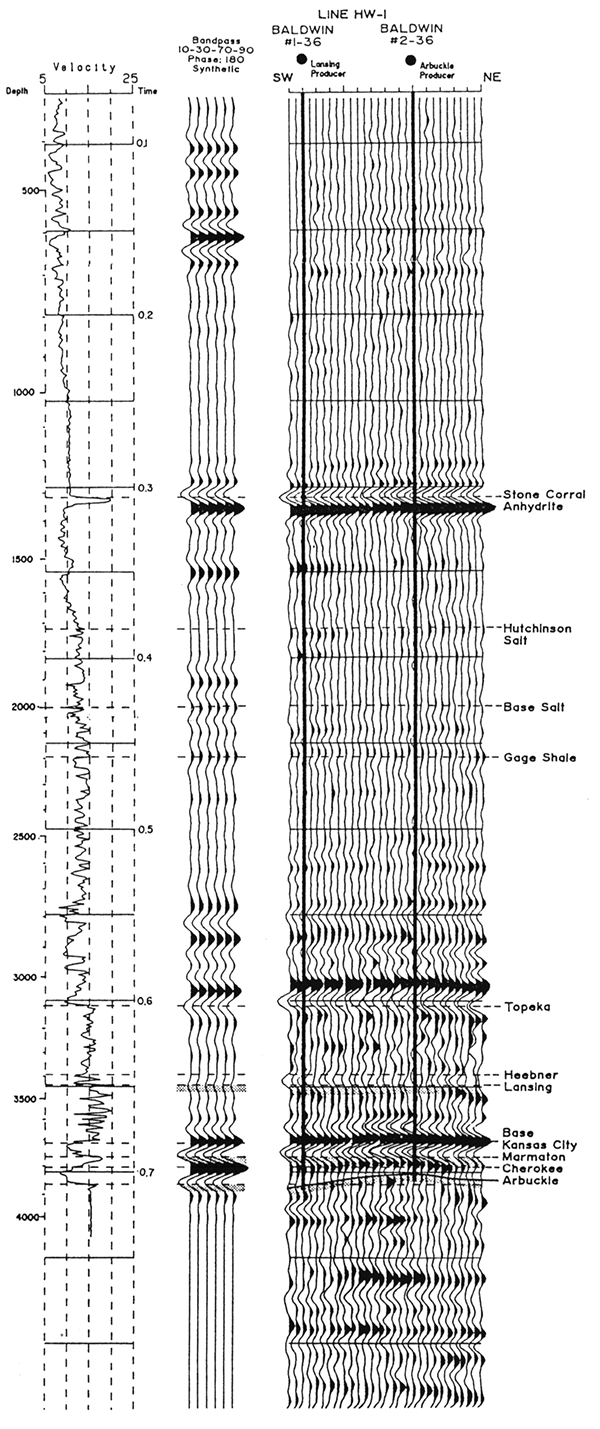
Seismic-record quality is generally excellent in the area. Several strong seismic horizons exist, allowing the seismic data to be confidently tied to sonic log synthetic seismograms. Figure 8 shows Line HW-1 correlated to the synthetic seismogram from the Baldwin #1-36 well. The strong reflectors are the Stone Corral Anhydrite, Topeka Limestone, base Kansas City, and Marmaton. The Lansing and Arbuckle horizons are generally seismically mappable but are manifested as much weaker reflections.
Figure 8--Line HW-1 correlated to the Baldwin #1-36 synthetic seismogram (reverse polarity).
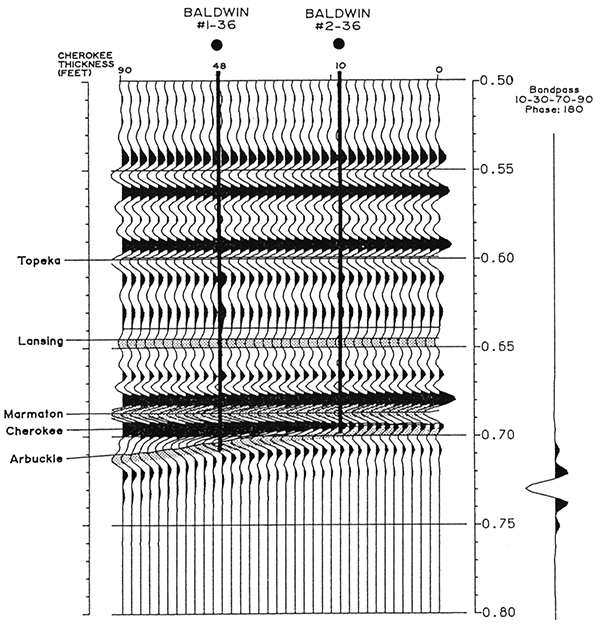
Resolution of the Arbuckle reflection is dependent on the Cherokee being sufficiently thick to allow visual separation from the higher amplitude Marmaton reflector. Figure 9 illustrates the effect of Cherokee thickness on Arbuckle resolution and the amplitude of the Cherokee "peak" (on reverse polarity data). Intervals thicker than 45 ft (13 m) show complete resolution with no interference between the Marmaton and the Arbuckle. Partial resolution occurs between 45 ft and 10 ft (13 m and 3 m) where the Arbuckle trough does not track the horizon top exactly but the Cherokee peak shows diminishing amplitude.
Figure 9--Seismic model with varying Cherokee thickness.
An additional limitation to the resolution of Arbuckle and Cherokee horizons occurs at those sites where the sinkhole width is narrow. The Fresnel zone, which contributes to a reflection, calculates to approximately 700 ft (213 m) for depths at Roland SE. For sinkholes less than 700 ft (213 m) wide, interference from the adjacent terrain prevents the observed seismic character from matching the character modeled from sonic logs.
Primary mapping methods include isochron maps for the anhydrite to Marmaton and the anhydrite to Arbuckle intervals, and seismic-character analysis for the Cherokee "peak." Isochron maps are preferred rather than time-structure maps in order to avoid artificial highs created from near-surface velocity changes. Exaggerated seismic profiles of interpreted horizons are used to provide a convenient display of subtle isochron thinning.
The Stone Corral anhydrite-Arbuckle isochron map (fig. 10) is believed to be the most reasonable proxy for Arbuckle structure, though it is limited in areas where the Cherokee is thin. The map identifies three closed thin trends which correspond to the producing structures. Each is approximately 0.005 secs thinner than the closest dry hole and 0.010 secs thinner than adjacent lows.
Figure 10--Isochron map, Stone Corral anhydrite-Arbuckle; contour interval = 5 msec, interval velocity = 6.35 ft/msec.
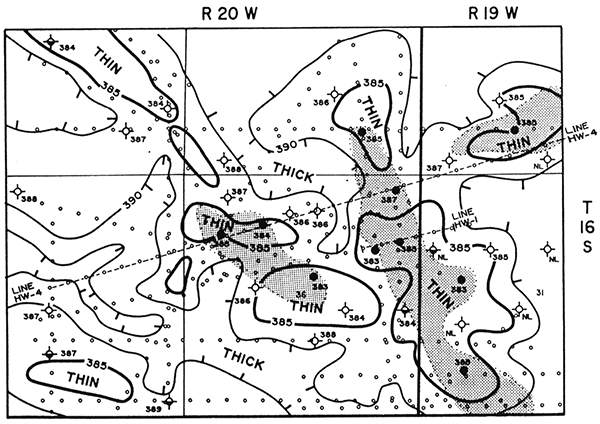
Since the Arbuckle reflection is not entirely reliable in resolving Arbuckle structure where the Cherokee is thin, the Stone Corral anhydrite-Marmaton isochron map (fig. 11) is created as a check on the Arbuckle interpretation. Though this interval in fig. 11 shows considerably less thinning than the anhydrite-Arbuckle map (fig. 10), the reflection strength of the Marmaton allows for more confidence in the data. The closed thins bounded by the 0.385 contour generally coincide with the producing area, but do not define the flanks of the structures as clearly. Relief measures 0.003 secs or less above edge wells, and 0.005 secs above adjacent lows.
Figure 11--Isochron map, Stone Corral anhydrite-Marmaton; contour interval = 5 msec, interval velocity = 6.4 ft/msec.
Because the Baldwin #1-36 appeared to be a near miss in the Arbuckle reservoir, Line HW-1 was acquired to look for a nearby location that would be structurally higher at the Arbuckle. After correlating the seismic data to the well log synthetic, it was apparent that a better location was present only 600 ft (183 m) to the east where the Arbuckle event gained 6 msecs of time-structure relief. Additional positive indicators included 2 msecs of thinning in the anhydrite-Marmaton interval and a slight decrease in amplitude of the Cherokee peak. The ensuing Baldwin #2-36 was the Arbuckle discovery well, 30 ft (9.1 m) higher at the Arbuckle level and 39 ft (11.9 m) thinner in the Cherokee relative to #1-36.
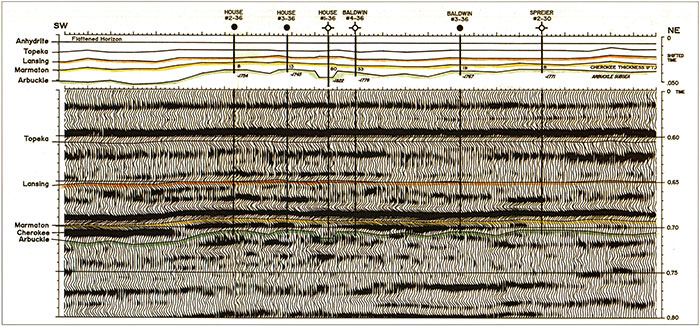
After the Baldwin #2-36 success, the seismic criteria for selecting drill sites were established and an additional grid of seismic data was acquired. Line HW-4 best characterizes the field because seven wells were drilled on or close to the line. Figure 11 shows this line and a vertically exaggerated display of the interpretation to illustrate interval thinning across the line. The western half of Line HW-4 clearly exhibits all of the seismic characteristics established by the Baldwin case history and seismic modeling. The interpreted time section shows that the producing House #2-36 and #3-36 are located on Marmaton and Arbuckle thins. Additionally, the Cherokee peak is significantly lower amplitude at the House wells than the area to the southwest.
The first development location drilled was the House #1-36, chosen because the Cherokee peak dims to near zero amplitude and the anhydrite-Arbuckle interval mapped as the thinnest location in the field. Although this location looked extremely safe based on seismic character, the well ran extremely low in the Arbuckle and encountered 80 ft of the Cherokee. The predominance of chert in the Cherokee indicated that a sinkhole was encountered rather than a regional Arbuckle low. A re-evaluation of the seismic line determined that the sinkhole was approximately 400 ft (122 m) wide and that good locations existed to the west. The apparent seismic character for the sinkhole is only a few traces wide and is substantially different from the character over the rest of the structure.
The House #2-36 was the second development well drilled, and 18 ft (5.5 m) of Cherokee was encountered over a productive Arbuckle structure. Similarity of the seismic character and interval thinning prompted drilling of the House #3-36 producer. This well was drilled only 580 ft (177 m) from the House #1-36 and ran 77 ft (23.5 m) higher on the Arbuckle structure. The area east of the sinkhole was tested by the Baldwin #4-36. The Baldwin #4-36 ran 44 ft (13.4 m) high relative to the House #1-36, but was not high enough to produce.
Regional thinning of the Cherokee to the east of the Baldwin #4-36 results in poor resolution of the Arbuckle reflection at the Spreier locations in sec. 30. The #2-30 has only 8 ft (2.4 m) of Cherokee, yet is too low to produce in the Arbuckle. Since the Arbuckle reflection is unresolvable in sec. 30, the anhydrite-Marmaton isochron is the only useful seismic map in this area.
The development experience at Roland SE showed that seismic imaging of the dissected Arbuckle structure was reasonably successful. Limitations include the sinkholes which are narrower than a Fresnel zone and mapping edge locations where the relief is only 1-3 msecs over nearby dry holes. Although Balcron Oil's development success rate was only 50% using the seismic method, none of the seven Arbuckle wells would likely have been drilled without acquiring the CDP seismic grid. The seismic dollars spent on the project total $120,000 for 30.4 mi (48.9 km) of data. This represents $0.41/bbl for the 294,000 bbls of estimated Arbuckle reserves. The total drilling and seismic cost per barrel is $3.74.
Figure 12--Line HW-4 and interpreted time section (flattened on anhydrite).
Roland SE field is a cluster of three structurally trapped Arbuckle reservoirs. The structural configuration is largely formed by remnant paleotopographic features on a karsted erosional surface including narrow sinkholes, wider erosional valleys, and intervening highs with relatively flat tops and sharp, irregular edges. The remnant topography was filled with the deposition of the Cherokee red shales and chert conglomerates, which provided a seal for the underlying porous carbonates. Differential compaction of the shales with burial resulted in isopach thins overlying Arbuckle highs. The seismic expression of the Arbuckle highs are a lower amplitude Cherokee reflection and isochron thins in the Stone Corral anhydrite-Marmaton and Stone Corral anhydrite-Arbuckle intervals. Since the structures are narrow and highly irregular, a detailed seismic grid was cost effective in minimizing dry holes and recognizing drill sites. After drilling an unsuccessful Arbuckle wildcat, the CDP seismic method allowed Balcron Oil to find seven Arbuckle wells not likely to have been discovered otherwise.
Previous--Minneola Complex, Ford and Clark Counties || Next--Subtle Stratigraphic Trap, Lexington Field, Clark County
Kansas Geological Survey
Comments to webadmin@kgs.ku.edu
Web version placed online Sept. 9, 2015. Original publication date 1995.
URL=http://www.kgs.ku.edu/Publications/Bulletins/237/Ballard/index.html