Previous--Subtle Stratigraphic Trap, Lexington Field, Clark County || Next--Stockholm SW Field, Greeley/Wallace Counties
1Canyon Energy, Inc., and 2Texaco USA
This article available as an Acrobat PDF file (11 Mb).
Damme field, located in Finney County, Kansas, produces oil from Mississippian and Pennsylvanian carbonates and sandstones. Trapping is due to both structure and stratigraphy. First discovered in 1951, this field has produced 15 million barrels of oil and is still producing today.
The structural nature of Damme field is readily observed on CDP-seismic data acquired over the field. The erosional topography on the Mississippian (pre-Pennsylvanian) unconformity reveals a fault-bounded structure, and thick Morrow deposits fill in the surrounding paleotopographic lows. The influence of basement block faulting is suggested by the seismic data as well as by aeromagnetic data in the area. The structural relief is rapidly attenuated in the overlying Pennsylvanian section, and the buried paleotopography is described very well by mapping of the Permian to Mississippian interval.
This paper describes the seismic expression of Damme field with modern CDP seismic, and contrasts this expression with the predicted model response generated from well-log information in the field. The basement influence is also examined as described by published aeromagnetics and Precambrian structure maps.
The causal relationship between Mississippian and Morrowan paleotopography and sedimentology, basement structure, and their corresponding seismic expression has long been of critical importance in the successful exploration beneath the Hugoton embayment of southwest Kansas. Unfortunately, because of rapid lithology changes in the Permian and Pennsylvanian sections and the frequent occurrence of near-surface velocity anomalies, the direct interpretation of these relationships from seismic data has often proved difficult. This paper will examine seismic data over a producing field in the area, Damme field, and demonstrate how interval-mapping and forward-modeling techniques can aid in the seismic interpretation. Regional aeromagnetic data are also considered in the interpretation.
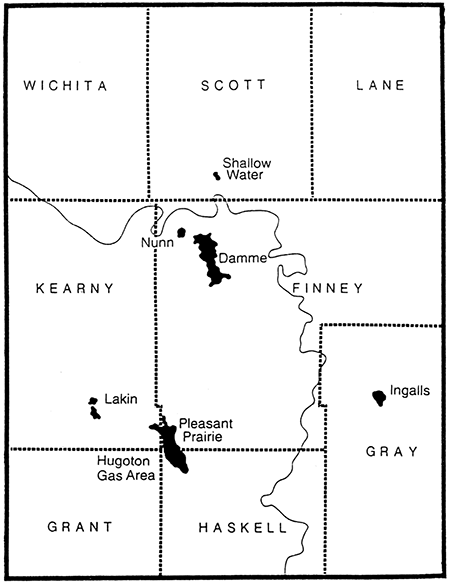
Damme field is located in T. 21 and 22 S., R. 33 W, Finney County, Kansas. It is one of a series of northwest-southeast-trending fields in the northeastern portion of the Hugoton embayment (fig. 1), which produce primarily from Mississippian St. Louis oolitic shoals associated with present-day Mississippian structures. Other fields in the area include Pleasant Prairie (Finney and Haskell counties), Ingalls (Gray County), Nunn (Finney County), Lakin (Kearny County), and Shallow Water (Scott County).
Figure 1--Regional index map showing the location of Damme field and other key Mississippian fields in the area.
Damme field has produced over 15 million bbls of oil from 148 wells since its discovery in 1951. Producing zones include the Pennsylvanian Ft. Scott, Marmaton, and Morrow formations, in addition to the Mississippian St. Louis formation. The trapping mechanism has been described as combination structural and stratigraphic (Schmidlapp, 1959).
The Damme field discovery well, the #1 Damme, was drilled by W L. Hartman and was based on regional subsurface geology (Schmidlapp, 1959). The #1 Damme (SE SE NW sec. 21, T. 22 S., R. 33 W) was completed in April 1951, for an initial reported production potential of 1795 BOPD out of the Mississippian St. Louis. The Finnup field was discovered 2 mi (3.2 km), southeast of this well with the drilling of the W L. Hartman-Finnup #1 (NE NE NW sec. 34, T. 22 S., R. 33 W) in August 1953. The Finnup #1 had a reported initial production potential of 434 BOPD out of the St. Louis.
Development of this area revealed that the original Damme and Finnup fields were part of the same anticline that makes up the Damme field as seen today. Subsequent drilling established production in the Morrow sandstones, and in the Marmaton and Ft. Scott carbonates.
The Damme field area was part of a relatively stable platform throughout much of the Paleozoic. The region was part of the Southwest Kansas basin during late Devonian-early Mississippian time, with the structurally positive ancestral Central Kansas uplift removed far to the northeast (Merriam, 1963). This area developed into the Hugoton embayment of the Anadarko basin in later Mississippian time. This embayment, bounded to the west and north by the Las Animas Arch-Sierra Grande uplift, and to the east by the Central Kansas uplift, opens southward from the Damme field area into a slightly deeper, more open-marine platform or shelf as evidenced by thickening of the strata into the deep Hugoton area (Handford, 1988).
The Central Kansas uplift continued to be a positive feature while the Hugoton subsided during a major change in structural development near the end of Mississippian time (Merriam, 1963). A pre-Pennsylvanian unconformity developed as the seas regressed, creating an erosional surface with sufficient paleotopography to control much of the oil and gas production across Kansas. This unconformity has been a primary mapping objective for most seismic work in Kansas. In the Damme field area, the top of the Mississippian is the pre-Pennsylvanian unconformity, and throughout this discussion the two will be used synonymously. This is not the case over the Central Kansas uplift, however, where the Mississippian is completely eroded away placing Ordovician rocks at the unconformity.
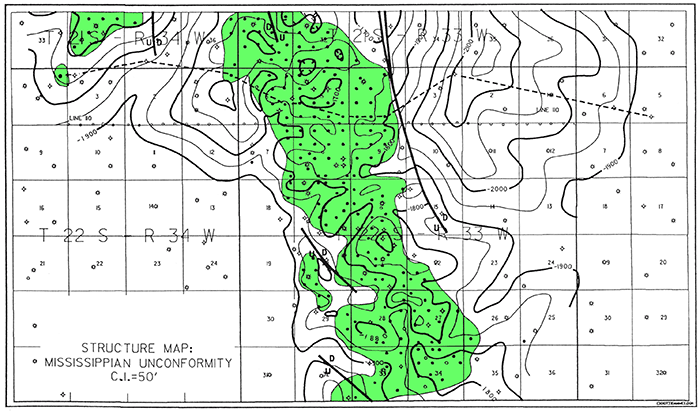
The present day Mississippian structure of Damme field is a northwest-southeast-trending, southward-plunging anticline (fig. 2). This long, narrow feature is faulted on the east and is similar to other southward-plunging anticlines around the embayment on which Mississippian production is found, such as Pleasant Prairie and Nunn fields (Merriam, 1963). There is over 100 ft (30 m) of relief across the anticline in the east-west direction and up to 75 ft (23 m) of closure formed in the northwest-southeast direction down the axis of the anticline.
Figure 2--Structure on the Mississippian (pre-Pennsylvanian) unconformity at Damme field. Green shading indicates the productive area of the field.
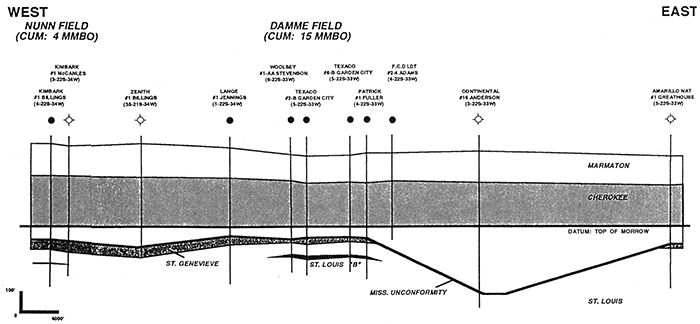
The paleotopographic nature of the Damme field structure is revealed by mapping the thickness of the Lower Pennsylvanian Morrow formation (fig. 3), as well as the interval from the Permian Stone Corral (also referred to as the Cimarron) anhydrite to the Mississippian (fig. 4). The Morrow formation consists of sandstones and shales deposited on the unconformity and filling in the topography. This was ultimately transgressed by Pennsylvanian seas, which deposited shelf carbonates over a long period of relative tectonic inactivity. The Morrow deposits thicken by over 50 ft (15 m) to the west of the anticline and by over 200 ft (61 m) on the faulted east side (fig. 5), revealing the magnitude of the paleotopography. The Morrow channels run in several different directions around the paleotopographic high. The Stone Corral to Mississippian interval likewise shows 50 ft (15 m) of relief over the anticline, generally mirroring the buried topography.
Figure 3--Isopach of the Pennsylvanian Morrow Formation at Damme field.
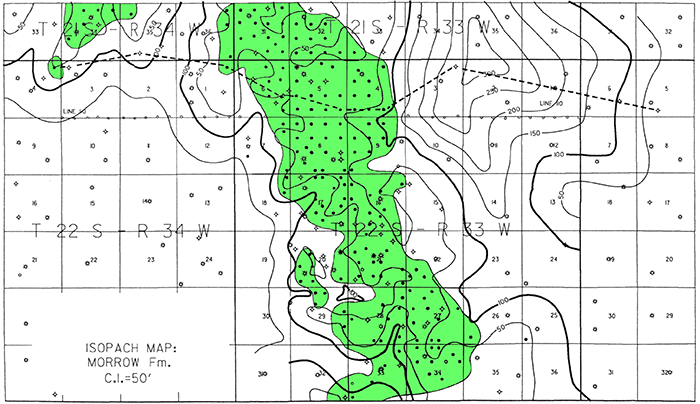
Figure 4--Isopach from the Permian Stone Corral (Cimarron) anhydrite to the Mississippian unconformity.
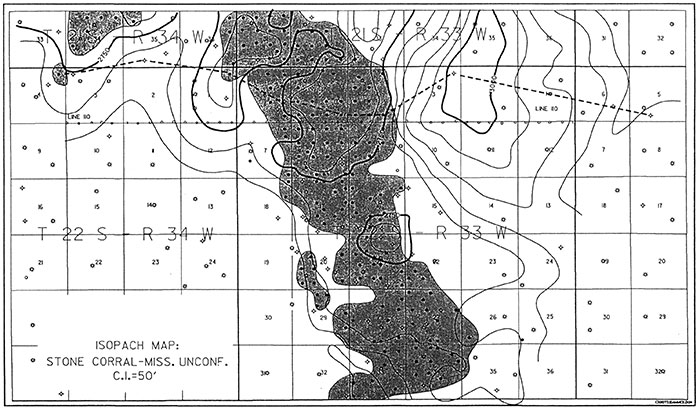
Figure 5--East-west stratigraphic cross section across Damme field. (Location shown as blue dashed line on figs. 2, 3, 4, and 12.)
Much of North America during Mississippian time was covered by epeiric seas which deposited widespread shallow-marine limestones (Handford, 1988). Oolitic shoals accumulated on the ramps, shelves, and rimmed edges of these carbonate platforms. The St. Louis oolitic grainstones at Damme field, as well as those of other major St. Louis producing fields in the Hugoton embayment, trend northwest-southeast in a direction which most probably parallels depositional strike. They are interpreted to have been deposited on a shallow-marine shelf. The St. Louis reservoirs at Damme field represent a grainstone-shoal environment which built up over a muddy open-marine sea floor (Handford, 1988).
The Morrowan sandstone reservoirs at Damme field developed as a result of the fluvial and estuarine processes which occurred in response to the regression of the Mississippian sea from the area. These sandstone reservoirs tend to occur on the flanks of the Mississippian paleotopographic highs and probably represent deposition consistent with a valley-fill model.
The Pennsylvanian Marmaton and Ft. Scott reservoirs developed as the Pennsylvanian seas transgressed the buried topography. These carbonates typically represent algal mound/oolitic shoal build-ups in a restricted shelf environment and their porosity development seems to correlate directly to the structure at Damme field.
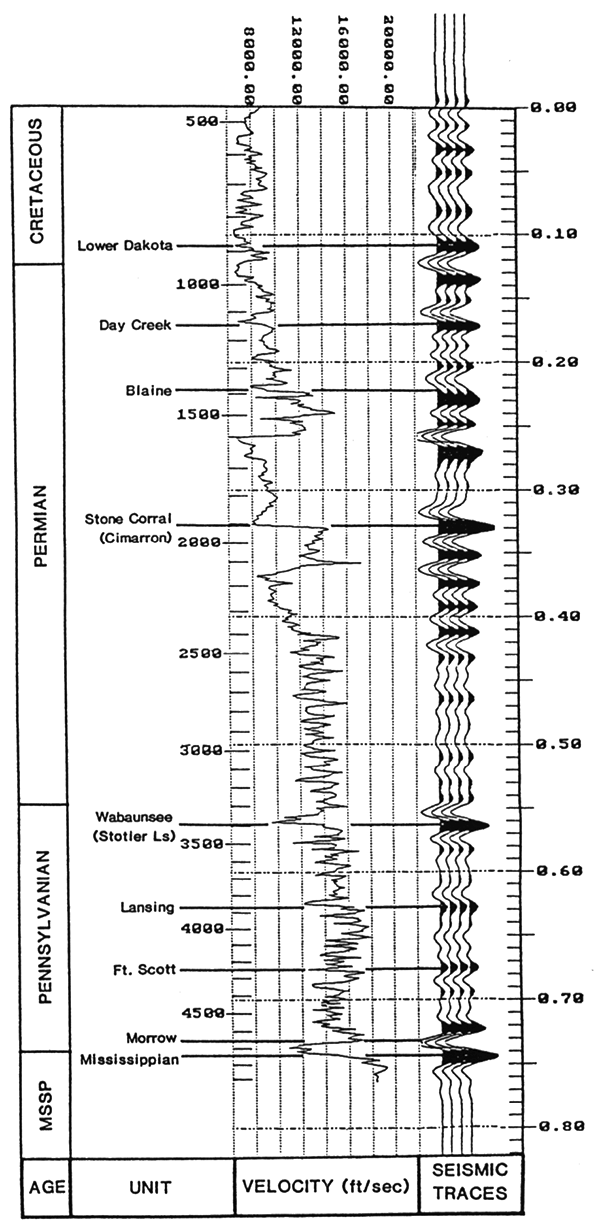
A number of geologic formations in the Damme field area are good seismic reflecting events and are regionally mappable with seismic data (fig. 6). These include the Permian Stone Corral (Cimarron), the Pennsylvanian Wabaunsee (Stotler limestone), Lansing, Ft. Scott, and Morrow, and of particular importance the top of the Mississsippian unconformity.
Figure 6--Typical seismic response of the geologic section in the Damme field area. Synthetic traces generated with a 10-20-50-70 Hz zero-phase wavelet.
Cyclic carbonate deposition continued into the Permian until the area became increasingly more restricted, leading to the widespread deposition of the Cimarron (Stone Corral) anhydrite. The net effect of this depositional history was to infill and attenuate, if not completely mask, the buried structures on the pre-Pennsylvanian unconformity. A comparison of regional maps constructed on top of the Mississippian rocks with maps on the Pennsylvanian Lansing and Permian Stone Corral formations illustrates this dramatically in the Damme field area (Merriam, 1963). As a consequence, a common exploration approach to using seismic data in Kansas is to construct interval, or isochron, maps from the Stone Corral to Mississippian, or an upper Pennsylvanian formation to the Mississippian to identify the buried erosional topography. The identification of paleostructures as well as paleodrainage patterns on this surface is important in the exploration of western Kansas.
From a seismic perspective, interval mapping is not only a logical mapping approach but a necessary alternative to time structure mapping in Kansas. While the direct mapping of the pre-Pennsylvanian unconformity using time structure would be desirable, the amount of structural time relief is on the same order as uncertainties in the travel times due to varying near-surface velocities. Interval velocities at depth, such as from the Stone Corral to the Mississippian, tend to be more stable and do not display the significant lateral variations typical of the near-surface velocities. Consequently, interval time maps from the Stone Corral or upper Pennsylvanian to the Mississippian tend to be more reliable and are consistent with the geologic model of buried prePennsylvanian structures.
The nature of the buried paleotopography and the thickening of the Morrow section is readily apparent off the crest of the paleostructure (fig. 5), especially in the drainage to the east. The rapid attenuation of structure in the overlying section is illustrated as the Marmaton section shows only slight thickening off the crest.
Seismic modeling was accomplished by first creating an interpolated log cross section using sonic logs across the field (fig. 7). Unfortunately, this section does not exactly parallel the geologic cross section (fig. 5), but was constructed to illustrate the same type of observed paleotopography. The input section was flattened on the upper Pennsylvanian Wabaunsee (Stotler limestone), and only the lower portion is shown in order to focus on the Mississippian. The modeled seismic response (fig. 8) was generated using a zero-phase bandpass-filtered wavelet of 10-20-50-70 Hz. This section is also flattened on the Wabaunsee to illustrate the nature of the paleotopography. The Mississippian surface shows the most dramatic relief. The thickness of the overlying Morrow reflects the paleotopography, thinning to less than 50 ft (15 m) over the crest of the paleostructure and thickening off on the flank. The seismic model shows an amplitude loss of the Morrow event as it thins over the crest of the anticline. The marked north-south drainage observed east of the field (figs. 2 and 3), where the Morrow thickens to over 250 ft (76 m), is the most striking feature on the model. The paleostructural time relief (two-way) from the Wabaunsee to Mississippian is approximately 15 msec from the crest to the west flank, or about 112 ft (34 m) at an interval velocity of 15,000 ft/sec (4,545 m/sec) suggested from sonic log velocities. The relief into the deep east-bounding drainage is over 30 msec.
Figure 7--East-west stratigraphic cross section of interpolated sonic log traces constructed across Damme field. Used as input for seismic model of fig. 8. (Only lower portion of section is shown to focus on Mississippian.)
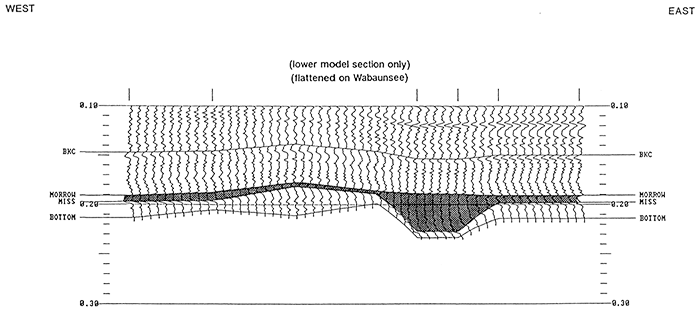
Figure 8--Seismic model of Damme field generated from input log section of fig. 7 by convolving with a 10-20-50-70 Hz zero-phase wavelet.
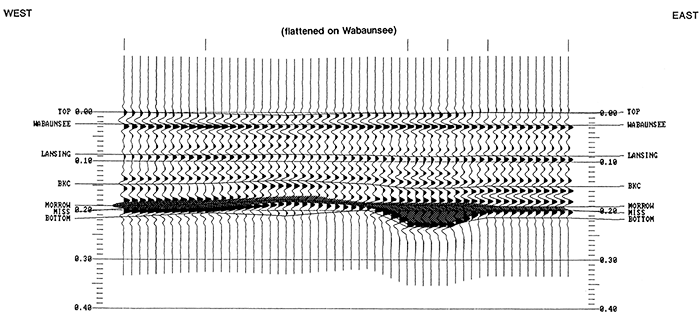
Most of the compensation of the paleotopography on the Mississippian is taken up in the Morrow section, though some relief is still apparent at the base of the Kansas City (BKC). Any indication of structural relief is very subtle at the Lansing event.
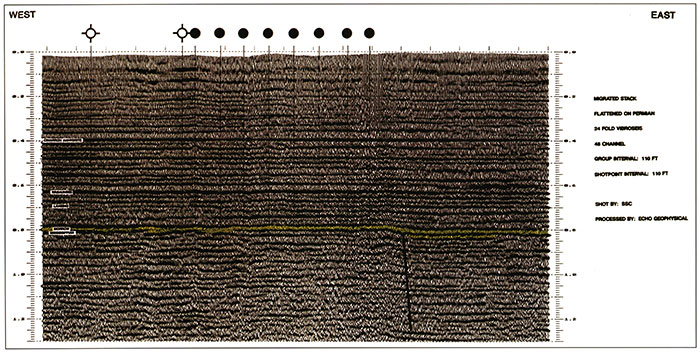
A 24-fold CDP seismic line, line 110 (figs. 2-4), oriented east-west across Damme field, was utilized in examining the seismic response of the field. These data were acquired in 1980 using a vibroseis source, 48-channel recording, and a group and shotpoint interval of 110 ft (33 m).
The data were reprocessed in 1991 in an attempt to extract the maximum amount of stratigraphic information, especially with respect to Mississippian St. Louis zones. While the reprocessing improved the data resolution markedly from original versions, the data ultimately were only suitable for interval mapping to reconstruct the Mississippian paleotopography. Changes in the Morrow section thickness were also apparent.
In order to facilitate an examination of the buried Mississippian paleotopography, Line 110 was flattened on the Cimarron (Stone Corral) anhydrite (fig. 9). The Cimarron anhydrite, Wabaunsee, Lansing, Morrow, and Mississippian horizons are indicated on the section. The Morrow section has been highlighted to accentuate the topography on the Mississippian.
Figure 9--East-west seismic llne 110 across Damme field, flattened on the Permian Cimarron (Stone Corral) anhydrite. Morrow formation is highlighted to accentuate the Mississippian unconformity.
As predicted by the model study, the most striking feature on the section is the relief on the Mississippian and the corresponding thickness changes in the Morrow. From the crest of the structure to the west there is approximately 10-12 msec of time relief on the Mississippian. To the east, the deep drainage is observed where the Morrow thickens dramatically to over 250 ft (76 m).
The expression of the Mississippian paleostructure is attenuated in the overlying geologic section. Subtle relief on the Wabaunsee is observed on Line 110 across the top of Damme field, and relief is still subtle at the Lansing horizon. The Lansing to Morrow interval, inclusive of the Marmaton, is observed to thicken off the crest of the Mississippian paleostructure.
A detailed display was extracted from the full section of Line 110 and plotted to approximately the same scale as the seismic model (fig. 10). This portion of Line 110 was similarly flattened on the Wabaunsee. Only every other trace was plotted to make the horizontal scaling and resolution comparable to the model traces for the purposes of analysis. The time relief on the Mississippian from the crest of the paleostructure to the west flank is about 10 msec. The amplitude loss of the Morrow event observed on the model as it thins across the paleostructure is not as dramatic on the seismic data of Line 110. One potential difference is due to the fact that the seismic model is not constructed from exactly the same portion of the field crossed by Line 110.
Figure 10--Portion of seismlc line 110 replotted and flattened on the Pennsylvanian Wabaunsee (Stotler Limestone) for comparison with seismic model of fig. 8.
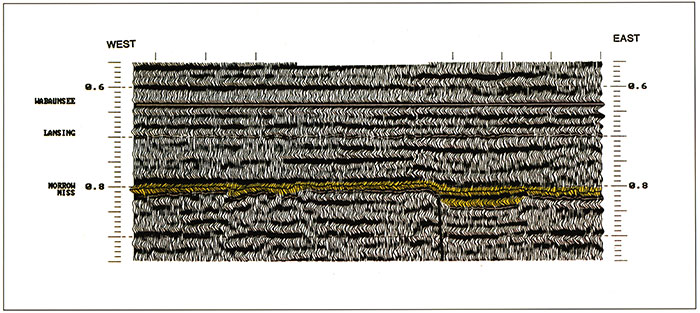
The thick Morrow drainage to the east of Damme field is observed on the detailed section (fig. 10), though the authors will readily admit that without the available well control the correlation to the lower leg of the anomaly may not have been obvious from the data. Part of this interpretation problem is due to a lack of good edge definition of the anomaly. Loss of good edge definition of the west side of the anomaly is primarily due to its juxtaposition with the fault bounding the east side of Damme field. The east side of the deep drainage anomaly is not so readily explained. One possibility is that this east edge of the anomaly is much sharper than we have represented, and the edge was not properly imaged seismically even though the data were migrated. This is, in part, a shortcoming of the acquisition parameters of the data. Regardless, the Mississippian paleostructure is still obvious on the data section, and the utility of the seismic data for exploring for this type of feature should be readily apparent.
More locally, a thickening of the Morrow is observed west of the crest of the paleostructure on the detailed seismic section (fig. 10), and it rapidly thins again to the west. This corresponds to the Morrow thick identified from well control and trending south to north into sees, 6 and 7, T. 22 S., R. 33 W. (fig. 3). As observed on the seismic data, the Morrow thins into sees. 1 and 12, T. 22 S., R. 34 W. Ironically, the subtle drainage patterns as identified by Morrow thickening are more obvious on these data than the dramatic thickening to the east.
Handford (1988) pointed out in his article on the Mississippian ooid grainstone reservoirs of Damme field that the lack of well penetrations below the St. Louis precluded an interpretation on the deeper stratigraphic units at Damme field. To this end, seismic data can provide some insight into the tectonic controls on the field. Many models for grainstone shoal deposition have an underlying structural mechanism which influenced water depth and sea-floor topography. There is an obvious correlation between St. Louis "B" zone oolitic development with the Mississippian structure and, perhaps more importantly, with the Mississippian paleotopography inferred from the Morrow isopach. It is not unreasonable to postulate that this paleotopography is an expression of an older structure which likely had an influence on the "B" zone shoaling. Additionally, an underlying structural framework often controls subsequent erosional frameworks, such as in the Morrow.
Figure 11 shows one possible interpretation of the pre-Mississippian deep section of Line 110. The Precambrian surface was projected into the data on the basis of the estimated Precambrian structure in the area as constructed by Cole (1976) and published by Bickford et al. (1979). The Ordovician surface is estimated from regional well penetrations. As previously noted, there are no deep well penetrations in the immediate Damme field area to conclusively establish these correlations.
Figure 11--Seismic line 110 shown with a basement interpretation. The limit of the St. Louis "B" zone is shown across the top of the section.
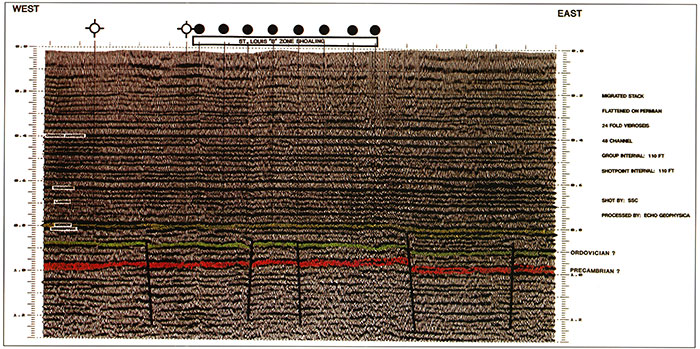
The pre-Mississippian section is interpreted to be influenced by basement-seated block faulting. There are varying degrees of throw on individual faults, with the most dramatic vertical change on the fault bounding the east side of Damme field. There is a strong coincidence of the deep north-south Morrow thick on the east side of the field with a downthrown basement block. The highest basement blocks correspond to the main part of Damme field. The local thickening of the Morrow previously described on the west side of Damme field in sees. 6 and 7, T. 22 S., R. 33 W., is coincident with interpreted block-fault edges.
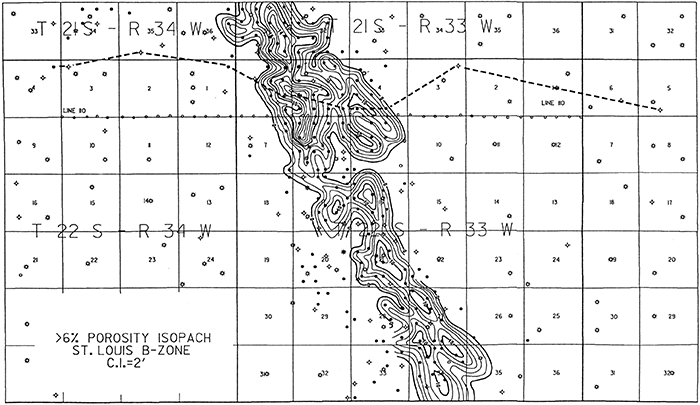
The thickness of the St. Louis "B" zone mapped from well control (fig. 12) shows some interesting correlations with the interpreted fault blocks. The limits of the St. Louis "B" zone as defined by isopach mapping are superimposed across the top of the Line 110 seismic section (fig. 11). The Precambrian surface shows a general west-toeast ramping up into the field and terminating against the east fault. The Ordovician surface mirrors the Precambrian, for the most part, but appears to reach its highest point (relative to the Stone Corral datum this section is flattened on) just to the west of the field axis, from where it rolls off slightly to the east. The highest point of the Ordovician is coincident with a small upthrown block interpreted on the data, and the thickest "B" zone development occurs on the west side of this block.
Figure 12--Porosity isopach of the St. Louis "B" zone at Damme field.
Since the block faulting is interpreted as basement related, it seemed logical to examine any available aeromagnetic data to support this idea. Figure 13 is a portion of the Kansas aeromagnetic map (Yarger et al., 1981) superimposed on the index map (fig. 1). Of immediate interest is the pronounced northwest-southeast-trending aeromagnetic feature that aligns with the east edge of Damme field. Yarger (1983) has pointed out the persistence of this northwest-southeast lineament trend across western Kansas. It would be logical to conclude that this lineament defines a basement boundary which correlates to the basement block faulting interpreted on the seismic data. The observation that the throw interpreted from the seismic data on the basement block faulting is opposite to the sense of the magnetic intensity across the lineament suggests that the aeromagnetic feature is related to a compositional boundary in the basement. Such a boundary would be a likely zone of weakness across which fault displacement could occur. Certainly a more thorough analysis and modeling of the magnetic data profiles and available gravity data would be necessary in order to support such a conclusion.
Figure 13--Portion of the Kansas aeromagnetic map with Damme field and other key Mississippian fields indicated (after Yarger et al., 1981).
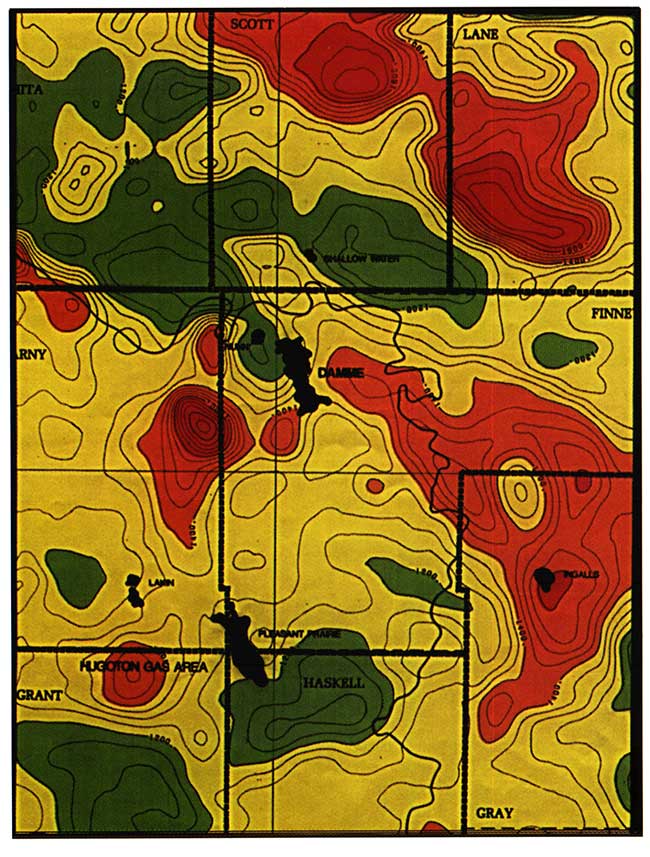
Figure 14--Portion of the Precambrian basement map of Kansas with Damme field and other key Mississippian fields indicated (after Bickford et al., 1979).

The potential basement influence on Damme field was suggested by Cole (1976) and Bickford et al. (1979) in the construction of the topography on the basement surface for Kansas (fig. 14). Damme field can be seen to lie along an interpreted southeast-plunging basement anticline. Other Mississippian fields in the area such as Lakin (Kearny County) and Pleasant Prairie (Finney and Haskell counties) correlate to similar interpreted basement features.
The seismic data examined over Damme field clearly demonstrate how mapping of the paleotopography on the pre-Pennsylvanian unconformity can be accomplished using CDP seismic data. This buried topography can be identified from an analysis of interval times between key horizons such as the Permian Stone Corral (Cimarron) anhydrite and the Mississippian unconformity. Flattening seismic sections on the Stone Corral facilitates the identification and presentation of these features.
The Morrow section overlying the Mississippian thickens and thins in relation to the paleotopography on the Mississippian at Damme field. This could be directly observed on the seismic data, making it possible to map the erosional framework of the Morrow over and around the Mississippian paleotopographic highs. The Morrow sandstones tend to produce in areas flanking the paleotopographic highs. Since the highs influence Mississippian, Ft. Scott, and Marmaton production, an accurate reconstruction of the paleotopography by seismic methods can help make both the exploration for these targets as well as their development more successful.
Seismic data offer some insights into the influence of deeper structure and tectonics on the development of key stratigraphic facies at Damme field. There was a noticeable coincidence between the distribution of St. Louis "B" zone shoaling and deeper basement fault blocks. A similar coincidence could be observed between Morrowan drainage patterns and the basement faulting. The block faulting might be related to a northwest-southeast lineament trend observed on aeromagnetic data, a trend also suggested by previous work on mapping the topography on the basement surface.
We caution that we offer these comments purely as observations of coincidence between different data sets. A more rigorous study integrating gravity and magnetic modeling and analysis, geologic field studies over similar producing structures, and regional seismic data is necessary before firmly concluding that causal relationships exist. Certainly the observations made are both encouraging and intriguing.
The authors would like to express their appreciation to Texaco USA for permitting the publication of this paper, for providing invaluable data, and for assisting with preparation of figures. Robert A. Peterson of Texaco provided invaluable computer drafting assistance. Particular thanks go to Terry Elzi of Echo Geophysical, Denver, Colorado, for providing the reprocessing of the seismic data, and to John Beury III, of Paragon Geophysical, Wichita, Kansas, for helping introduce all the individuals who would contribute to this paper. A final thanks is due the Kansas Geological Survey for their patience during the lengthy preparation of this paper, a time made all the longer by these trying times in our industry.
Bickford, M. E., Harrower, K. L., Nusbaum, R. L., Thomas, J. J., and Nelson, G. E., 1979, Preliminary geologic map of the Precambrian basement rocks of Kansas: Kansas Geologic Survey, Map M-9, scale 1:500,000
Cole, V. B., 1976, Configuration of the top of Precambrian rocks in Kansas: Kansas Geological Survey, Map M-7, scale 1:500,000 [available online]
Handford, C. R., 1988, Review of carbonate sand-belt deposition of ooid grainstones and application to Mississippian reservoir, Damme field, southwestern Kansas: American Association of Petroleum Geologists, Bulletin, v. 72, no. 10, p. 1,184-1,199
Merriam, D. F., 1963, The geologic history of Kansas: Kansas Geological Survey, Bulletin 162, 317 p. [available online]
Schmidlapp, R. L., 1959, Damme and Finnup fields: Kansas Geological Society, Kansas Oil and Gas Fields, Western Kansas, v. 2, p. 8-12
Yarger, H. L., 1983, Regional interpretation of Kansas aeromagnetic data: Kansas Geological Survey, Geophysics Series 1, p. 1-35
Yarger, H. L., Robertson, R. R., Martin, J. A., Ng, K., Sooby, R. L., and Wentland, R. L., 1981, Aeromagnetic map of Kansas: Kansas Geological Survey, Map M-16, scale 1:500,000
Previous--Subtle Stratigraphic Trap, Lexington Field, Clark County || Next--Stockholm SW Field, Greeley/Wallace Counties
Kansas Geological Survey
Comments to webadmin@kgs.ku.edu
Web version placed online Oct. 20, 2015. Original publication date 1995.
URL=http://www.kgs.ku.edu/Publications/Bulletins/237/Miller3/index.html