| Original published in D. W. Steeples, ed., 1989, Geophysics in Kansas: Kansas Geological Survey, Bulletin 226, pp. 81-93 | ||
Kansas Geological Survey
The article is also available as an Acrobat PDF file.
During the summer of 1983, a MiniSOSIE seismic-reflection study was conducted in Rice County in which an 11.2-km (7-mi) 12-fold common depth point (CDP) profile was shot to investigate several local structural and stratigraphic features. The seismic line was oriented east-west, perpendicular to the local structural grain. Several units, ranging from the Arbuckle through the Mississippian limestones, subcrop beneath the basal Pennsylvanian angular unconformity in this area. The subcrop pattern is dominantly north-south and is related to the eastward dip of these units off the Central Kansas uplift. Reflectors in excess of 1,070-m (3,500-ft) depth are detectable on the seismic profile. The deepest reflectors (0.850 secs) correspond to the Precambrian Rice Formation. Good reflectors occur in the lower Paleozoic section corresponding to a local limestone in the Chattanooga Shale and the subjacent Maquoketa-Viola formations. Several limestones in the Upper Pennsylvanian and Permian section also are good reflectors of seismic energy. Stratigraphic features such as local thinning or thickening and channel cuts can be detected in this part of the stratigraphic section. The Lyons anticline, a local north-south-trending structure currently used for gas storage, also is expressed on the seismic line. The seismic profile shows the structural history of this anticline to be long and complex. Initially, the anticline was a broad, symmetric feature possibly related to the formation of the Precambrian Keweenawan rift. Minor growth may have occurred prior to the deposition of the Chattanooga Shale. A third major period of movement occurred during Late Mississippian to Early Pennsylvanian time when a reverse fault developed on the west flank of the structure, thereby making the structure an asymmetric anticline. Minor structural movement occurred again subsequent to the development of the basal Pennsylvanian angular unconformity.
The purpose of this study is to identify local structural and stratigraphic features and to interpret structural history associated with the southeastern edge of the Salina basin using reflection seismology and the methods of seismic stratigraphy. Ongoing analysis of well logs has resulted in questions about the subsurface geology. Early Paleozoic stratigraphic relationships and structural interaction between the Salina basin, Sedgwick basin, and Central Kansas uplift vary over much smaller distances than well control illuminates. The lateral continuity of a seismic section, controlled by the well data, is needed for a more correct interpretation.
Rice County is located over part of a structural saddle formed by the intersection of the Salina basin, the Central Kansas uplift, and the Sedgwick basin. Since the Middle Ordovician, Kansas has undergone five periods of deformation (Lee, 1956; Merriam, 1963). In Rice County, along the southern flank of the Salina basin, deformation has resulted in complex folding and faulting of differing alignments. In general, thickening and thinning of formations as encountered in wells indicate the deformational events. Through reflection seismology, a continuous geologic cross section can be constructed to reveal the particular erosional and depositional sequence, boundary relationships, folding, and faulting for this area.
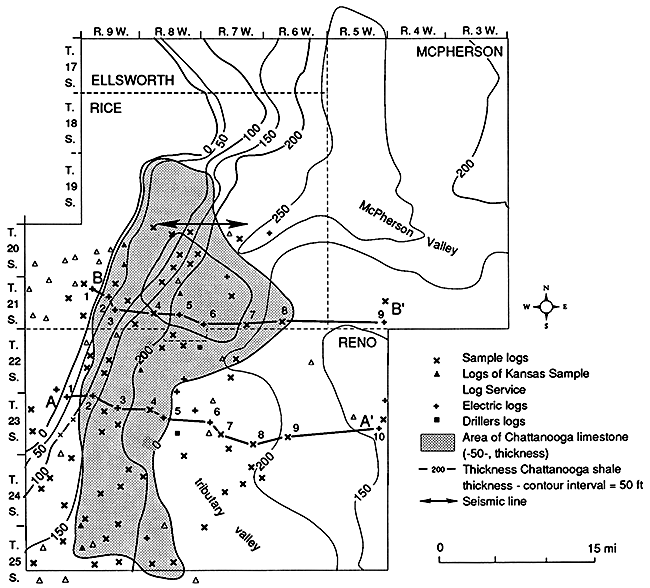
Of particular interest is the extent and character of a limestone within the Mississippian-Devonian Chattanooga Shale. Well-log data indicate thinning or faulting of this Chattanooga limestone (fig. 1). Wells have encountered the limestone at a depth averaging 1,050 m (3,450 ft) below ground surface. The seismic-reflection survey conducted in Rice County for this study is located over the limestone unit, which has a maximum thickness of 21 m (70 ft) at the western edge of the seismic section. The limestone thins to the east and is missing under the eastern edge of the seismic section. Modeling, using synthetic seismograms, and interpretation, using seismic stratigraphic analysis, have helped to define this and other subsurface features in the area.
Figure 1--Topography of pre-Chattanooga McPherson Valley with thickness contours of Chattanooga limestone member in stippled area (from Lee, 1956). Rice County seismic line is shown in T. 21 S., R. 7-8 W.
Rice County is situated on the eastern flank of the Central Kansas uplift and the western side of the unnamed saddle marking the boundary between the Salina and Sedgwick basins. Geologic structures in this saddle generally trend north and north-northeast. Formation thicknesses are generally intermediate to those reported for the Central Kansas uplift and the Salina basin, although the basal conglomerate developed at the basal Pennsylvanian unconformity is thicker than in the Salina basin. The Misener sandstone, a transgressive sand developed at the base of the Chattanooga Shale, is well-developed along the eastern flank of the Central Kansas uplift but thins to a featheredge eastward in the Salina basin. To the west, it is truncated beneath younger conglomerates developed at the basal Pennsylvanian unconformity.
Although no wells along the reflection profile penetrate the Precambrian, aeromagnetic and gravity data suggest the presence of the arkosic sandstones of the Rice Formation under the eastern half of the seismic line (Yarger, 1983). A magnetic low, indicating an anomalously deeper and less magnetic source in the Precambrian, underlies the entire line. This material is considered a transition zone between the rocks of the northern (1,610-1,650 m.y.B.P.) and southern (1,460-1,480 m.y.B.P.) terranes of Van Schmus and Bickford (1981) and Yarger (1983). A deeper seismic investigation may give a greater understanding of the Precambrian mechanics involved in this type of suture zone.
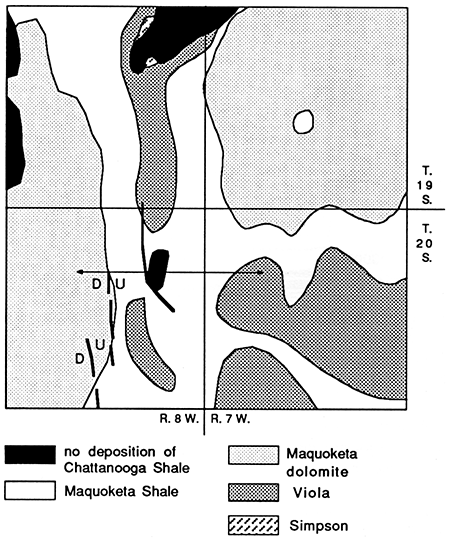
From Ordovician to Devonian time, uplift and erosion along the flanks of the ancestral Central Kansas uplift and local erosion of a large pre-Chattanooga valley named the McPherson Valley by Lee (1956) resulted in the absence of the Silurian-Devonian Hunton group over much of Rice County. The crest of the Central Kansas uplift is just to the west of the cross section in fig. 2. The McPherson Valley begins east of a local anticline (the Lyons anticline), which presently serves as a gas-storage structure for Northern Natural Gas. This anticline is one of a series of north-trending en echelon anticlines developed in western Rice County, which subcrop underneath the basal Pennsylvanian unconformity (fig. 3). Although Chattanooga Shale is present on the flanks of the anticline, Viola Limestone and even Simpson Group subcrop along the crest of the anticline in the vicinity of the seismic line. Farther to the east, the Viola Limestone subcrops beneath the older pre-Chattanooga unconformity in the deeper parts of the McPherson Valley (fig. 4).
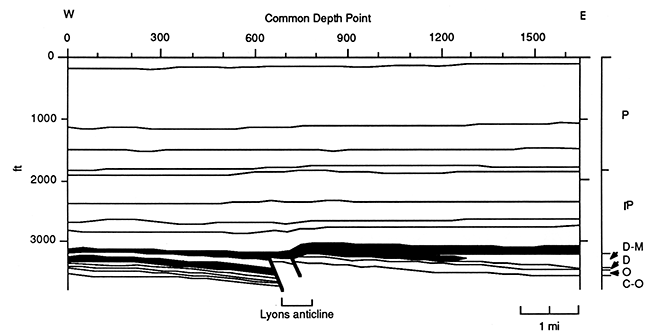
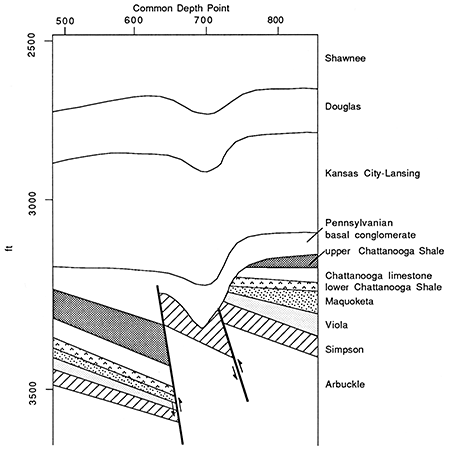
Figure 2--Geologic cross section along Rice County seismic section. Wells used are shown in fig. 6. Lyons anticline is shown as are major structural features of early Paleozoic; layers in black are Pennsylvanian basal conglomerate above and Chattanooga limestone member below.
Accelerated structural activity in Late Mississippian to Early Pennsylvanian time is attributed to be the main deformational event that formed most of the local structures in this region. In the subcrop map of the pre-Pennsylvanian unconformity (fig. 3), a regional outcrop pattern of progressively older strata from east to west shows the eastward dip off the flank of the Central Kansas uplift.
Figure 3--Subcrop map at the basal Pennsylvanian unconformity. Heavy line indicates eastward extent of Chattanooga limestone unit within the Chattanooga Shale. Map is 12 mi x 12 mi (19.3 x 19.3 km). Location of seismic line in T. 20 S. is marked by the double-arrow line.
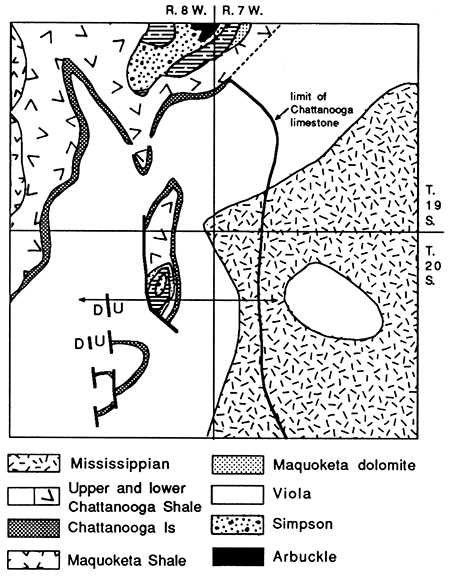
Figure 4--Subcrop map of Pre-Chattanooga unconformity. Dark areas indicate where Chattanooga Shale is absent due to later erosion at the basal Pennsylvanian unconformity. Subcropping Viola in the southeast quadrant of the map expresses the axis of the east-west-trending McPherson Valley. Location of seismic line is shown with double arrow in T. 20 S. Map is 12 mi x 12 mi (19.3 x 19.3 km).
A closer look at the Lyons anticline (fig. 5) indicates variable dip to the east of less than 2° of all beds below the Pennsylvanian basal conglomerate. Reverse faulting on the west side of the anticline forms a cuesta. The nose was eroded along the fault plane into the Simpson to form a river valley. During the Middle Pennsylvanian, folding ceased and the valley was filled with Pennsylvanian basal conglomerate.
Figure 5--Geologic cross section along part of Rice County seismic section showing detail of Lyons anticline; five times vertical exaggeration.
The subcrop pattern of the Chattanooga limestone unit, as shown on the pre-Pennsylvanian subcrop map (fig. 3), reveals a pattern of folding regionally parallel to the Central Kansas uplift. The exact original extent of this limestone is not known. To the east it seems to have been replaced by siltstones during deposition of the upper part of the Chattanooga Shale.
From Late Pennsylvanian through Permian time, local structural activity was very subdued and cyclic deposition dominated local as well as statewide geology. Regional tilting, first to the south in response to a combination of southeastward and southwestward subsidence during Pennsylvanian and early Permian time, and then to the west and north toward the Hugoton and Denver basins during Permian through Cretaceous time, is indicated by thickening of beds. Regional and local sedimentary deposition are most evident as cyclothems of transgressive marine limestone and shale deposits followed by regressive limestone, lagoonal shale, and channel-sand deposits. Facies are generally consistent throughout the area.
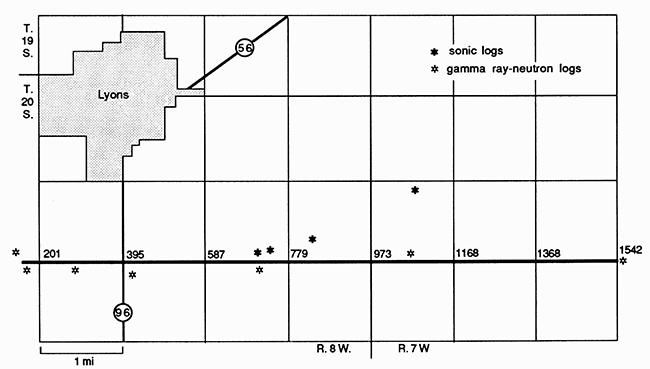
In an effort to better understand the structure of the southwestern flank of the Salina basin, MiniSOSIE (Barbier et al., 1976) reflection-seismic data were acquired by the Kansas Geological Survey during the summer of 1983. The east-west line, located 3.2 km (2 mi) south of US-56 (Lyons, Kansas), covered 11.2 km (7 mi) from 1.6 km (1 mi) west to 9.6 km (6 mi) east of K-96 (fig. 6). An earth-compactor energy source provided the input signal. End-on common-depth-point (CDP) geometry with twelve-fold coverage (table 1) was used. The reflected seismic energy was sensed by a linear array of geophones on the earth's surface and recorded by an Input/Output, Inc., DHR 2400 24-channel recording system.
Table 1--Rice County seismic-reflection line.
| Data-acquisition parameters | |
|---|---|
| Record length | 1 sec |
| Sampling interval | 2 msec |
| Source | MiniSOSIE earth compactor |
| Vertical stack | 2,000 pulses/shotpoint |
| Dominant frequency | 80 Hz |
| Source interval | 17 m (55 ft) |
| Source array | Linear, continuous |
| Receiver interval | 17 m (55 ft) |
| Receiver array | 17 m (55 ft), linear 10 receivers, equally spaced |
| Recording geometry | End-on, 24-channel, CDP |
| Near offset | 226 m (742.5 ft) |
| Far offset | 612 m (2,007.5 ft) |
| Filters: low cut | 55 Hz (24 dB/octave rolloff) |
| Filters: high cut | 125 Hz (24 dB/octave rolloff) |
| Filters: notch | 60 Hz (60 dB rejection) |
Figure 6--Location of Rice County seismic-reflection section. Common-depth-point (CDP) numbers are shown for each mile.
Based on the principles of seismic stratigraphy and constrained by previous geological and geophysical studies, the following interpretation is the most accurate picture of Rice County, Kansas, geology produced within the limits of seismic resolution (figs. 7 and 8).
Figure 7--Rice County processed seismic section, flattened at the Shawnee/Douglas-Kansas City-Lansing interface (approximately 550 msec). Squash plot scale is 100 traces/inch; 1 mi = ~192 CDP.
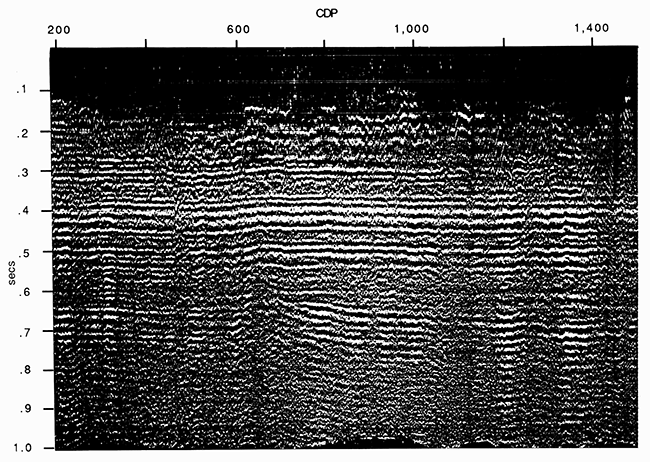
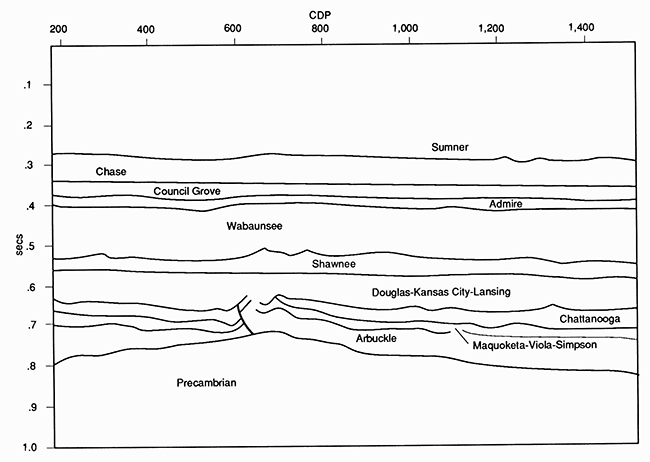
Figure 8--Line drawing of Rice County seismic section (fig. 7). Squash plot scale is 100 traces/inch; 1 mi = 192 CDP. Note depth scale is not linear.
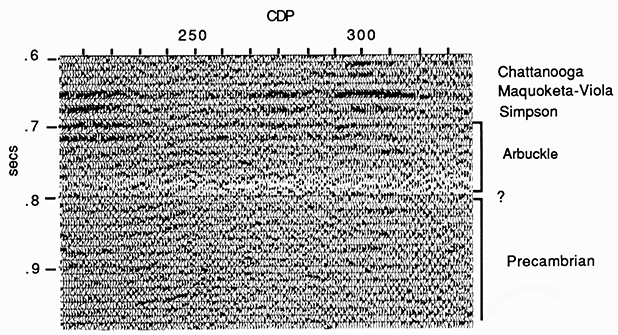
Regional well data indicate the Precambrian in this area underlies an average of 183 m (600 ft) of Arbuckle Group dolomites (Cole, 1975). The contact between the Precambrian granites and the Arbuckle dolomites cannot be seen seismically. However, using an average velocity of 4,300 m/sec (14,000 ft/sec), the Precambrian would be more than 90 msec (two-way time) below the top Arbuckle reflector (fig. 9); hence the seismic record probably extends about 600 m (2,000 ft) into the Precambrian. Several parallel reflections, fading in and out with the data quality, are seen within the Precambrian. The reflections generally follow the Paleozoic sequence and may be multiples; however, the high stacking velocities necessary for these events refutes this possibility. The top of the Precambrian is expected to be Upper Keweenawan Rice Formation arkosic sandstones which, according to the COCORP results in northeastern Kansas, should contain very few good reflectors (Brown et al., 1983; Serpa et al., 1984). Gravity and aeromagnetic data (Yarger, 1983; Yarger and Lam, 1982) suggest this sequence thins westward in Rice County to expose granitic igneous rocks in a transition zone between the northern and southern terranes described by Bickford et al. (1981). Inasmuch as the northern and southern terranes are dominantly granitic-metamorphic complexes, the transition zone between them should be expressed by a lack of significant seismic reflections (Serpa et al., 1984; Brown et al., 1983). However, the discontinuous layering shown in the seismic section implies a consistent stratified rock type along the entire length of the seismic section. Layering of the Precambrian in the central part of the seismic section (CDP's 340 to 1180, .750 to 1.0 sec; fig. 7) does not seem to extend as deep as the layering in other parts of the section, and instead, a rock type different than that of the Rice Formation may be present in the basement in the immediate vicinity of the Lyons anticline.
Figure 9--Large-scale detail of Rice County seismic section with interpretation showing parallel configuration of Chattanooga through Simpson groups. Discordance of west-dipping Arbuckle and Precambrian reflectors indicates west flank of Lyons anticline during the Proterozoic through Ordovician. Pennsylvanian basal conglomerate is shown to thin to the west as its reflection fades.
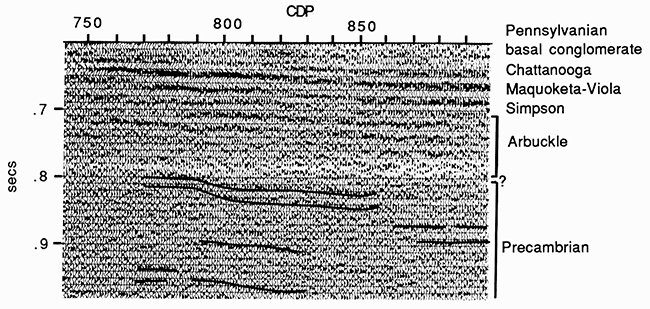
On the assumption that the latter interpretation of two different Precambrian rock types is valid, fig. 10 shows thinning of a Precambrian Rice Formation layer due to upwarping (CDP's 770 to 885, .800 to .840 sec). This implies existence of the Lyons anticline during the Late Proterozoic. Its initial uplift is possibly related to Keweenawan rifting.
Figure 10-Large-scale detail of the Rice County seismic section with interpretation. Uplift of the local anticline is indicated by dipping and thinning of Precambrian Rice Formation reflections.
The boundary between Arbuckle and Precambrian formations does not yield a distinct reflection of sufficient energy. Lower limits of the Arbuckle are approximated using well information, seismic data, and literature (Cole, 1975; Lee, 1956; Merriam, 1963). Except for reflections from CDP's 185 to 290, the character of the Arbuckle sequence is of continuous high-amplitude parallel reflections. To the west (CDP's 185 to 290, .700 to ~.800 sec; fig. 9) and to the east (CDP's 730 to 780, .680 to ~.800 sec; fig. 11), reflections diverge, indicating uplift of the anticline during the time the Arbuckle was deposited. The westward dip and divergence of reflectors between CDP's 185 and 290 contrast with westerly thinning and eastward dip of the Simpson through Shawnee groups. This suggests an earlier opposing deformation of subsidence to the west into the Southwest Kansas basin. Discordance in the form of erosional truncation under a series of horizontal reflections occurs within the Arbuckle Group (CDP's 200 to 250, .680 to .740 sec) to indicate a period of no uplift along the Lyons anticline prior to renewed activity during the Ordovician to Early Pennsylvanian.
Figure 11--Large-scale detail of Rice County seismic section with interpretation. Structure related to Late Mississippian-Early Pennsylvanian deformation of Lyons anticline is shown. Tuning and cancellation due to interference of thinning beds indicates that an erosional flank-outcrop pattern exists immediately below the Pennsylvanian basal conglomerate.
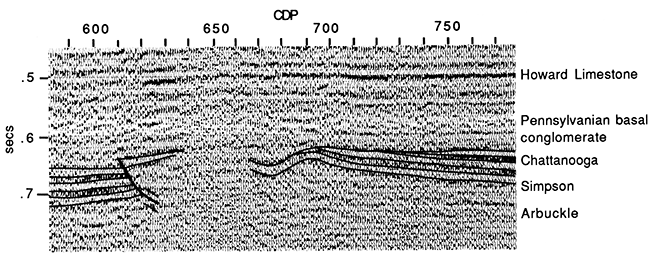
Above the Arbuckle Group, the Simpson Group maintains a constant time thickness and has a noisy, negative-polarity reflection character. The noisy reflection character of the Simpson is a result of the interbedding of shales, sandstones, and dolomites within the group. It is easily identified by the strong positive peaks of the Viola above and Arbuckle below and is distinguished from the lower Chattanooga Shale by the clean, relatively noise-free, negative-amplitude character of the lower Chattanooga. Well-log data indicate that the Simpson crops out beneath the basal Pennsylvanian unconformity on the crest of the Lyons anticline (fig. 11; CDP's 595 to 620, .620 to .650 sec, and CDP's 685 to 710, .620 to .660 sec) and that it thins just east of the major reverse fault (CDP's 595 to 620, .620 to .650 sec), possibly to expose the Arbuckle in the area of multiple diffractions (CDP's 620 to 650, .610 to 1.0 sec). The diffractions are caused by either tight folding or a series of faults that mask reflections below the Pennsylvanian sequence. Unlike the straight-line geologic interpolation of fig. 2, the Simpson is folded down into a river valley between CDP's 650 and 700 (.640 to .660 sec) and underlies weathered deposits of the Viola in the valley center. The abrupt termination of Arbuckle, Simpson, and Pennsylvanian basal conglomerate reflections on the west side of the valley suggests a fault scarp on the west valley slope.
The velocities of the Maquoketa Formation are intermediate between those of the Chattanooga Shale (and Misener sandstone) above and the Viola below. This results in a transitional, stretched, positive reflection joining the Maquoketa and the Viola. Seismically the Maquoketa and Viola must be considered together. The Maquoketa-Viola reflection character is one of the strongest positive peaks on the section and is easily identified as the first peak below the even stronger positive peak of the Chattanooga limestone. The general trend from west to east shows thinning or dimming of both the Chattanooga limestone and Viola-Maquoketa reflectors in contrast to a brightening of the underlying Arbuckle reflectors. As the layers are traced into the McPherson Valley (fig. 12), much of the Maquoketa has been eroded. The Viola-Maquoketa interval thins over the local anticline and the reflection is lost.
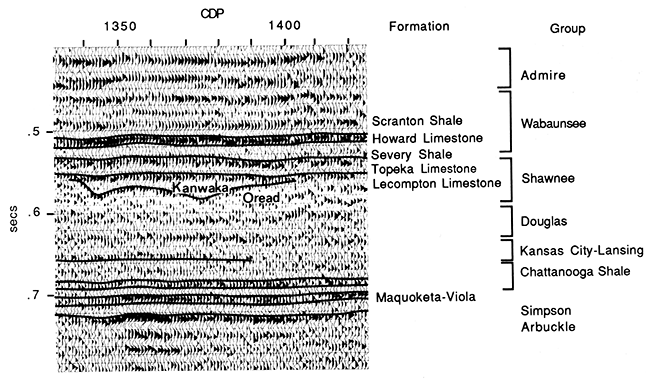
Figure 12--Large-scale detail of Rice County seismic section with interpretation. Stratigraphic relationships of Arbuckle through Wabaunsee groups are shown. Fading out of Chattanooga limestone reflector indicates a short interval in which it is replaced by siltstones or shales (CDP's 1350 to 1360). Channel sand of Kanwaka Shale formation shows erosion through several units down to the Oread Limestone.
The major unconformity that exists above the Maquoketa does not produce either the angular terminations or the high-amplitude reflections necessary for seismic detection. It is therefore doubtful that thinning of the Maquoketa would be noticed on seismic sections without geological control.
For purposes of discussion, the Chattanooga Shale is informally broken up into an upper part, which lies above the Chattanooga limestone, and a lower part, which is subjacent to the Chattanooga limestone. Well control indicates the Misener sandstone is present at the base of the Chattanooga Shale in the vicinity of the Lyons anticline and westward to the subcrop limit as it approaches the Central Kansas uplift . Although the Misener significantly thins east of the Lyons anticline, the reflection character of the base of the Chattanooga Shale is consistently a broad negative polarity which does not change to indicate when the basal Misener is present. Throughout the section the lower Chattanooga shale retains a constant time-thickness, except where it crops out over the anticline.
From well-log data, the Chattanooga limestone unit thins to the east and seems to be replaced by siltstones by the east edge of the seismic section. In many parts of the seismic section, the Chattanooga limestone is by far the brightest positive-amplitude reflector. To the east of the Lyons anticline, the width of the peak thins but does not terminate within the areas of good data quality (fig. 12). One zone of apparent partial siltstone replacement can be seen between CDP's 1350 and 1360. Due to good data quality in this area, all reflectors except the limestone have a bright, noise-free character, which suggests the limestone has either thinned or has been replaced by a lower velocity material to produce only a nominal positive kick. The limestone thins over the anticline (CDP's 715 to 735, .630 sec).
The upper Chattanooga Shale is expressed as a broad negative reflection above the bright, positive Chattanooga limestone reflection. Eastward, the shale thickens dramatically by CDP 1330 (fig. 12). This is the major diverging layer in the seismic section and indicates thickening into and possibly subsidence of the McPherson Valley just to the east.
The general eastward dip of the lower Paleozoic strata reflects the location of the seismic section on the flank of the Central Kansas uplift. Reflectors become more parallel and nearly horizontal in the Pennsylvanian, thereby indicating that deformation along the Central Kansas uplift had ceased.
The major structural features of the Lyons anticline can be described in greater detail. Continuity of the Chattanooga limestone and other layers between Simpson and the upper Chattanooga Shale indicate that the anticline was not active during the time of their deposition and that not until Late Mississippian did it again become active (fig. 5). Abrupt termination of Arbuckle through Pennsylvanian basal conglomerate strata easily defines the fault plane and suggests a reverse sense of displacement along the fault between CDP's 610 and 620. Relative dating of the fault is Late Mississippian due to preservation of the upper Chattanooga Shale on the downthrown block. Evidence that the Pennsylvanian basal conglomerate is cut by the fault suggests renewed fault movement after development of the basal Pennsylvanian unconformity. Structure in the area of diffractions (CDP's 634 to 664, .600 to 1.0 sec) is undecipherable, although the diffractions may be caused by tight folding or faulting contemporaneous with the Late Mississippian to Early Pennsylvanian deformation.
The unconformity at the base of the Pennsylvanian is a low-amplitude discontinuous reflection which is most easily identified by the angular erosional truncations underneath. Except for the river valley in the small downfold of the Lyons anticline, the Middle Pennsylvanian land surface had been flattened and the reflection of the unconformity can be somewhat easily traced across the seismic section at approximately 650 msec (figs. 7 and 8). The Pennsylvanian basal conglomerate reflector fades between CDP's 185 and 250, probably due to thinning. The Chattanooga Shale thickens eastward below the basal conglomerate reflector. Silurian and Devonian rocks are absent probably because of preChattanooga or pre-Pennsylvanian erosional episodes.
Cyclothems of the Kansas City, Lansing, and Douglas groups display a similar reflection configuration of low continuity and amplitude, with parallel to slightly folded bedding (figs. 7 and 8). According to Brown and Fisher (1979), this indicates dominantly nonmarine clastic deposition by river currents and associated marginal-marine transport processes, which is in agreement with the known stratigraphy. Channel sands and shelf-margin limestone lenses and oolite shoals commonly occur within these lower cyclothem units (Merriam, 1963). Well-log data indicate the Kansas City and Lansing groups are composed predominantly of limestones with shales thin enough to be seismically undetectable. In contrast, the Douglas Group is made up almost entirely of shales and channel sands. Marine-limestone mounding, undetectable shales, and extensive erosional hiatuses combine to produce, in general, only nominal reflections for interpretation of the Kansas City, Lansing, and Douglas groups.
Two limestones in the Shawnee Group have significant seismic expressions--the Topeka at the top of the group and the Lecompton near the middle (fig. 12). The thickness of the intervening Calhoun Shale varies across the section, indicating moderate erosion during the hiatus before its deposition. One area of interest and high data quality within the Shawnee Group between CDP's 1330 and 1410 is a stream-channel fill of Kanwaka Shale (fig. 12). Although the Heebner Shale Member at the base of the Shawnee is highly visible in well logs and cores, its 6-ft thickness is only .03 of a wavelength, making its seismic expression virtually invisible.Within the Wabaunsee, two limestone formations exhibit high-amplitude continuous reflections. The Howard near the base (fig. 12) and the Stotler near the top (fig. 13) both possess abrupt lithologic boundaries that produce high reflection coefficients. These reflections are the most continuous of the cyclothem sequence and were used as a guide for much of the statics correction "flattening." The Severy Shale immediately below the Howard shows the greatest thickness variation of all units, suggesting an undulating erosional surface on top of the Topeka Limestone. Between the Stotler and the Howard are several reflections of laterally varying character and amplitude. These reflections are due to several thin limestone and shale units which constructively interfere to appear as a single reflection. These beds are known to be discontinuous, resulting in variable reflection character. In other areas, such as the Shawnee Group in the area of the Heebner, interference is destructive and produces cancellation of unresolvable beds.
Figure 13--Large-scale detail of Rice County seismic section with interpretation. Stratigraphic relationships ofWabaunsee through Council Grove groups are shown. Interference patterns of thin shales and limestones create variable amplitude and character reflectors of the Admire Group and Foraker Limestone formation. The Nolans Limestone illustrates a stretched amplitude due to a transitional boundary.
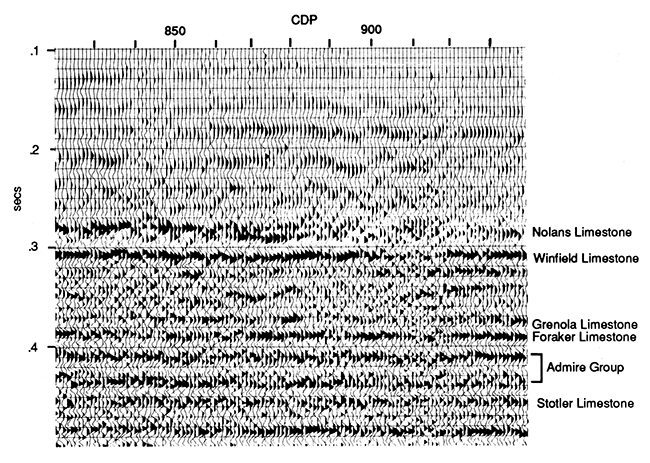
The Admire, Council Grove, and Chase groups of the Lower Permian produce reflection configurations that are similar to the high-amplitude, continuous reflections of the Wabaunsee (fig. 13). Reflections are often the result of interference of laterally constant but individually unresolvable thin beds, which maintain a continuous reflection across the seismic section. Within the Chase Group, individual shale units between the Grenola and Foraker apparently thicken locally and have minimal velocity variations, which is characteristic of homogeneous units. As a result, this interval may be reflection-free in places and seem to be a more or less homogeneous unit. The Nolans Formation also varies laterally and, in places, shows a gradational transition from limestone to shale which results in a stretched-out pulse.
The Sumner and Nippewalla groups are not seen in this particular seismic-reflection section.
The Rice County seismic-reflection profile generally confirms the straight-line interpolations of well geology. However, by virtue of seeing beyond and below the first dimension of the borehole, the seismic line has added the following contributions which greatly improve knowledge of area stratigraphy and structural history.
Barbier, M. G., Bondon, P.,. Mellinger, R., and Viallix, J. R., 1976, Mini-SOSIE for land seismology: Geophysical Prospecting, v. 24, p. 518-527.
Bickford, M. E., Harrower, K. L., Hoppe, W. J., Nelson, B. K., Nusbaum, R. L., and Thomas, J. J., 1981, Rb-Sr and U-Pb geochronology and distribution of rock types in the Precambrian basement of Missouri and Kansas: Geological Society of America, Bulletin, Part I, v. 92,. p. 323-341.
Brown, L., Serpa, L., Setzer, T., Oliver, J., Kaufman, S., Lillie, R., Steiner, D., and Steeples, D. W., 1983, Intracrustal complexity in the United States midcontinent-preliminary results from COCORP surveys in northeastern Kansas: Geology, v. 11, p. 25-30.
Brown, L. F., and Fisher, W. L., 1979, Principles of seismic stratigraphic interpretation; American Association of Petroleum Geology, table 5.2; in, Seismic Stratigraphy, R. E. Sheriff, ed. (1980): International Human Resource Development Corporation, Boston, p. 105-106.
Cole, V. B., 1975, Subsurface Ordovician-Cambrian rocks in Kansas (with maps showing the thickness of potentially oil-bearing formations): Kansas Geological Survey, Subsurface Geology Series 2, 18 p. [available online]
Lee, W., 1956, Stratigraphy and structural development of the Salina Basin area: Kansas Geological Survey, Bulletin 121, p. 1-151. [available online]
Merriam, D. F., 1963, The geological history of Kansas: Kansas Geological Survey, Bulletin 162, 317 p. [available online]
Serpa, L., Setzer, T., Farmer, H., Brown, L., Oliver, J., Kaufman, S., Sharp, J., Steeples, D. W., 1984, Structure of the southern Keweenawan rift from COCORP surveys across the Midcontinent Geophysical Anomaly in northeastern Kansas: Tectonics, v. 3, no. 3, p. 367-384.
Van Schmus, W. R., and Bickford, M. E., 1981, Proterozoic chronology and evolution of the midcontinent region, North America; in, Chapter II, Precambrian Plate Tectonics, A. Kroner, ed.: Elsevier Scientific Publications, New York, p. 261-296.
Yarger, H. L., 1983, Regional interpretation of Kansas aeromagnetic data: Kansas Geological Survey, Geophysics Series 1 , 35 p. [available online]
Yarger, H. L., and Lam, C., 1982, Gravity measurements in Kansas; in, Assessment of the Geothermal Resources of Kansas, D. W. Steeples and S. A. Stavnes, eds.: U.S. Department of Energy, Final report, Contract no. DE-AS07-79ET27204, p. 220--232.
Kansas Geological Survey
Comments to webadmin@kgs.ku.edu
Web version Oct. 8, 2013. Original publication date 1989.
URL=http://www.kgs.ku.edu/Publications/Bulletins/226/Roehl/index.html