Previous--Hampton Field (Arbuckle Group), Rush County || Next--Cherokee Sandstone Reservoir, Southeastern Kansas
1Kansas Geological Survey, 2University of Missouri-Rolla, 3Consultant
This article available as an Acrobat PDF file (5 Mb).
Walta field (448 MBO) is a small field located in Sumner County, Kansas (principally in secs. 19 and 30, T. 33 S., R. 3 W., and sec. 25, T. 33 S., R. 4 W.). Cumulative production of 448 MBO is principally from a sandstone traditionally assigned to the uppermost Simpson Group (Middle Ordovician), but which may be Misener (Upper Devonian-Lower Mississippian), the basal transgressive sand below the Chattanooga Shale. Secondary production is from the Mississippian (Osagean) "chat" just beneath the sub-Pennsylvanian unconformity.
Production at the Mississippian level is structurally trapped, but deeper production at the Simpson/Misener level is stratigraphically trapped by either a pinchout of the "Simpson" sandstones reservoir as they onlap a pre-existing structure or by a truncation by pre-Chattanooga erosion. Primary structure at Walta field is related to Late Mississippian-Early Pennsylvanian tectonic movement that formed a series of westward-tilted fault blocks on a northeast-south west-trending structural nose. This Late Mississippian-Early Pennsylvanian tectonic event is recognized throughout Kansas and formed a series of similar northeast-south west-oriented structures throughout Sumner County and the Sedgwick basin of south-central Kansas. These structural elements appear to be the primary control on the distribution of Ordovician through Mississippian production in the vicinity of Walta field. Within Walta field, northwest-southeast cross-faults define separate pools at the Simpson-Misener reservoir interval, and provide additional extension and exploration opportunities.
Seismic data successfully image the northeast-southwest structural elements that are a critical component in both the Simpson-Misener and the Mississippian pools at Walta field. The seismic data provide insight into the stratigraphic geometries associated with the pinchout/truncation of the Simpson-Misener reservoir interval, and indicate the presence of pre-existing (pre-Chattanooga) structure. Integration of geophysical and geologic data provides an improved understanding of the depositional and tectonic events that led to the hydrocarbon accumulation at Walta field.
Walta field is one of the numerous moderate to small fields (i.e., 0.2-5 MMBO) located throughout the part of the eastern Sedgwick basin that produce from either the Middle Ordovician Simpson or Upper Devonian-Lower Mississippian Misener sandstones and the Mississippian (Osagean) chat (figs. 1 and 2). The Sedgwick basin is a relatively broad southward-plunging embayment of the Anadarko basin of Oklahoma, and is bordered by the Central Kansas uplift and the Pratt anticline to the west, and by the Nemaha uplift to the east (fig. 1). Reported production from Walta field is primarily from a thin sandstone traditionally assigned to the uppermost Simpson Group (Middle Ordovician). Secondary, but important, production is also reported from the Mississippian (Osagean).
Figure 1--Map of Kansas showing the study area in relation to major structural features formed mainly in Late Mississippian and Early Pennsylvanian (after Merriam, 1963). Pattern indicates areas where Mississippian rocks are absent due to erosion on the sub-Pennsylvanian unconformity.
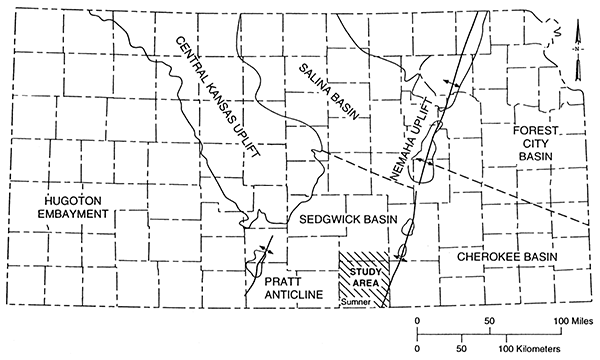
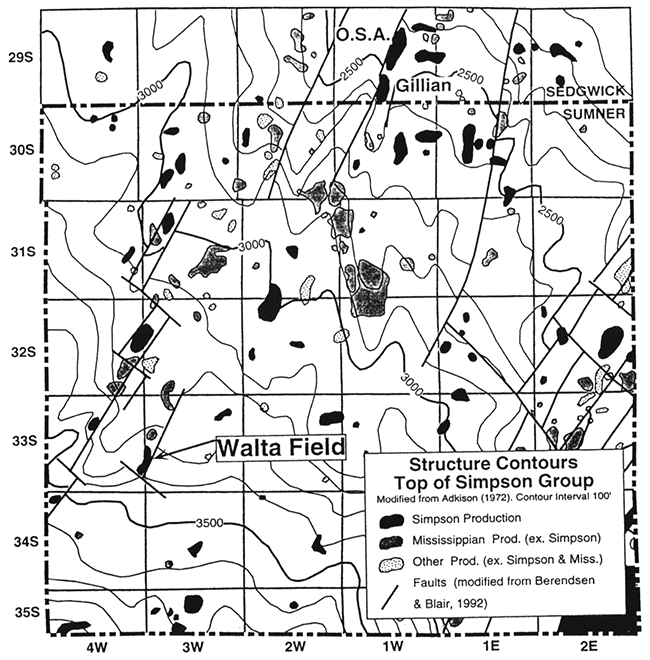
Figure 2--Structure contour map on top of Simpson Group in Sumner County and adjacent areas (modified from Adkison, 1972). Basement-involved faulting is modified from Berendsen and Blair (1992). Oil and gas fields that produce from the Simpson Group are highlighted. Structure contours. Field outlines and age of producing horizon from various sources.
Mississippian (Osage) production is widespread in central and south-central Kansas and is typically at or near the top of the Mississippian section and just below the subPennsylvanian unconformity. Mississippian production is reported from numerous small fields such as Walta in the Sedgwick basin (Newell et al., 1987). Solution weathering of the Mississippian limestones commonly produces a residual cherty, porous zone just beneath the unconformity called the "chat" (a modification of the word "chert;" Ver Wiebe, 1950). In general, reservoir characteristics of the chat zone (e.g., thickness, porosity, and permeability) are extremely variable. At Walta field the Mississippian reservoir displays characteristics of shallow weathering with chat grading to fresh chert in the top 3-4 m (10-15 ft) beneath the sub-Pennsylvanian unconformity.
The majority of the production reported from Walta field is from a thin sandstone traditionally assigned to the uppermost Simpson Group. Late Mississippian-Early Pennsylvanian tectonic movement removed the Simpson over much of the Central Kansas uplift, the Nemaha uplift, and northwestern Kansas. As a result, production from the Simpson Group is primarily limited to the Sedgwick basin and adjacent areas of south-central Kansas. Production trends are evident along the southern margin of the Central Kansas uplift and down the Pratt anticline where the Simpson Group subcrops beneath the sub-Pennsylvanian unconformity (Newell et al., 1987). The Simpson also produces beneath the sub-Pennsylvanian unconformity at the El Dorado field on the Nemaha uplift in Butler County (Jewett, 1954). The removal of the Simpson Group over much of the Central Kansas uplift, the Nemaha uplift, and northwestern Kansas is related to Late Mississippian-Early Pennsylvanian tectonic movement (Merriam, 1963). The absence of the Simpson in southeastern Kansas is due to pre-Devonian (pre-Chattanooga) erosion across the Chautauqua arch. Minor production in the Sedgwick basin comes from Simpson sandstones where they are truncated on the flanks of the Chautauqua arch. In Kansas, the Simpson Group is dominantly a sandstone-shale sequence with minor amounts of carbonate rock. The main reservoir rocks within the Simpson Group are light-gray, quartz-rich, friable sandstones sometimes called the St. Peter or Wilcox (Goebel, 1968).
Simpson production is confined to the western flank of the faulted structural nose that forms the trap at the Walta field. The Simpson sandstone reservoir is not present or is very thin on the crest of the structure, being removed either by pre-Chattanooga erosion, or thinning by onlap onto a pre-existing high. If the onlap scenario is correct, the sandstone is probably a transgressive sand at the base of the Chattanooga Shale and should more appropriately be identified as Misener sandstone.
Misener sandstone is a thin, erratically developed transgressive sand at the base of the Chattanooga Shale. Misener sandstone reservoirs are scattered throughout the Sedgwick basin of south-central Kansas. In Kansas, the Chattanooga Shale is generally identified by drillers as the Kinderhook Shale. The Misener sandstone can be up to several meters thick adjacent to the Central Kansas uplift, but elsewhere it is commonly represented by a slightly sandy zone at the base of the Chattanooga Shale. In areas along the eastern Sedgwick basin where Middle and Upper Ordovician shales and limestones have been removed by pre-Chattanooga erosion, the Misener can directly overlie the Simpson Group. Given that Misener sandstone was the result of reworking the exposed Simpson Group on the Chautauqua arch, it is difficult by lithologic criteria alone to distinguish the Misener from sandstones of the Simpson Group.
Distinguishing characteristics of the Misener were reported to be comparatively poor sorting, fairly abundant black phosphatic grains, and pyritic and siliceous cement (Adkison, 1972). Thirty miles (50 km) to the north at the O. S. A. field (T. 29 S., R. 1 W.), a thin sandstone reservoir in a similar stratigraphic position to the "Simpson" at Walta field was also assigned to the Simpson Group (Shawver, 1965a). This sandstone also thins by either erosion or onlap to the east across a faulted structural nose and forms a combination structural-stratigraphic trap. In addition, phosphatic grains ("specks") typical of Misener sandstone were reported to occur within this sandstone (Shawver, 1965a). The Simpson reservoir at the O. S. A. field may also be Misener and illustrates the difficulty in distinguishing the two in the absence of the overlying Ordovician shales and limestones. Further north at Valley Center field (T. 26 S., R. 1 W.), the overlying Viola Limestone is present, and the Misener sandstone can be recognized. Production at Valley Center field is reported from stratigraphic pinchout of the Misener sandstone along the flank of a structure. Structural traps are formed with both older and younger reservoirs on this anticline (Wright, 1960).
Based on present data, assignment of the sandstone-reservoir interval at Walta field to either the Misener or the Simpson is an open question. However, following tradition this reservoir interval at Walta will be simply referred to as "Simpson." In either case the "Simpson" sandstone at Walta field thins by either onlap or truncation onto a structure that existed prior to deposition of the Chattanooga (Kinderhook) Shale. Similar pre-Chattanooga structural influence is apparent in other "Simpson" pools in the eastern Sedgwick basin (e.g., O. S. A. field, Shawver, 1965a; and Gillian field, Shawver, 1965b).
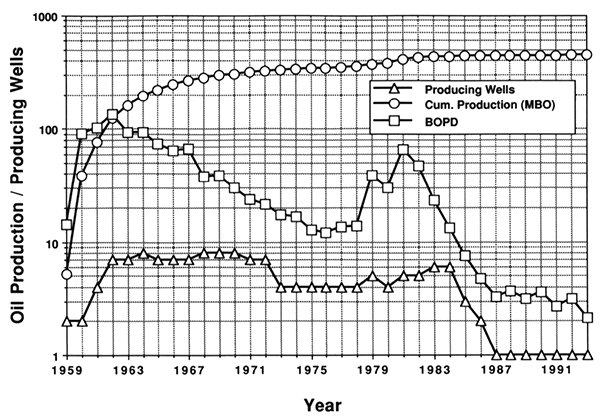
Walta field, located in Sumner County (principally in secs. 19 and 30, T. 33 S., R. 3 W., and sec. 25, T. 33 S., R. 4 W.), was discovered in 1959 by the Dorset #1 Walta (SE SE NE sec. 25, T. 33 S., R. 4 W.) Initial production was reported as 50 BOPD from the "Simpson." In 1961, oil was discovered in the Mississippian chat by the Dorset #3 Walta (SW NE SE sec. 25, T. 33 S., R. 4 W.). Annual production peaked in 1962 at over 135 BOPD from seven wells. Production declined steadily until the late 1970's (fig. 4). In the late 1970's, two wells, the Samson #3 Stewart (SW NW SW sec. 19, T. 33 S., R. 3 W.) and the Raymond #1 Stewart (NW NE SW sec. 19, T. 33 S., R. 3 W.), extended "Simpson" and Mississippian chat production in the Walta field to the north and resulted in a second peak in production (fig. 4). Production declined and has held steady at 3 BOPD from a single producing well from 1987 through 1993. Reported cumulative production through 1993 was 448 MBO (Beene, 1994).
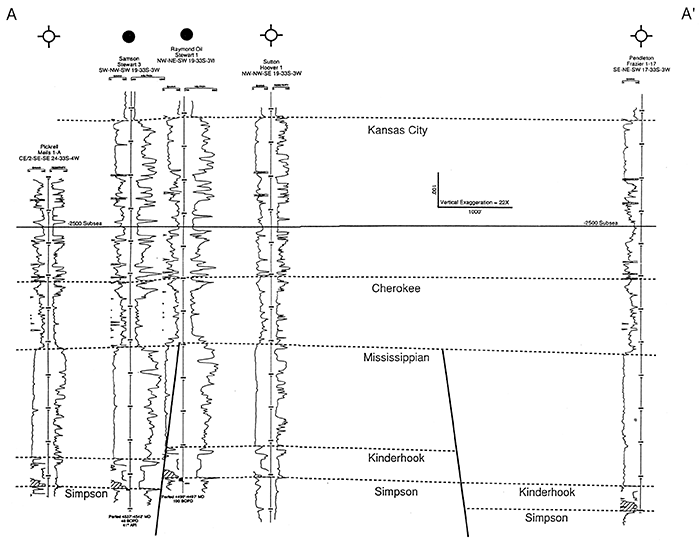
Figure 3--Structure contour map on top of Simpson Group of Walta field area, showing wells producing from both the "Simpson" and Mississippian chat. Locations of the geologic cross section (fig. 5) and seismic section (fig. 8) are shown.
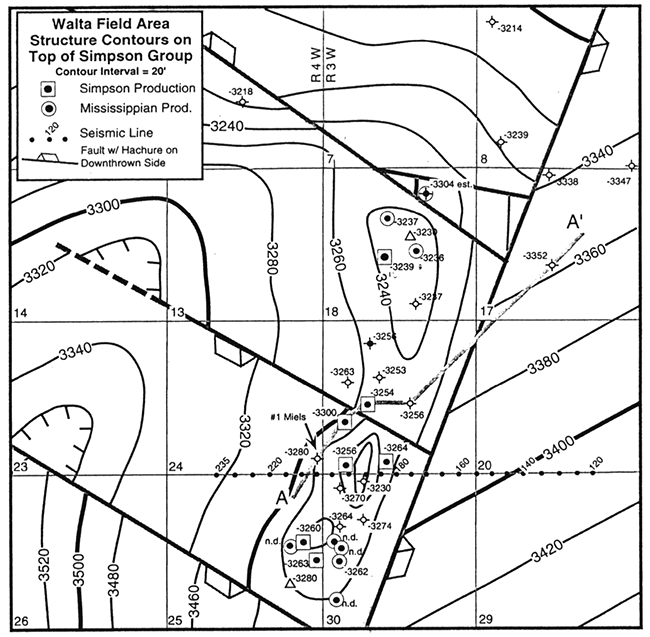
Figure 4--Annual production data from Walta field from 1966 through 1993. Cumlative production is from discovery in 1959 through 1993. Reported cumulative production from Walta is entirely oil, and through 1993 was 443 MBO. As of 1987, only a single well operated in the field. Data are from Kansas Geological Survey files and Beene (1994).
The trap at Walta field is interpreted as being formed by a series of tilted fault blocks along a northeast-south west-plunging anticlinal nose (fig. 3). The relatively steep eastern side of the structure is mapped as a northeast-southwest-trending fault. This fault is parallel and on line to other basement faults throughout the eastern Sedgwick basin (Berendsen and Blair, 1992). Similar tilted fault blocks have been noted at O. S. A. and Gillian fields (Shawver, 1965a), and may be a common trap component at other fields in the area (e.g., Fall Creek and Caldwell fields; Bass and Lukert, 1959). A structure contour map on top of the Simpson Group of Sumner County and adjacent areas (fig. 2) shows that oil and gas fields that produce from the Simpson Group and the Mississippian are associated with northeast-southwest structural trends that appear to be closely related to basement fault trends. The structure at Walta field, as based on subsurface mapping and depicted by a structural cross section (fig. 5), is attributed to Late Mississippian-Early Pennsylvanian tectonic movement. Structural relief decreases significantly above the sub-Pennsylvanian unconformity. The small amount of structural relief observed above the unconformity is attributed to depositional thinning and compaction over eroded and subdued paleotopography associated with the Late Mississippian-Early Pennsylvanian deformation and basal Pennsylvanian unconformity. This is consistent with previous interpretations of the tectonic and depositional history of Kansas (cf., Merriam, 1963). A series of northwest-southeast cross-faults define separate fault blocks and separate pools at the "Simpson" and possibly Mississippian levels at Walta field. The structural cross section shows one of the cross-faults between the #3 Stewart and #1 Stewart wells This fault has 30 ft (9 m) of vertical offset and defines separate "Simpson" pools (fig. 5). The cross-faulting in conjunction with the stratigraphic pinchout of the "Simpson" provide opportunities for additional extension and exploration activity in the vicinity of Walta field.
Figure 5--Northeast-southwest structural cross section across a part of Walta field (see location on fig. 4). Structural relief at Simpson and Chattanooga levels decreases significantly in higher horizons. Faulting is interpreted to be related to Late Mississippian-Early Pennsylvanian tectonic movements. Erosion on the sub-Pennsylvanian unconformity has subdued relief at the unconformity. The fault between the #3 Stewart and #1 Stewart wells defines separate pools at the "Simpson" reservoir, This sandstone also pinches out up-structure toward the #1 Hoover well. Structural relief on higher markers (e.g., Kansas City) is very subtle, and is attributed to compaction across the eroded structural block.
The example seismic profile for the Walta field (figs. 6 and 7) images the Late Mississippian-Early Pennsylvanian faulted anticline that provides the structural element of the "Simpson" and Mississippian hydrocarbon traps (figs. 3 and 5). This structural feature is characterized by up to 10 msec (66 ft, 20 m) of relative structural closure at the Simpson level. The Chattanooga Shale also shows up to 10 msec (66 ft, 20 m) of thinning and a pronounced lateral variation in its seismic image as it onlaps the high.
Data were acquired using a 24-fold air gun (75 cubic-inch chamber) and a 48-trace split-spread receiver array. Group and source interval was 82.5 ft (25 m). Near and far offsets were 82.5 ft (25 m) and 1,980 ft (603 m), respectively. Each group consisted of 12 inline Mark Products 30-Hz geophones. Three segments of six pops each were summed at each location. Sercel 338HR recording equipment was used with a recording sample rate of 2 msec. Low and high bandpass filters of 25 and 125 Hz were used, and the notch filter was out. Data are presumed to be zero-phase, and the displays are interpreted to be reverse polarity; therefore, increases in acoustic impedance correspond to troughs on the seismic data (figs. 6 and 7).
Figure 6--Interpreted, reverse-polarity display of the example seismic proflle across the Walta field.
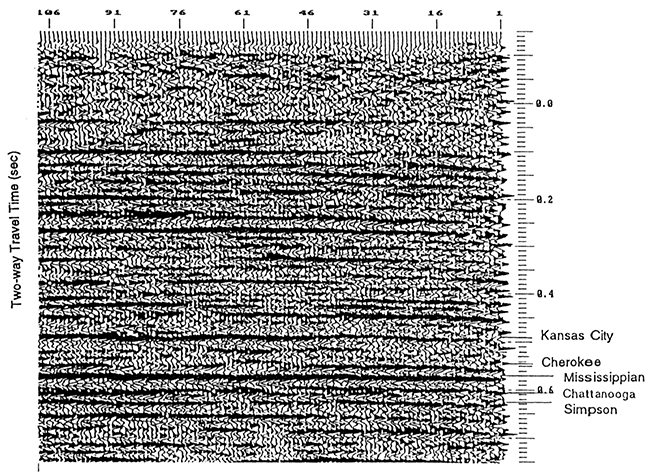
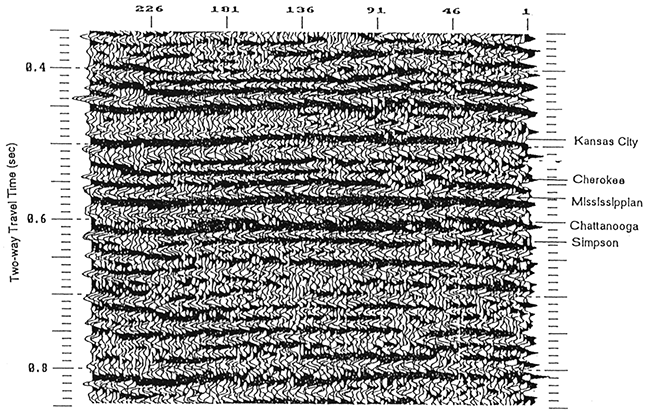
Figure 7--Enlarged display of a portion of the example seismic line (fig. 6).
As an aid to the interpretation of the example seismic line, a suite of zero-phase, 52- Hz, Ricker-wavelet based, one-dimensional synthetic seismograms (both normal and reverse polarity displays) were generated for the #1 Meils well (E/2 SE SE sec. 24, T. 33 S., R. 4 W.; figs. 8, 9, and 10). The #1 Meils is effectively on-line, and the corresponding synthetic seismogram ties the seismic profile at trace 214. The synthetic seismogram and the seismic profile correlate reasonably well from the top of the Kansas City Group down to TD. The match is somewhat tenuous above the Kansas City Group. This is probably due to a combination of several closely spaced, thin low- and high-velocity layers, borehole cavitation (as indicated by the caliper log), and the use of a zero-phase Ricker wavelet in the construction of the synthetic seismogram.
Figure 8--Integrated sonic log (ft/sec), acoustic-impedance curve, and 52-Hz, zero-phase, ricker-wavelet based synthetic seismograms for the #1 Meils well (E/2 SE SE sec. 24, T. 33 S., R. 4 W; see fig. 5). The #1 Meils is effectively on-line with the corresponding synthetic seismograms tying the seismic profile at trace 214. Horizon tops: Kansas City, 3,448 ft (1,501 m); Cherokee, 3,960 ft (1,207 m); Mississippian, 4,112 ft (1,253 m); Chattanooga, 4,456 ft (1,358 m); Misener, 4,525 ft (1,379 m); Simpson, 4,529 ft (1,380 m).
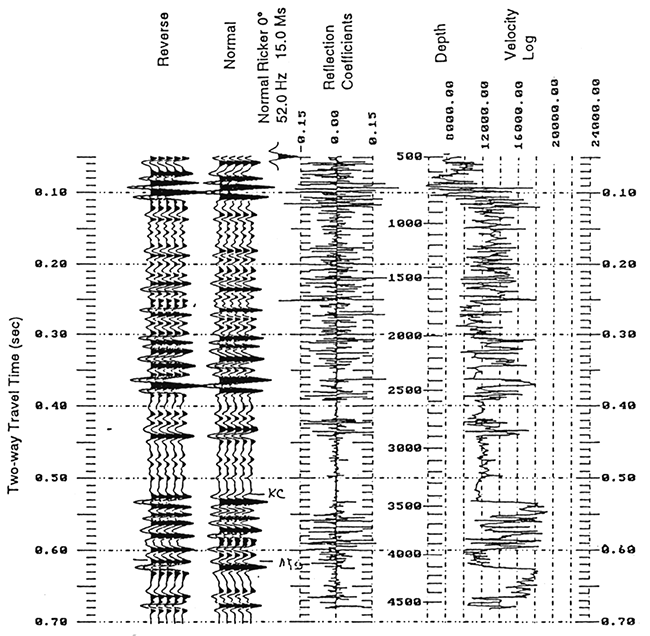
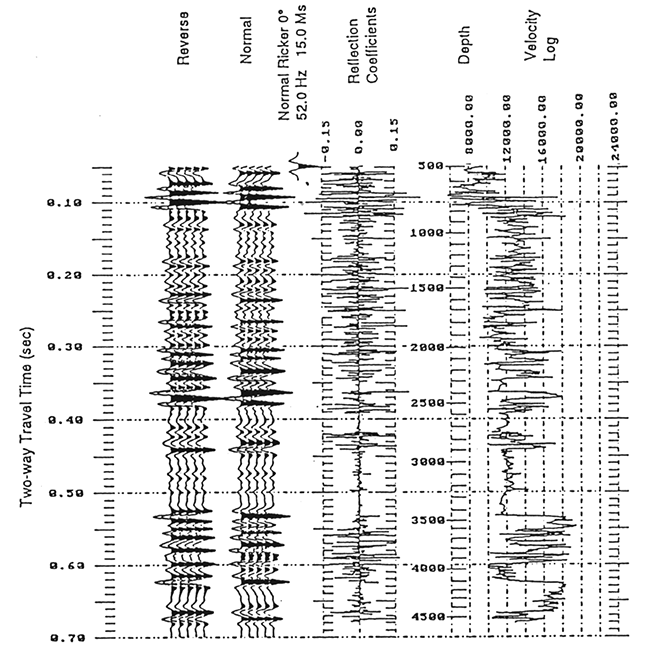
Figure 9--Modified synthetic seismograms for the #1 Meils well (E/2 SE SE sec. 24, T. 33 S., R. 4 W.; see fig. 5). The Chattanooga-Simpson interval in this model has been reduced (squeezed) by 10 ft (3 m) to simulate the depositional thinning of this interval over the crest of the structure. Horizon tops: Kansas City, 3,448 ft (1,051 m); Cherokee, 3,960 ft (1,207 m); Mississippian, 4,112 ft (1,253 m); Chattanooga, 4,456 ft (1,358 m); Misener, 4,515 ft (1,376 m); Simpson, 4,519 ft (1,377 m).
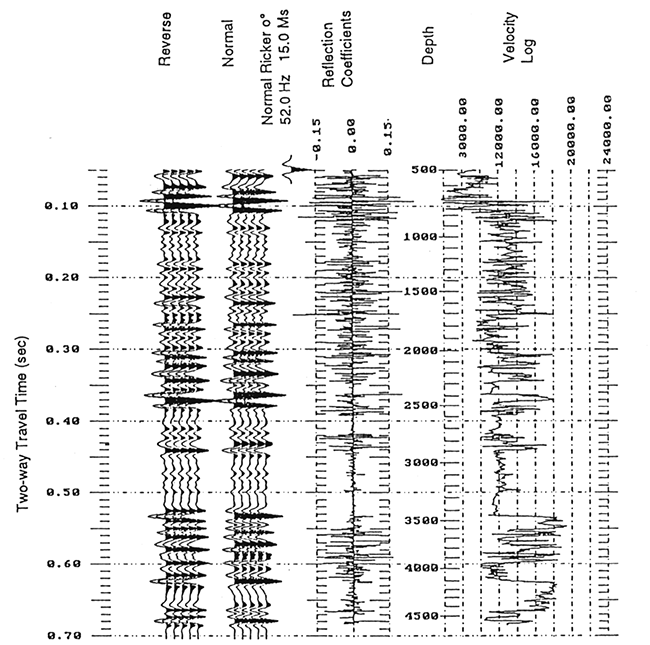
Figure 10--Modified synthetic seismograms for the #1 Meils well (E/2 SE SE sec. 24, T. 33 S., R. 4 W.; see fig. 5). The Chattanooga-Simpson interval in this model has been increased (stretched) by 16 ft (5 m) to simulate the depositional thickening of this interval on the flanks of the structure. Horizon tops: Kansas City, 3,448 ft (1,051 m); Cherokee, 3,960 ft (1,207 m); Mississippian, 4, 112 ft (1,253 m); Chattanooga, 4,456 ft (1,358 m); Misener, 4,542 ft (1,384 m); Simpson, 4,546 ft (1,386 m).
The synthetic seismograms of fig. 8 were generated from the sonic log recorded at the #1 Meils well. On the reverse-polarity synthetic seismogram display, the tops of the Mississippian subcrop and "Simpson" correspond to moderate-amplitude troughs. Conversely, the top of the Chattanooga is represented by a moderate-amplitude peak. The interval between the top of the Chattanooga and the top of the "Simpson" (Chattanooga/Simpson) interval is imaged as a doublet peak followed by a trough.
The synthetic seismograms of figs. 9 and 10 were generated for modified versions of the sonic log recorded at the #1 Meils well. More specifically, the Chattanooga/ Simpson interval on the velocity log in fig. 9 was reduced (squeezed) by 10 ft (3 m) to simulate depositional thinning on-structure. In fig. 10, the Chattanooga/Simpson interval on the velocity log in fig. 9 was increased (stretched) by 16 ft (5 m) to simulate depositional thickening off-structure. On the reverse-polarity displays of both synthetic seismograms, the tops of the Chattanooga and Simpson are represented by peaks and troughs of moderate amplitude, respectively. The significant difference is that the Chattanooga/Simpson interval on fig. 9 is imaged as a peak-trough sequence. On fig. 10, the Chattanooga/Simpson interval is imaged as a peak-trough-peak-trough sequence.
A reverse-polarity display of the field seismic data is presented in fig. 6. In fig. 7, a blowup of deeper reflections is shown in order to accentuate the seismic image of the subsurface at the pay-zone level. Several prominent events have been correlated on these sections; these horizons are identified on the synthetic seismograms (fig. 8), and labelled on the geologic cross section (fig. 5).
The lowest correlated reflection on the seismic profile is the trough identified as the Simpson. This horizon is characterized by up to 10 msec (66 ft, 20 m) of relative time-structural relief, being highest beneath the Walta field near the center of the profile. This pattern of time-structural relief is consistent with the thesis that the Misener or Simpson sandstones at the Walta field pinch out against the flanks of a positive structural feature at the Simpson level.
In contrast to the Simpson, the reflection associated with the top of the Chattanooga Shale is relatively flat across the Walta field, displaying less than 5 msec (33 ft, 10 m) of relief. This suggests that some of the structural relief at the Simpson level pre-dated the deposition of the Chattanooga Shale and Misener sandstone. This observation is also supported by the analysis of the seismic image of the Chattanooga-Simpson interval on the seismic profile (fig. 6). Off structure (east of trace 91 and west of trace 201), the Chattanooga-Simpson interval is generally represented by a peak-trough-peak-trough sequence. Across the crest of the structure (traces 123-147), this Chattanooga-Simpson interval is thinner and is represented by a peak-trough sequence. Elsewhere (on the flanks of the structure), the Chattanooga-Simpson interval is generally represented by a doublet peak-trough sequence of intermediate width. The change of character of the wavelets observed within the Chattanooga-Simpson interval on the seismic profile is similar to those observed on the suite of synthetic seismograms (figs. 8, 9, and 10). This observed similarity supports the interpretation that the Chattanooga-Simpson interval thins on-structure. The interpretation of the seismic data supports the concept that part of the structural relief at the "Simpson" pre-dates the major Late Mississippian-Early Pennsylvanian deformation and possibly influenced the deposition of the Misener and Chattanooga sequences.
The seismic reflection associated with the Mississippian strata subcropping the basal Pennsylvanian unconformity, like the Simpson reflection, is time-structurally higher (up to 5 msec; approximately 33 ft [10 m]) across the Walta field than elsewhere on the seismic line. This pattern of relief could be the result of erosion at the Mississippian subcrop level, compaction across the underlying Simpson structure, faulting as interpreted from the geologic data, a statics correction problem, or a combination of these processes or factors. The observation that less relief is observed at the Mississippian level than at the Simpson level supports the interpretation that some of the structure at the Simpson level pre-dates the deposition of the Misener sandstones.
Integration of geophysical and geological data provides an improved understanding of the depositional and tectonic events that led to the hydrocarbon accumulation at Walta field. Seismic data can successfully image the northeast-southwest structural elements that are a critical component in both the "Simpson" and the Mississippian pools in the eastern Sedgwick basin. The seismic data provide insight into stratigraphic geometries associated with the pinchout or truncation of the "Simpson" reservoir interval, and the presence of pre-existing (pre-Chattanooga) structure. The Walta field is a combination structural/stratigraphic trap at "Simpson" level. The "Simpson" sandstone is present only on the flanks of the structure, and either onlaps or is truncated by the unconformity at the base of the Chattanooga Shale. If the "Simpson" sandstones onlap the structure, they would more likely be related to the Chattanooga Shale and should be identified as Misener sandstone. In either case the "Simpson" sandstone at Walta field thins by either onlap or truncation onto a structure that existed prior to deposition of the Chattanooga Shale.
Andre Steinle provided background information and contributed to the geologic interpretations. David Newell provided significant editorial feedback.
Adkison, W. L., 1972, Stratigraphy and structure of Middle and Upper Ordovician rocks in the Sedgwick basin and adjacent areas, south-central Kansas: U.S. Geological Survey, Professional Paper 702, 33 p. [available online]
Bass, B. L., and Lukert, L. H., 1959, Geophysical history of the Fall Creek pool, Sumner County, Kansas; in, Symposium on Geophysics in Kansas, W. W. Hambleton, ed.: Kansas Geological Survey, Bulletin 137, p. 287-295 [available online]
Beene, D. L., 1994, Oil and gas production in Kansas: Kansas Geological Survey, Oil and Gas Production Dataset 92, 267 p.
Berendsen, P., and Blair, K., 1992, Midcontinent Rift System, Precambrian structure map: Kansas Geological Survey, Open-file Report 92-41A
Goebel, E. D., 1968, Ordovician System; in, The Stratigraphic Succession in Kansas, D. E. Zeller, ed.: Kansas Geological Survey, Bulletin 189, p. 14-15 [available online]
Jewett, J. M., 1954, Oil and gas in eastern Kansas: Kansas Geological Survey, Bulletin 104, 39 p.
Merriam, D. F., 1963, The geologic history of Kansas: Kansas Geological Survey, Bulletin 162, 317 p. [available online]
Newell, K. D., Watney, W. L., Cheng, S. W. L., and Brownrigg, R. L., 1987, Stratigraphic and spatial distribution of oil and gas production in Kansas: Kansas Geological Survey, Subsurface Geology Series 9, 86 p. [available online]
Shawver, D. D., 1965a, O.S.A. field; in, Kansas Oil and Gas Fields, v. 4: Kansas Geological Society, p. 175-183
Shawver, D. D., 1965b, Gillian field; in, Kansas Oil and Gas Fields, v. 4: Kansas Geological Society, p. 78-87
Ver Wiebe, W. A., 1950, North American and Middle East oil fields: Edwards Brothers, Inc., Ann Arbor, Michigan, 259 p.
Wright, B. J., 1960, Valley Center field: Kansas Geological Survey, Kansas Oil Fields, v. 3, p. 149-156
Previous--Hampton Field (Arbuckle Group), Rush County || Next--Cherokee Sandstone Reservoir, Southeastern Kansas
Kansas Geological Survey
Comments to webadmin@kgs.ku.edu
Web version placed online Jan. 4, 2016. Original publication date 1995.
URL=http://www.kgs.ku.edu/Publications/Bulletins/237/Carr2/index.html