Kansas Geological Survey, Subsurface Geology Series 9, originally published in 1987
Next--Stratigraphic distribution of petroleum
Originally published in 1987 as Kansas Geological Survey Subsurface Geology Series 9. The book is also available as an Acrobat PDF file (75 MB).
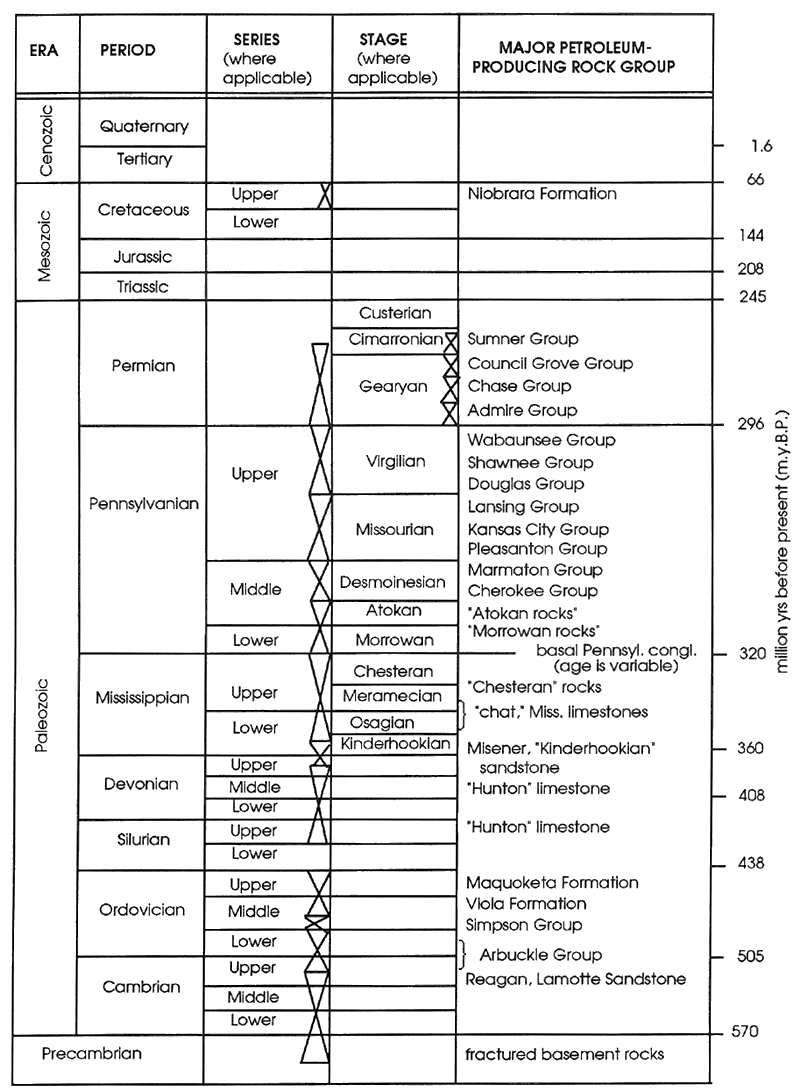
The maps in this report have been compiled with the goal of acquainting the reader with the distribution of petroleum in Kansas. We feel that by knowing the geologic and spatial distribution of petroleum production in the state, one will be able to better predict where some future production may be found by either concentrating exploration efforts within existing production trends or by extending them. New trends and new pay zones of course can be discovered, but maps in this text will usually not be of direct help in such cases. In this report we have categorized Kansas petroleum production into several geologic pay horizons (fig. 1) and have included maps that show both the subsea and subsurface depths of this production. Pay horizons considered are sub-Arbuckle; Arbuckle; Simpson; Viola and Maquoketa; "Hunton" (Silurian and Devonian limestones); Chattanooga and Misener; Mississippian; Morrow and Atoka; Cherokee and Marmaton; Pleasanton, Kansas City and Lansing; Douglas, Shawnee, and Wabaunsee; Admire; Council Grove; Chase; Sumner; and Niobrara. Other maps include the number of pay zones and fields by discovery date and a series of maps that depict the volumetric distribution of petroleum production in the state. Each map is accompanied by a brief commentary with references that will direct the reader to more elaborate discussions in the geologic literature. A glossary also is included for nongeologists at the end of this report, which will help explain various geologic concepts and terms discussed in the text.
Figure 1--Geologic timetable and Kansas rock chart showing the various producing zones considered in this report.
The maps in this report were generated in 1984 through 1987 using the facilities of the Automated Cartography Laboratory and Graphics Arts Department at the Kansas Geological Survey. GIMMAP (Geodata Interactive Management Map Analysis and Production), a computer-assisted cartography system developed jointly by the Kansas Geological Survey and the Bureau de Recherches Geologiques et Minieres, Orleans, France, is the software utilized to create the maps. The data base on Kansas oil- and gas-producing zones used to generate some maps in this report is a subset of a larger data base supplied by Petroleum Information Corporation (an A. C. Nielsen Company). This smaller data base has information on almost 53,000 pay zones distributed over approximately 49,500 production wells in Kansas. Such an extensive data base, constructed on reports from thousands of geologists and drillers over several years, is bound to contain some errors and misinformation. The authors have hopefully deleted most errors, but to catch all errors, such as incorrect well locations or pay-zone identifications, is virtually impossible. Correcting the data base is an ongoing project, and anyone who detects errors in the maps contained in this publication is invited to contact the authors in order that subsequent publications of this type can be more reliable. The authors also welcome any suggestions about other types of maps that also can be used to depict the distribution of petroleum production in Kansas.
Pay-zone and depth maps in this report were constructed by plotting productive or once-productive oil or gas wells as small squares. At map scale, each square is approximately 5/8 x 5/8 mi (1 x 1 km). Data available for western Kansas are relatively complete since 1964, the starting date of data compilation. Only selected development and exploration wells drilled prior to 1964 were added to this base, but the effect on producing areas at the scale of these maps is negligible except for very large fields drilled prior to 1964, such as the Hugoton gas area. Older producing areas such as the Cherokee basin in eastern Kansas also have data largely limited to recently drilled wells. The pattern of wells in eastern Kansas is therefore spotty and does not precisely follow known field outlines. Nevertheless, major producing trends are adequately defined.
The maps in this report are probably best used in conjunction with the 1:500,000 oil- and gas-field map (Paul and others, 1982) published by the Kansas Geological Survey. This map is periodically updated to show additional new fields and extensions of old fields. Additional information on production of individual fields is available from oil- and gas-production reports (e.g., Paul and Beene, 1985), periodically published by the Kansas Geological Survey. Previous publications on the distribution of pay zones in the state include Hilpman (1958) and maps by M.O. Oros in Ebanks (1975). Comparison of the earlier maps with the ones presented in this report is interesting because one can observe the development ind extension of various producing trends. Seeing the growth of such trends is encouraging because with continued future exploration developments, the trends evident today may be extended even further. Good overviews of Kansas stratigraphy and geology can be obtained in Zeller (1968) and Merriam (1963). Several oil and gas fields are individually discussed in a five-volume set published by the Kansas Geological Society (1956, 1969, 1960, 1965, 1986) in Wichita, Kansas. The Kansas Geological Society volumes include maps and well-log correlations over individual fields, which can be particularly helpful to explorationists.
Acknowledgments--The authors gratefully acknowledge the help of Charlie Ross with the computer programming, Renate Hensiek and Pat Acker for preparation and drafting of some of the original figures, Jennifer Sims for preparation of graphics and the cover design, Lee Gerhard and Rex Buchanan (Kansas Geological Survey) and Jock Campbell (Oklahoma Geological Survey) for their helpful suggestions and encouragement, and Lea Ann (Millikan) Davidson who patiently typed the original manuscript of this report and its numerous subsequent revisions.
The Central Kansas uplift and Nemaha uplift are two major post-Mississippian structural highs that dominate the subsurface geology of Kansas (figure 2). These features and the basins adjacent to them have little or no expression at the surface, hence their discovery and subsequent delineation are largely based on the results of exploratory drilling. The Nemaha uplift was initially recognized as a major subsurface feature about 1915, and was formally named in a 1917 treatise on Kansas oil and gas by Moore and Haynes (1917). The Nemaha uplift is a complex north-northeast-south-south west oriented feature which extends into Nebraska and Oklahoma. It is asymmetric with a gently dipping western flank and a faulted eastern flank. The Humboldt fault system (Condra, 1927) marks the boundary between the Nemaha uplift and the Cherokee and Forest City basins to the east (McQueen and Green, 1938).
Figure 2--Post-Mississippian structural features of Kansas (from Merriam, 1963).
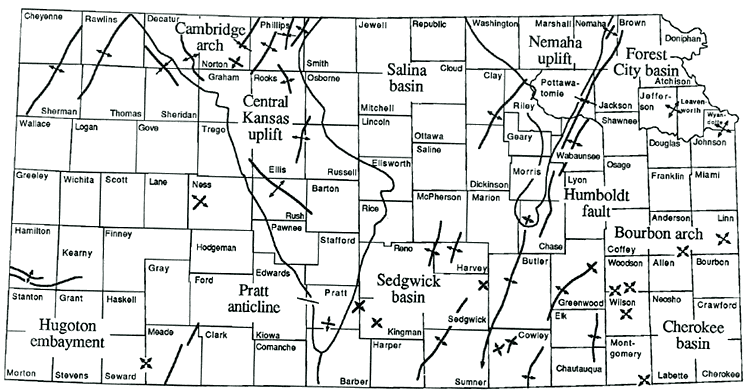
Parts of the Central Kansas uplift were recognized as early as the 1920s, but Morgan (1932) formally named it and recognized its regional significance. The Central Kansas uplift is more symmetric than the Nemaha uplift. It trends northwest-southeast and is the locus of most of the major oil fields in the state. The basin lying between the Central Kansas uplift and Nemaha uplift was formally recognized and named the Salina basin by Barwick (1928).
The Pratt anticline extends southward from the Central Kansas uplift and separates the Hugoton basin (Maher and Collins, 1948) in southwest Kansas from the Sedgwick basin Moore and Jewett, 1942) in south-central Kansas. The Hugoton and Sedgwick basins are structural embayments on the northern flank of the deeper Anadarko basin that extends across most of Oklahoma. Basement rocks in Kansas are buried deepest (-6,900 feet subsea [-2,100 m]; Cole, 1976) in the Hugoton basin near the Kansas-Oklahoma state line in southern Meade County.
Most of the major, present-day structural features in Kansas, including the Nemaha and Central Kansas uplifts, were largely created by geologic deformation in Late Mississippian to Early Pennsylvanian time (Merriam, 1963). Before these late Paleozoic features were formed, a broad northwest-southeast-trending structural high dominated the geology of the state in Ordovician and Devonian time (figure 3). This feature is called the Central Kansas arch in south-central Kansas; its northwest and southeast extensions are respectively called the ancestral Central Kansas uplift and the Chautauqua arch (Merriam, 1963).
Figure 3--Pre-Mississippian-Post Ordovician structural features of Kansas (from Merriam, 1963).
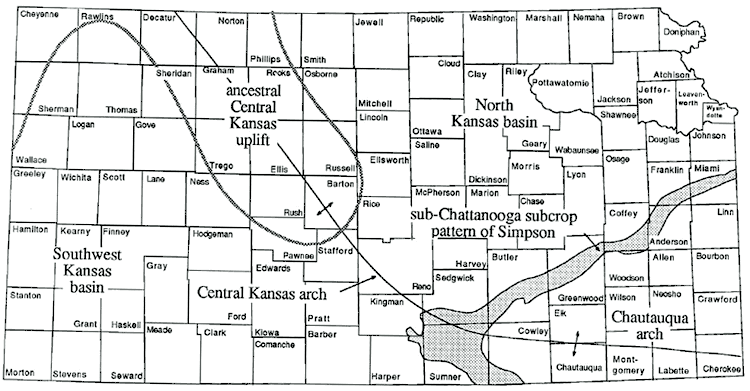
North of the Central Kansas-Chautauqua arch, a large basin developed, called the North Kansas basin by Rich (1933). With the development of the Nemaha uplift, the North Kansas basin was split into the Forest City and Salina basins (Lee, 1956). Aside from major structural features such as the Central Kansas-Chautauqua arch, pre-Mississippian geologic structures in Kansas are difficult to recognize because their original geometry has been considerably altered by the more severe Late Mississippian-Early Pennsylvanian structural movements.
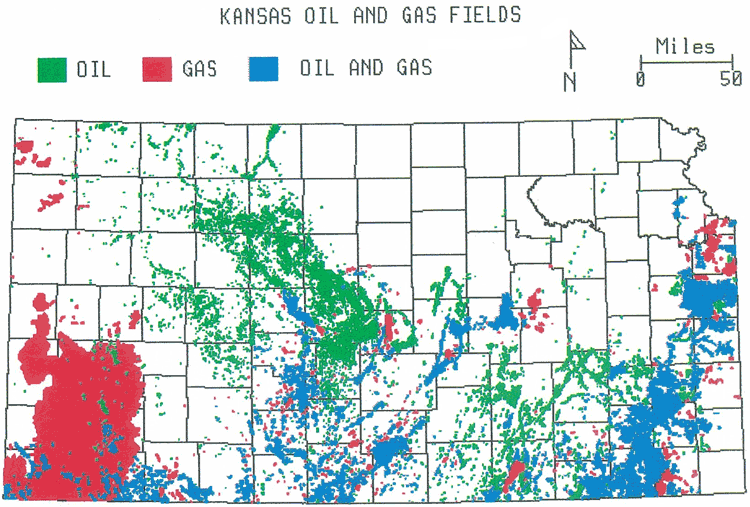
Figure 4 is a smaller version of the 1:500,000 map of oil and gas fields in Kansas (Paul and others, 1982). Petroleum production has been an important component of the Kansas economy for most of the twentieth century. Today the state ranks eighth among all states in annual oil production and fifth in annual gas production, with respectively 2.28 and 2.33% of the total U.S. marketed production (Paul and Beene, 1985). Over 71 million barrels of oil and 430 billion cubic ft of gas were produced in Kansas in 1983.
Figure 4--Oil and gas fields of Kansas (by field outline).
In the last 30 years, smaller oil pools have been the usual type of new discovery. In any exploration area, larger fields are characteristically found early but as the area becomes more completely explored, smaller and smaller fields are found (Meyer and Fleming, 1985). The numerous small fields currently being discovered in Kansas are therefore a natural reflection of its exploration maturity. Despite the smaller size of the new discoveries, several are made each year that extend old exploration trends and establish new ones.
At present, total proven oil reserves in Kansas are approximately 370 million barrels of oil. Original oil-in-place is estimated to have been 16.6 billion barrels, of which about 5 billion have probably been produced (Watney and Paul, 1983). In analyzing the distribution of oil fields by cumulative production for a period from 1890 to 1973, Harbaugh and Ducastaing (1981) concluded that the next 598 fields discovered (20% of the 1973 total) would contribute only 2 or 3% more to the total oil discovered in Kansas through 1973, approximately 55 million barrels. The succeeding 20% of the fields would contribute 48 million barrels. Enhanced oil-recovery techniques will no doubt provide for some of the recovery of 11.6 billion barrels still remaining in the ground. Total extra oil that may be produced by enhanced oil-recovery techniques may be approximately 2-3 billion barrels (Ebanks, 1975).
Approximately 34% of the volume of produced oil and known reserves of oil in Kansas have come from Pennsylvanian rocks (Adler, 1971). Mississippian, Devonian, and Silurian rocks account for about 14%; Middle and Upper Ordovician rocks account for about 12%, and Cambrian-Ordovician rocks account for about 40% of this total. With respect to the volume of produced and known reserves of gas, approximately 73% is from Permian rocks; about 13% is from Pennsylvanian rocks; about 11% is from Mississippian, Devonian, and Silurian rocks; and about 2% is from Cambrian-Ordovician rocks (Adler, 1971). Gas present in Cretaceous rocks in western Kansas was not considered at the time of this particular compilation.
In 1860, as early as one year after Colonel Drake's historic well first produced oil near Titusville, Pennsylvania, drilling for petroleum reportedly commenced near Paola in Miami County in eastern Kansas (Haworth, 1908; Jewett, 1954). As early as 1884, Paola was supplied with gas piped in from a nearby field. Although further sporadic drilling found minor amounts of oil and gas in subsequent years, the first significant commercial oil field in Kansas was developed near Neodesha in 1893 (Owen, 1975). In addition to further oil development, by the latter part of the 1800s, several towns in eastern Kansas utilized gas produced from nearby gas fields for heating and illumination.
Most oil and gas produced in eastern Kansas was taken from Pennsylvanian Cherokee sandstones only a few hundred feet deep. The occurrence of sand bodies in the Cherokee formation was unpredictable; hence, exploration was more a matter of serendipity and extrapolating existing trends of production than an exercise in geologic science. Nevertheless, geology benefited from the hunches of wildcatters, and the knowledge gleaned from this drilling helped establish the principles on which modern petroleum geology is based. Erasmus Haworth, one of the early state geologists of Kansas, studied the drilling results in eastern Kansas and published his findings in a classic volume (i.e. Haworth, 1908) that related the occurrence of oil and gas to both structural traps (anticlinal closures) and stratigraphic traps (linear "shoestring" sand bodies). The origin and known distribution of the Cherokee shoestring sandstones were further elaborated upon by Bass (1934, 1936) and Bass and others (1937).
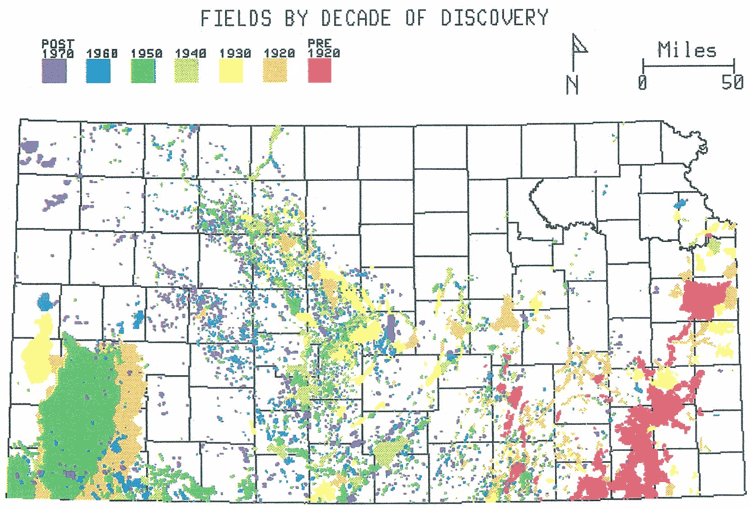
Figure 5 shows that most of the larger fields in eastern Kansas were discovered by 1920. Drilling continues in this region though, and small fields, new pay zones, and field extensions are still being discovered by individuals and small independent oil and gas companies.
Figure 5--Fields by decade of discovery.
The halcyon days of Kansas petroleum production were ushered in with the discovery of the El Dorado and Augusta fields in 1914 in Butler County. Since then the oil production of Kansas has generally increased until it peaked at 124.7 million barrels per year in 1956 (Oros, 1979). El Dorado, the most prolific oil field in Kansas, has produced over 290 million barrels of oil (see table 1). Both El Dorado and Augusta are structural traps associated with folding and faulting Oil the Nemaha uplift (Fath, 1921; Berry and Harper, 1948). Their discovery was largely based on surface mapping and as such, they represent some of the first fields found in the Midcontinent using science rather than "trendology" and luck (Owen, 1975). The conspicuous production of these fields also played a key role in assuring the success of the small oil companies, which eventually evolved into Cities Service Oil Company.
Table 1--Most significant established fields in Kansas. BO, barrels of oil; MMCF, million cubic feet (Shirley Paul, personal communication, 1987).
| Oil | ||||
|---|---|---|---|---|
| Geological province & field | Discovery date |
County or area | 1986 production | Cumulative recovery (through 1986) |
| Nemaha uplift | ||||
| El Dorado | 1915 | Butler | 1,147,100 BO | 290,993,500 BO |
| Central Kansas uplift | ||||
| Chase-Silica | 1931 | Stafford, Barton, Rice | 1,185,300 BO | 264,667,300 BO |
| Bemis-Shutts | 1928 | Rooks, Ellis | 1,231,800 BO | 237,589,600 BO |
| Trapp | 1936 | Russell, Barton | 1,339,500 BO | 223,966,500 BO |
| Hall-Gurney | 1931 | Russell, Barton | 1,241,700 BO | 143,961,100 BO |
| Kraft-Prusa | 1937 | Russell, Barton, Ellsworth | 591,100 BO | 129,061,300 BO |
| Gorham | 1926 | Russell | 520,300 BO | 91,482,400 BO |
| Geneseo-Edwards | 1934 | Rice, Ellsworth | 272,800 BO | 84,038,900 RO |
| Sedgwick basin | ||||
| Burrton | 1931 | Reno, Harvey | 513,300 BO | 73,460,900 BO |
| Ritz-Canton | 1929 | McPherson | 355,300 BO | 70,960,600 BO |
| Gas | ||||
| Geological province & field | Discovery date |
County or area | 1985 production | Cumulative recovery (through 1985) |
| Anadarko basin | ||||
| Hugoton Gas Area | 1922 | southwest Kansas | 316,550 MMCF | 18,386,750 MMCF |
| Panoma Gas Area | 1956 | southwest Kansas | 80,090 MMCF | 1,188,460 MMCF |
| Greenwood Gas Area | 1952 | southwest Kansas | 4,700 MMCF | 954,800 MMCF |
| Sedgwick basin | ||||
| Spivey-Grabs-Basil | 1949 | Harper, Kingman | 12,590 MMCF | 661,860 MMCF |
| Anadarko basin | ||||
| Glick | 1957 | Kiowa, Comanche | 5,050 MMCF | 343,460 MMCF |
| Sedgwick basin | ||||
| Medicine Lodge-Boggs | 1927 | Barber | 1,120 MMCF | 340,510 MMCF |
| Anadarko basin | ||||
| Bradshaw | 1937 | Hamilton, Greeley | 4,070 MMCF | 163,570 MMCF |
| McKinney | 1950 | Meade, Clark | 3,990 MMCF | 154,520 MMCF |
| Sedgwick basin | ||||
| Aetna | 1935 | Barber, Comanche | 2,090 MMCF | 148,100 MMCF |
| Hardtner | 1954 | Barber | 900 MMCF | 121,330 MMCF |
With the discoveries on the Nemaha uplift, exploration attention gradually focused westward in Kansas. Additional fields on the western flank of the Nemaha uplift were soon put into production. These fields included the Elbing field in Butler County and the Peabody, Covert-Sellers, and Florence fields in Marion County (Thomas, 1927). In 1919, the Walton field was discovered in Harvey County and was the first field to produce oil in the west ranges of Kansas and the Sedgwick basin (Jewett, 1954). In 1923, the first oil on the Central Kansas uplift was discovered with the opening of the Fairport field in Russell County (Oros, 1979). This field, like the El Dorado field, was prospected by surface geologic mapping (Allan and Valerius, 1929). Just before the discovery of the Fairport field, the Covert-Sellers field in Marion County was the farthest northwest in Kansas. The Fairport discovery was 120 mi farther northwest, and its discovery certainly surprised oil men of that era (Owen, 1975).
In the mid-1920s to the early 1930s, both surface-structure mapping and random drilling found new large fields on the Central Kansas uplift. Significant fields found early on the Central Kansas uplift include the Gorham and Hall-Gurney fields in Russell County, the Trapp field in Russell and Barton counties, the Bemis-Shutts field in Ellis County, and the Chase-Silica field in Rice and Barton counties (Owen, 1975).
Although exploration and development on the Central Kansas uplift continues at a brisk pace, and several small fields are still being found, most of the larger fields in this geologic province were found by the 1950s. According to Petroleum Information (1982), the density of new-field wildcat wells on the Central Kansas uplift is the greatest of any province in the United States. The Central Kansas uplift also usually leads the state in the number of discoveries per year (Watney and Paul, 1983).
During the 1930s and 1940s, most of the larger fields in the Sedgwick basin and southern Salina basin were discovered by a variety of methods including shallow core-hole drilling, surface and subsurface mapping, and geophysical techniques (Merriam and Hambleton, 1959; Owen, 1975). Exploration south and west of the Central Kansas uplift has proceeded more slowly with most of the major discoveries occurring between 1940 and 1960. Most of the recent exploration successes in the state have been with several small fields discovered in a northwest-southeast-oriented trend straddling Ness, Gove, Lane, and Hodgeman counties southwest of the Central Kansas uplift.
The greatest single deposit of gas in Kansas is the Hugoton gas field, which covers several counties in southwestern Kansas. This field continues southward into the panhandles of Oklahoma and Texas and can also be identified in publications as the Panhandle-Hugoton field or Hugoton-Panhandle field, depending if the writer is a Texan or Kansan (Owen, 1975). Due to its vast extent, it was not recognized as a single entity until the late 1920s. The discovery of the Kansas sector of the field is generally considered to be in 1922, with the drilling of an exploratory well (Defenders and Traders Gas, Co. No. 1 Boles) near Liberal in Seward County (Hemsell, 1939; Page, 1940; Hinton, 1952; Mason, 1968; Pippin, 1970; Owen, 1975). The ultimate recovery of the Hugoton-Panhandle field is estimated to be approximately 70 trillion cubic ft of gas (Pippin, 1970) and as such, it ranks as one of the greatest gas fields in the world. It may eventually produce 10% of the gas ultimately recovered in the United States (Mason, 1968).
Significant exploration plays have periodically developed in Kansas over the last three decades. In the late 1940s and early 1950s, the Forest City basin in the northeastern part of the state experienced a round of exploration activity after the discovery of the Davis Ranch field in Wabaunsee County (Jewett, 1954). Subsequent discoveries defined a trend of fields that extend along the axis of the basin all the way up into southeastern Nebraska. Activity in the Forest City basin has recently revived with the discovery of the McClain field in Nemaha County in 1982 (McCaslin, 1982).
In the 1970s, gas accumulations in the Cretaceous Niobrara Chalk in northwestern Kansas became attractive exploration targets. This trend continues into adjacent states (Hanley and Van Horn, 1982) and could be expanded over the next few years, provided gas prices remain firm. Oil fields in southwestern Kansas, underneath the Hugoton gas field and on the southwest flank of the Central Kansas uplift, are also recent significant exploration plays that have been substantially extended during the 1970s. These fields in general are associated with unconformities developed in and between Mississippian and lower Pennsylvanian strata. It is anticipated that many more fields will be discovered in this region (Watney and Paul, 1983).
In addition to knowing the geographic distribution of petroleum production with regard to stratigraphic units and depth, it is also important to understand how petroleum is volumetrically distributed around the state. Records of petroleum production have been kept by the Kansas Corporation Commission and the Kansas Geological Survey for a number of years (cf., Paul and Beene, 1983; Kansas Corporation Commission, 1987) but translating this data into meaningful maps carries some unique challenges. Different areas of the state have been important at different times with regard to petroleum production. For instance, the Cherokee basin in eastern Kansas and Oklahoma was once one of the most important sources for oil in the United States (Owen, 1975), but now many of the most prolific producing fields have been abandoned or presently are dominated by stripper production. Although a field may have produced prolific amounts of petroleum, it may now be a newly exhausted natural resource except through application of enhanced oil-recovery methods, whereas a much smaller field with less ultimate reserves may presently be producing considerably more petroleum. Expressing these differences on maps can be difficult, so the authors have constructed a series of maps in which petroleum fields are differentiated based on attributes concerning cumulative production and recent yearly production. By comparing the recent yearly production with the historic production, the reader may gain an appreciation for past, present, and even future importance of petroleum production in Kansas.
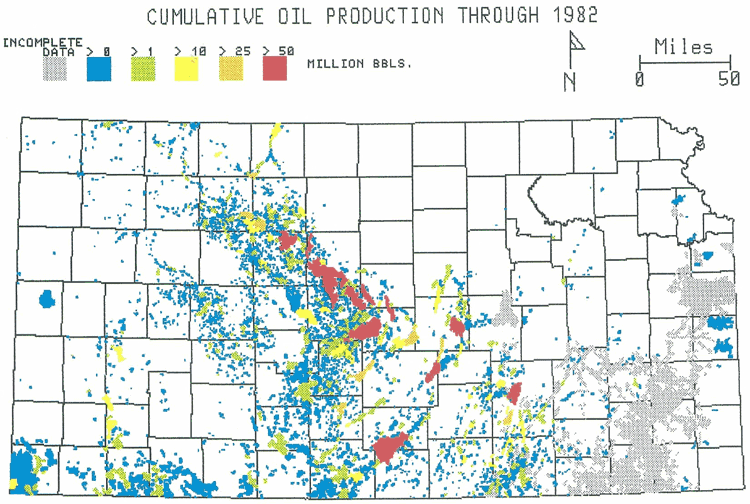
Figures 6 and 7 are color-coded maps expressing cumulative production of oil and gas fields in Kansas through 1982. Except for larger fields, detailed production records have not been kept for discoveries before 1944; therefore, many older fields (particularly those in the Cherokee basin in the eastern part of the state) cannot be considered in the maps in this report, which express various aspects of production volume.
Figure 6--Cumulative oil production through 1982.
All figures displaying field outlines utilize production data collected through 1982 (cf., Paul and Beene, 1983). Field outlines are in digital form and are the same ones used in the latest computer-generated oil and gas map of the state published in 1982 (Paul and others, 1992). Acreages used in calculations of "productivities" (volume of production per acre) for oil and gas fields also were computed utilizing their digitized outlines.
Figure 6 illustrates that most large oil fields in the state reside in a northwest-southeast trend along a crest of the Central Kansas uplift called the Russell rib. However, the El Dorado field, the largest oil field in Kansas, is situated athwart a structural culmination of the Nemaha uplift. Although these fields were discovered several decades ago, they are still producing several hundred-thousand barrels of oil each year (table 1).
The cumulative production of a field depends primarily on the length of time and rate it has been producing oil or gas. The rate of oil production varies throughout the life of a field according to its stage of development. After a field has been discovered, outpost wells are then drilled to find the boundaries of the field. During and shortly after this period of delineation, a field usually undergoes a primary phase of production that utilizes the initial elevated pressure of the fluids in the reservoir to help recover the oil. The rate of production is usually very high during this time. Once the primary energy of a reservoir dwindles and wells tapping the reservoir consequently experience a decrease in their rate of production, a phase of secondary recovery may be initiated by the operators of the field to reinvigorate the rate of production and increase the efficiency of oil recovery. Secondary recovery practices include pressure-maintenance procedures such as gas injection or water flooding.
Additional variables that influence cumulative production, illustrated in figures 6 and 7, include the reservoir volume of the field revealed in part by its areal distribution, the number of reservoirs or pay zones, and the number of wells that produce from the field. The production capacity of the wells and their spacing also are important. Reservoir permeability greatly influences the production capacity of wells, whereas the spacing of wells can be critical in efficiently producing possible isolated volumes of hydrocarbons in a heterogeneous reservoir. For gas fields, pressure can be a major factor in determining production capacity and volume because a given volume of a high-pressure reservoir will hold many more times the gas than the same volume at a lower pressure.
Figure 7--Cumulative gas production through 1982.
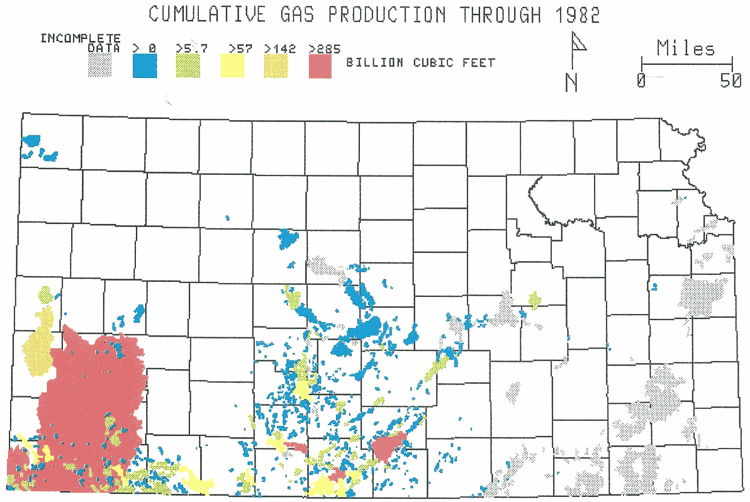
Figure 7 illustrates cumulative production from gas fields in Kansas. The largest gas fields are in the southwestern part of the state where the vast Hugoton, Panoma, and Greenwood fields produce from Pennsylvanian and Permian rocks in the Hugoton embayment of the Anadarko basin. The scale divisions of the cumulative-oil-production map (figure 6) and cumulative-gas-production map (figure 7) are roughly correlative in that for purposes of comparing volumetric information on oil and gas fields, approximately 5,700 cubic ft of gas is equivalent to a barrel of oil (Harbaugh and Ducastaing, 1991). The cumulative-production maps for oil and gas illustrate that there are numerous small fields in Kansas but few large fields. This type of distribution has been described as a "logarithmic decline" by Harbaugh and Ducastaing (1981). Despite their age, large fields still supply a considerable portion of the total production of the state.
Comparison of the cumulative-oil-production map (figure 6) with the cumulative-gas-production map (figure 7) indicates a general southward decrease of oil production which correlates with a concomitant southward increase in gas production in central and western Kansas. Fields on the northern part of the Central Kansas uplift and northeastern flank of the Hugoton embayment of the Anadarko basin produce little or no gas, whereas deeper fields in the Anadarko and Sedgwick basins produce large amounts of gas with comparatively little or no oil. Several fields produce both oil and gas. Natural gas produced in such fields may not necessarily come from the same pay zone as the oil. However, in many cases gas is produced from the same reservoir as the oil, either dissolved in the oil and co-produced during extraction, or produced from different wells if the gas is present as a separate phase in the reservoir (usually as a gas cap trapped above the oil).
One way of expressing the approximate gaseousness of a field producing both oil and gas is to calculate a gas-to-oil ratio for the field using records on its cumulative oil and gas production. The gas-to-oil ratio for fields in figure 8 is expressed in terms of standard cubic feet of gas per barrels of oil (SCF/BBL). One SCF is a cubic foot of gas at atmospheric pressure (14.7 psi) and 60° F. The scale is an exponential scale with 5.E2, 5.E3, 5.E4, 5.E5, and 5.E6 respectively representing 500; 5,000; 50,000; 500,000; and 5,000,000 SCF/BBL. Fields producing only gas or only oil are not shown on this map.
Figure 8--Ratio of gas to oil through 1982.
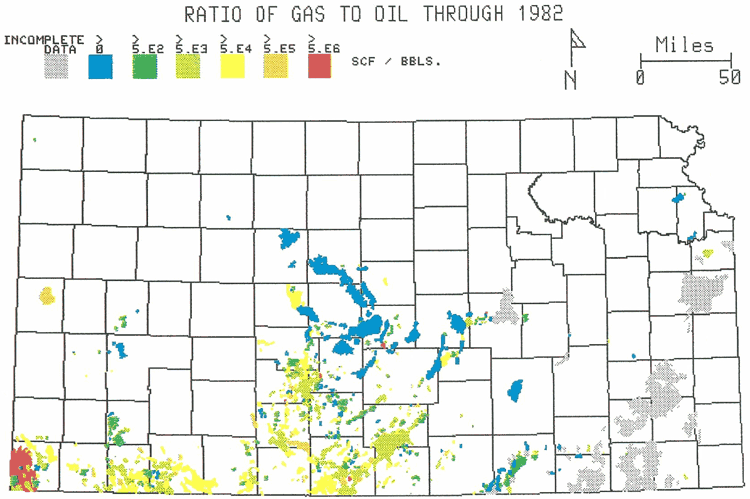
Figure 8 indicates gas-to-oil ratios for fields in Kansas generally increase southward toward the Anadarko basin. Relatively deep fields near the Oklahoma state line generally have the highest gas-to-oil ratios, whereas relatively shallow fields farther north along the Central Kansas uplift have very low gas-to-oil ratios.
Walters (1958) attributes the pattern of southward-increasing gaseousness to a process of "differential migration." This process assumes a prolific amount of oil and gas could have been generated in the deeper and hotter parts of the Anadarko basin in Oklahoma. This oil and gas would migrate updip by buoyancy through porous and permeable rocks northward into Kansas, filling many small and large structural and stratigraphic traps along the way. Oil and gas could then segregate by density in each trap, hence gas would be found at the top of a trap whereas oil would be found below the gas in lower parts of the trap. With additional migration of oil and gas into the trap or by decreasing the volume of the trap by structural tilling, reservoir fluids could leak out of the trap through a spillpoint that would be located in the structurally lower part of the trap. Oil, by virtue of its higher density and consequently lower position in the reservoir, would likely spill out of the trap before the overlying gas and continue moving farther updip. The net effect of several such fill-and-spill episodes would be to systematically decrease the gas-to-oil ratio for a series of fields in the updip (shallowing) direction along a migration path.
Another way to consider production data is to compare the cumulative production of a field with the area the field covers at the surface of the earth. According to this design, "productivity" of a field is expressed by the volume of production per acre at the surface--either barrels of oil per acre or million cubic feet of gas per acre. People who lease land for mineral rights and landowners may be particularly interested in this type of information.
Table 2 lists the most productive fields in Kansas oil a production-per-acre basis. Comparison of this list to table 1 indicates that the largest fields, with respect to cumulative production, are not necessarily the richest fields if cumulative production per surface-acre ("productivity") is considered. Most oil fields having the greatest "productivity" in Kansas are curiously a group of venerable fields situated very close to each other on the Nemaha uplift and the eastern flank of the Sedgwick basin in Sumner, Cowley, Butler, and Sedgwick counties. Most of these fields are structural traps with several pay zones in Pennsylvanian and lower strata. El Dorado, the largest field in Kansas, is not sufficiently "productive" to be in table 2, but nevertheless, as of 1982, it had a very respectable cumulative "productivity" of 9,899 barrels of oil per acre and ranked 12th out of 3,690 oil fields evaluated.
Table 2--Most productive fields in Kansas on basis of production per surface acre. BO, barrels of oil; MMCF, million cubic feet of gas; BO/Acre, barrels of oil per acre; MMCF/Acre, million cubic feet of gas per acre.
| Oil | |||||
|---|---|---|---|---|---|
| Geological province & field | Discovery date |
County or area | Cumulative recovery (through 1982) |
Acreage | Productivity |
| Nemaha uplift | |||||
| Churchill | 1926 | Summer, Cowley | 20,470,228 BO | 974 | 21,020 BO/Acre |
| Oxford | 1927 | Summer | 17,695,414 BO | 1,158 | 15,280 BO/Acre |
| Slick-Carson | 1924 | Summer, Cowley | 15,877,768 BO | 1,139 | 13,940 BO/Acre |
| Forest City basin | |||||
| Davis Ranch | 1949 | Wabaunsee | 7,648,923 BO | 625 | 12,240 BO/Acre |
| Nemaha uplift | |||||
| Augusta North | 1914 | Buder | 16,406,448 BO | 1,379 | 11,900 BO/Acre |
| Sedgwick basin | |||||
| Valley Center | 1928 | Sedgwick | 23,453,102 BO | 2,108 | 11,130 BO/Acre |
| Caldwell | 1929 | Sumner | 1,823,329 BO | 165 | 11,050 BO/Acre |
| Guelph | 1951 | Sumner | 3,704,610 BO | 341 | 10,860 BO/Acre |
| Voshell | 1929 | McPherson | 32,442,900 BO | 3,101 | 10,460 BO/Acre |
| Nemaha uplift | |||||
| Hittle | 1925 | Cowley | 10,395,550 BO | 1.024 | 10,150 BO/Acre |
| Gas (640 acres minimum size) |
|||||
| Geological province & field | Discovery date |
County or area | Cumulative recovery (through 1982) |
Acreage | Productivity |
| Anadarko basin | |||||
| Borchers | 1959 | Meade | 54,641 MMCF | 1,147 | 47.64 MMCF/Acre |
| Sedgwick basin | |||||
| Medicine Lodge-Boggs | 1927 | Barber | 336,897 MMCF | 16,548 | 20.37 MMCF/Acre |
| Rhodes Northeast | 1956 | Barber | 29,665 MMCF | 1,464 | 20.26 MMCF/Acre |
| Sharon Northwest | 1956 | Barber | 42,060 MMCF | 2,149 | 19.57 MMCF/Acre |
| Anadarko basin | |||||
| Richfield West | 1962 | Morton | 18,343 MMCF | 965 | 19.01 MMCF/Acre |
| Glick | 1957 | Comanche, Kiowa | 322,062 MMCF | 18,525 | 17.39 MMCF/Acre |
| Central Kansas uplift | |||||
| Unruh | 1945 | Barton | 14,745 MMCF | 1,080 | 13.65 MMCF/Acre |
| Sedgwick basin | |||||
| Boggs Southwest | 1955 | Barber | 63,694 MMCF | 4,754 | 13.40 MMCF/Acre |
| Anadarko basin | |||||
| Wilburton | 1959 | Morton | 44,054 MMCF | 3,303 | 13.34 MMCF/Acre |
| Sedgwick basin | |||||
| Donald | 1946 | Barber | 21,080 MMCF | 1,733 | 12.16 MMCF/Acre |
The cumulative oil "productivity" map for 1982 (figure 9) also indicates that several very "productive" fields are situated on the northern part of the Central Kansas uplift, particularly in parts of Russell, Ellis, and Rooks counties. Major fields in this region that have been very "productive" include the Fairport field in Russell County, the Russell field in Russell County, the Bemis-Shutts field in Ellis County, and the Ray field located at the corners of Rooks, Graham, Norton, and Phillips counties. Most fields in this part of the Central Kansas uplift produce from porous limestones and dolomites of the Arbuckle and Lansing-Kansas City groups. Figure 9 also indicates fields in southwestern Kansas are not very "productive" with respect to oil, but, as discussed above, this is due to the propensity of fields in this area to produce more gas than oil.
Figure 9--Productivity of oil fields through 1982.
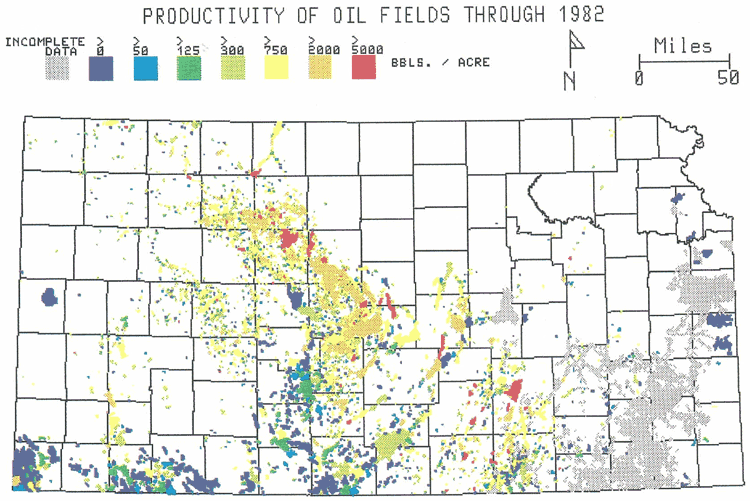
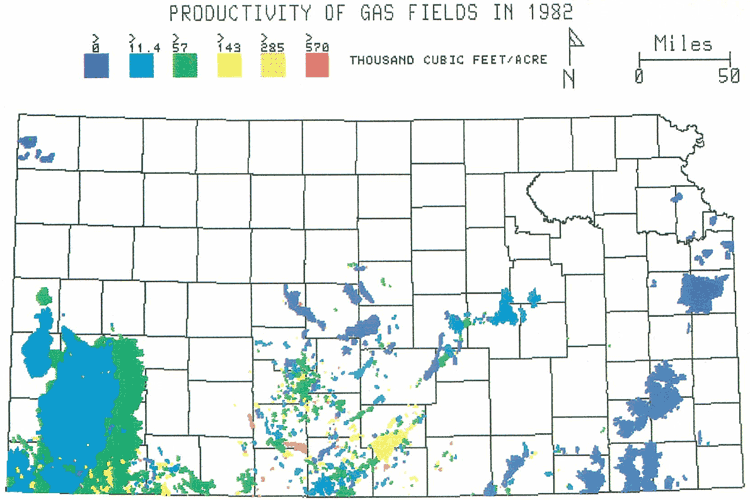
Table 2 and figure 10 indicate most gas fields with the greatest cumulative "productivities" are in the Hugoton embayment of the Anadarko basin and the adjacent western flank of the Sedgwick basin. The minimum size considered for table 2 was 640 acres (1 sq. mi). Gas fields usually have a broader spacing of wells than oil fields, so mapping field outlines for some gas fields can be more arbitrary than for oil fields. If field limits are underestimated, anomalously high productivities may be calculated, particularly for smaller gas fields.
Figure 10--Productivity of gas fields through 1982.
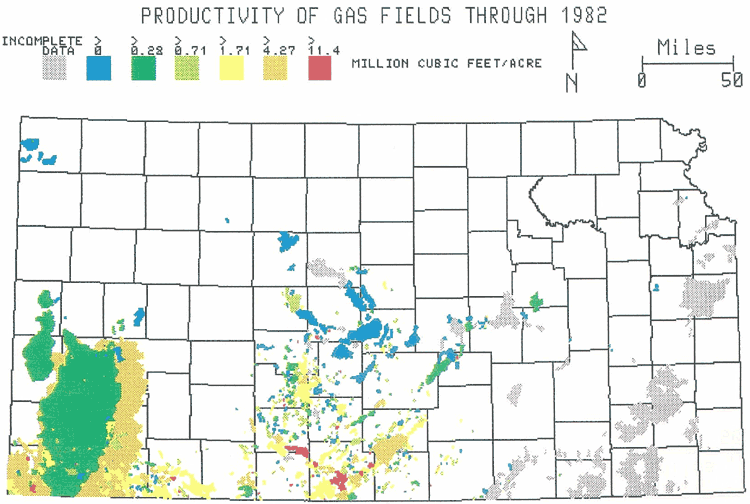
Most of the top-ten gas fields in table 2 are stratigraphic traps with most of their production coming from Marmaton, Morrow, and Mississippian pay zones. As of 1982, the Hugoton field had a cumulative "productivity" of 6.31 million cubic ft per acre and ranked 80th out of 690 gas fields considered. The prolific Panoma and Greenwood gas fields have even less cumulative production per acre than the Hugoton field; the Hugoton, Panoma, and Greenwood fields respectively rank as first, second, and third in cumulative gas production as a result of their vast size.
Figures 11 and 12 are maps respectively recording the 1982 oil and gas production per acre for fields in Kansas. Fields reporting no production for 1982 are not shown on these maps. These maps, when compared to the map showing fields by decade of discovery (figure 5), illustrate that many of the larger, older fields in the state (particularly on the Central Kansas uplift) still produce oil and gas at respectable rates comparable to many younger fields. However, figure 11 also indicates many of the more productive oil fields on a barrel-per-acre basis in 1982 are relatively small fields. Most of these fields were discovered in the 1970s and 1980s on the northern part of the Central Kansas uplift (primarily in Graham, Rooks, Trego, and Ellis counties) and on the northeastern flank of the Hugoton embayment (primarily in Gove, Lane, and Ness counties). Fields in the northern part of the Central Kansas uplift mainly produced from limestone reservoirs in the Arbuckle and Lansing-Kansas City groups, whereas fields on the northeastern flank of the Hugoton embayment generally produce from Mississippian limestone reservoirs.
Figure 11--Productivity of oil fields in 1982.
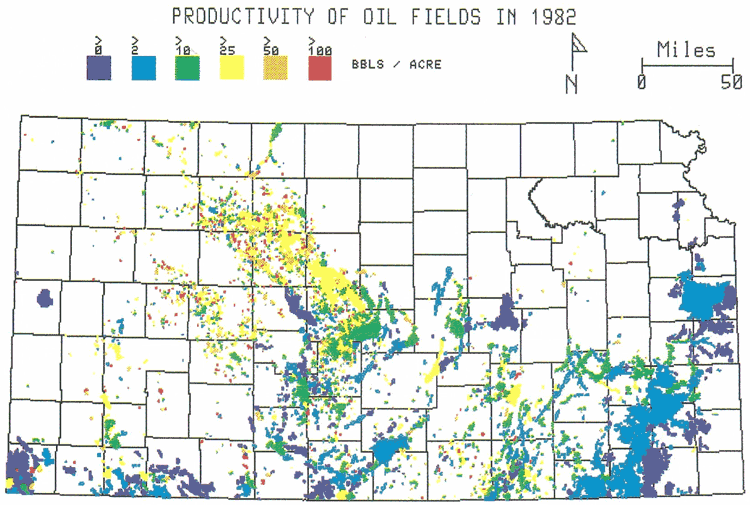
Most of the relatively young fields that display very good annual "productivities" are in an early stage of their production declines and will probably record considerably lower annual "productivities" in years to come. Many of the fields on the northern part of the Central Kansas uplift that have very good oil "productivities" for 1982 (figure 11) are located in proximity to the fields displaying high cumulative oil "productivities" (see figure 9), hence some of the younger fields in this region may also eventually register high cumulative "productivities." Although many of the oil fields in the northeastern flank of the Hugoton embayment (principally Gove, Lane, Ness, and Hodgeman counties) also display very good "productivities" for 1982, it is difficult to say whether their cumulative "productivities" will be as high as the fields on the northern part of the Central Kansas uplift. These Mississippian fields are a relatively new production trend that has not had as much time as some older trends to produce great quantities of oil, hence cumulative "productivities" for many of these fields are still relatively low. Nevertheless, detailed analyses of production declines for individual fields in the northeastern part of the Hugoton embayment probably could indicate their ultimate production and cumulative "productivity."
Figure 11 also indicates fields in southwestern and eastern Kansas display relatively low year-long oil "productivities." As stated above, the low oil "productivities" in southwestern Kansas can be attributed to the high gas-to-oil ratio of the fluids produced in this region. Conversely, fields in eastern Kansas are among the oldest in the state, hence they are well along on their production declines and this accordingly is expressed as relatively low volumes of oil per acre on the oil "productivity" map for 1982.
Figure 12--Productivity of gas fields in 1982.
The 1982 gas "productivity" map (figure 12) has less well-defined trends than the 1982 oil "productivity" map (figure 11), but it is apparent that many of the more "productive" gas fields are situated in south-central Kansas in the eastern part of the Hugoton embayment and the western part of the Sedgwick basin. Some of these fields include the Glick field in Kiowa and Comanche counties, the Pleasant Valley field in Ford and Kiowa counties, and the Sullivan field in Harper County. It also is interesting to note that in contrast to the 1982 oil "productivity" map (figure 11), there are not as many gas fields on the 1982 gas "productivity" map that are both extremely small and very "productive." The difference probably is due more to economic rather than geologic factors, in that to produce a gas field a pipeline and gathering system must be built. In some circumstances, compressor facilities also must be constructed. This can require a substantial capital investment before any gas can be sold. Small gas fields, unless they are very close to an existing pipeline, may not justify this capital investment. However, small oil fields may be more economic to produce than gas fields of comparable area because operators of small oil fields can rely on tanker trucks utilizing existing roads to haul the oil to the nearest pipeline or refinery, which is less expensive in most cases than pipeline construction.
Cumulative and annual "productivity" maps are useful as measures of the present and possibly future vitality of a producing field. In turn, this information may he helpful in evaluating exploration areas if the explorationist is reasonably confident that the known fields in the exploration area can serve as analogs to the undiscovered fields.
Next--Stratigraphic distribution of petroleum
Kansas Geological Survey, Energy Research
Placed on web June 2008; originally published 1987.
Comments to webadmin@kgs.ku.edu
The URL for this page is http://www.kgs.ku.edu/Publications/Bulletins/Sub9/index.html