| Original published in W.W. Hambleton, ed., 1959, Symposium on Geophysics in Kansas: Kansas Geological Survey, Bulletin 137, pp. 321-333 | ||
The Texas Company
The complete article is available as an Acrobat PDF file.
The Fall Creek pool, underlying parts of sec. 3, 4, 9, and 10, T. 35 S., R. 3 W., Sumner County, Kansas, was discovered on August 31, 1950, by The Texas Company No. 1 Hobbisiefkin well, which had calculated potential of 6,226 barrels of oil per day from the upper part of the Simpson Group. A seismic survey in 1949 and 1950 located the prospect and the original drilling site.
Seismic maps, prepared prior to drilling, and subsurface maps made from information derived from subsequent drilling show that the Fall Creek pool lies on a simple, slightly elongate, southwest-trending anticline. Dips on the north and east are steep, and there is a westward shift of the apex of the anticline at the top of the Marmaton as related to Viola structure. An accentuation of structural closure with depth is also discernible. The pool produced 2,055,851 barrels of oil prior to September 1, 1957.
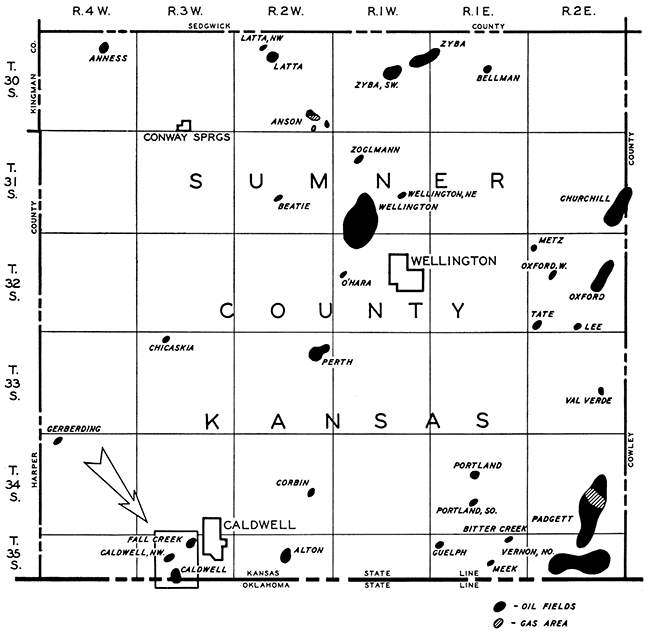
The Fall Creek oil pool is situated about 40 miles southwest of Wichita, Kansas (Fig. 1). The pool was discovered on August 31, 1950, when the Texas Company No. 1 Hobbisiefkin, in the SW NE SW sec. 3, T. 35 S., R. 3 W., was completed in the Simpson Group. Its calculated potential was 6,226 barrels of 46.3° gravity oil per day.
Figure 1--Index map showing location of Fall Creek pool and its relationship to other producing areas in Sumner County, Kansas.
The discovery well was located at the approximate top of a closed, slightly elongate, southwest-trending anticline, which was outlined in 1949 and 1950 by a reflection seismograph survey by Independent Exploration Company for The Texas Company.
The Caldwell Pool, discovered in 1929, and the two-well Caldwell Northwest pool, discovered in 1952, have been included on the geological and geophysical maps and cross section because of their proximity and structural relationship to the Fall Creek pool. These pools also produce from the upper part of the Simpson Group.
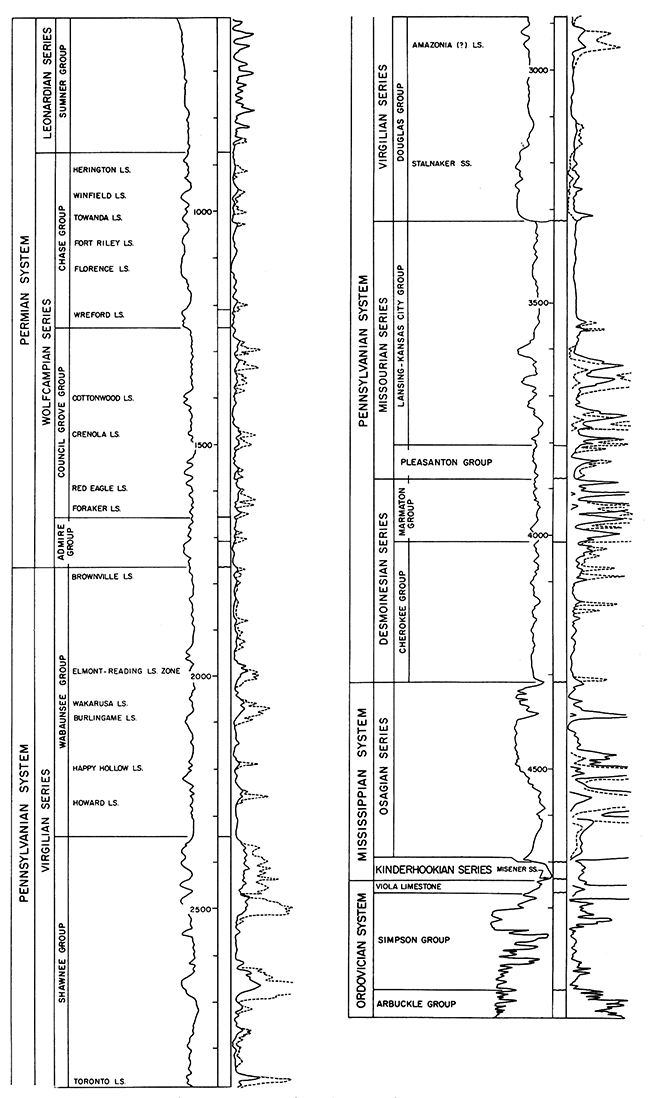
The surface rocks in the Fall Creek area consist of shale and anhydrite of the Sumner Group (Leonardian Series) of Permian age. Rocks in the subsurface are Permian, Pennsylvanian, Mississippian, and Ordovician in age. The stratigraphic section of the Fall Creek pool is compared with a composite well log (self-potential-resistivity except for gamma-laterolog in Arbuckle and Simpson rocks) in Figure 2. The Fall Creek area has been correlated with a published cross section (Lukert, 1949) based on wells located approximately 20 miles southeast of the Fall Creek area.
Figure 2--Stratigraphic section of Fall Creek pool, compared with composite well log (self-potential-resistivity except for gamma-laterolog in Arbuckle and Simpson rocks).
The Fall Creek anomaly was discovered by a semi-detailed seismic survey of southwestern Sumner County, Kansas. An Independent Exploration Company crew, R. T. Penny, Party Chief, under the supervision of F. R. Coryn of The Texas Company, was assigned the project in 1949. Seismic records in this area were of fair quality, and the conventional continuous-profiling method was used. Seismic profiles were shot along section lines at a 1,320-foot shotpoint spacing so as to form 1- by 2-mile loops.
The survey along the section lines indicated an anomaly in sec. 3, 4, 9, and 10, T. 35 S., R. 3 W., and the area was recommended for leasing. In 1950, subsequent to the leasing, additional detail points were assigned in order to evaluate the anomaly, establish critical dip, and select a wildcat location.
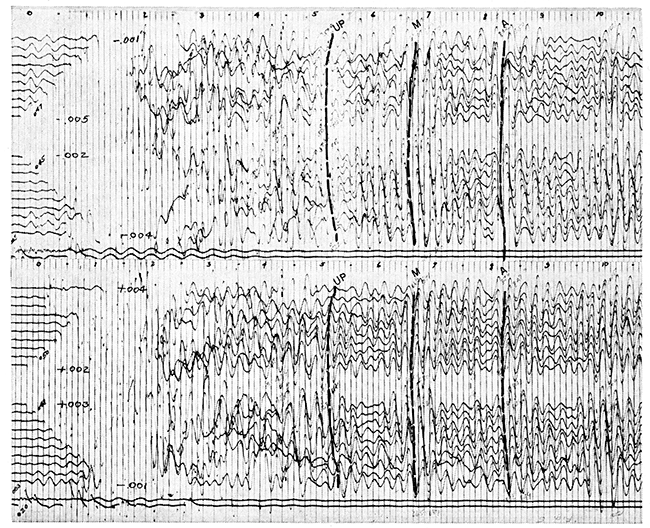
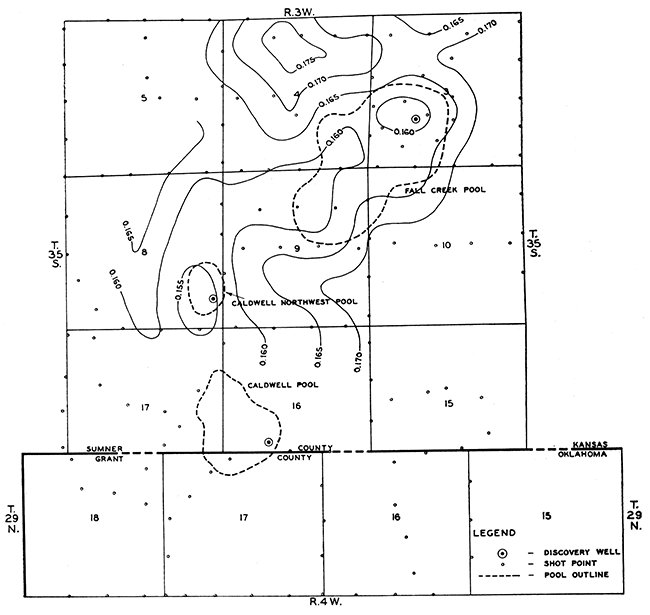
Straightforward interpretive methods were used in the discovery of the Fall Creek pool. Conventional seismic reflection maps were constructed from Marmaton (Fig. 3) and Arbuckle (Fig. 4) reflections. Figure 5 shows typical reflection records (Marmaton and Arbuckle reflections marked "M" and "A"). Continuity of the Arbuckle reflections was destroyed in places by phasing and extraneous energy return. Consequently, the interpreter relied on jump correlation in addition to continuous control, particularly on the north flank of the anomaly. An interpretation based on preliminary control indicated that there was north dip at the Arbuckle horizon. This interpretation was difficult to confirm by later detailed shooting using the continuous-control method, but drilling subsequently verified the north dip.
Figure 3--Reflection seismic map contoured on Marmaton reflection. Contour interval 50 feet.
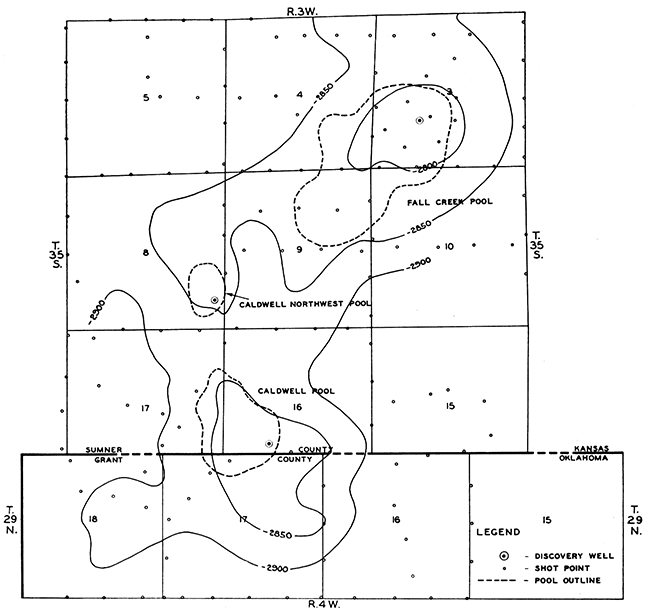
Figure 4--Reflection seismic map contoured on Arbuckle reflection. Contour interval 50 feet.
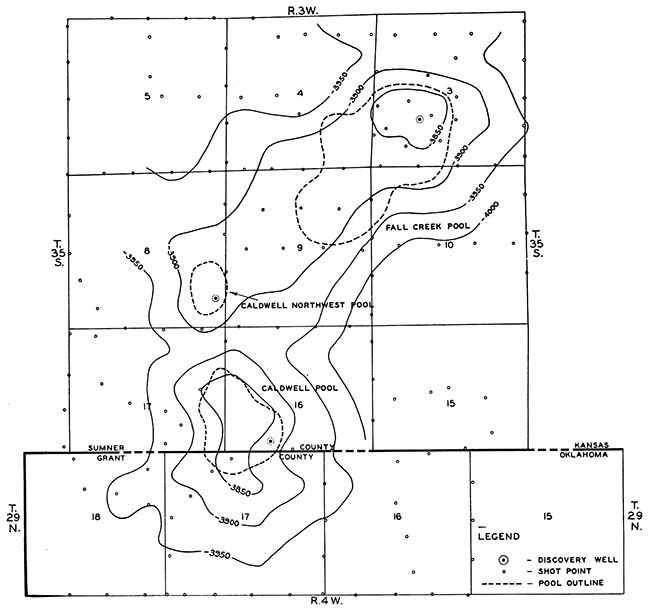
Figure 5--Typical seismograms from Fall Creek area. Marmaton reflections marked "M"; Arbuckle reflections marked "A".
After the field was developed, the seismic data were restudied for the purpose of evaluating other methods of interpreting seismic reflection data in southern Kansas where velocity variations in the shallow formations lead to erroneous structural interpretations. These methods generally involve some application of the isopach technique and depend on the availability of subsurface control and good shallow reflections.
In this case, restudy revealed no consistent Permian reflections, but a good upper Pennsylvanian reflection was recorded. A map of this reflection surface outlines the structure of the Fall Creek pool very well. Isochronous maps of the upper Pennsylvanian-Arbuckle interval (Fig. 6) and the Marmaton-Arbuckle interval (Fig. 7) reveal thickening, which is indicative of critical dip, on the north flank of the Fall Creek pool. Only a small amount of isochronal closure is shown in this area, however, and no closure could be mapped without the detail seismic control within the pool area. Thus, on the basis of isopachous interpretation, a location easily could have been made southwest of the discovery location, which would have resulted in a dry hole.
Figure 6--Isochronous map of upper Pennsylvanian-Arbuckle interval. Contour interval .005 second.
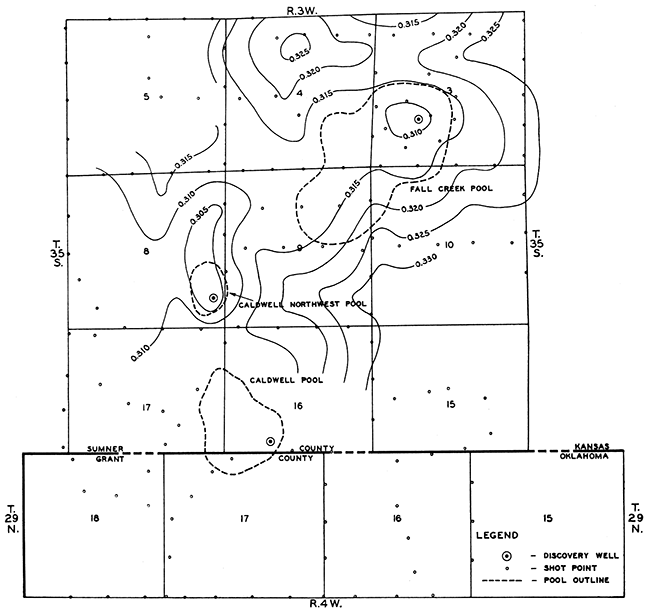
Figure 7--Isochronous map of Marmaton-Arbuckle interval. Contour interval .005 second.
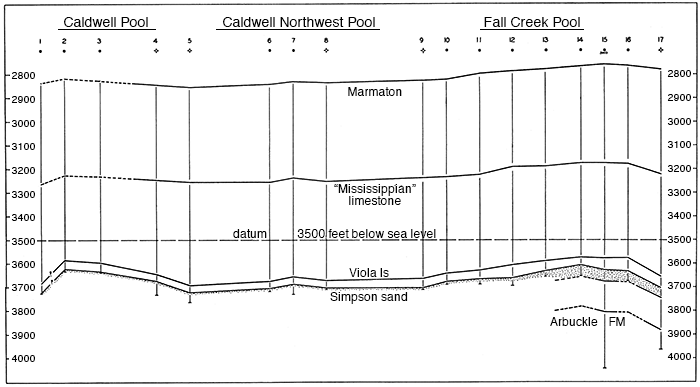
The geologic structure of the Fall Creek pool and associated pools to the southwest is portrayed on maps contoured on the top of the Pennsylvanian Marmaton Group (Fig. 8) and on the top of the Ordovician Viola limestone (Fig. 9). An isochore map of the interval between the Marmaton and the Viola is shown on Figure 10. A southwest-northeast geologic cross section (location in Fig. 11) through the Caldwell, Caldwell Northwest, and Fall Creek pools is shown in Figure 12. Because many of the well logs in the Caldwell pool are poor, the interpretation shown on the maps and cross section of this area is subject to change.
Figure 8--Subsurface structure map contoured on top of Marmaton Group. Contour interval 25 feet.
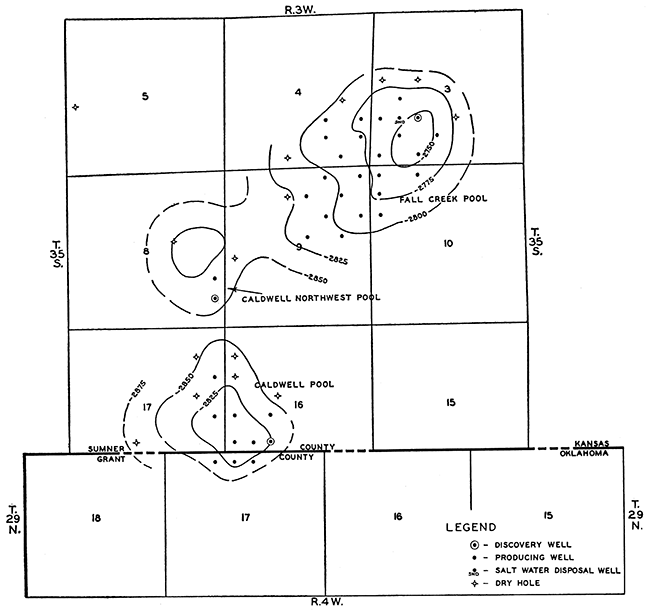
Figure 9--Subsurface structure map contoured on top of Viola limestone. Contour interval 25 feet.
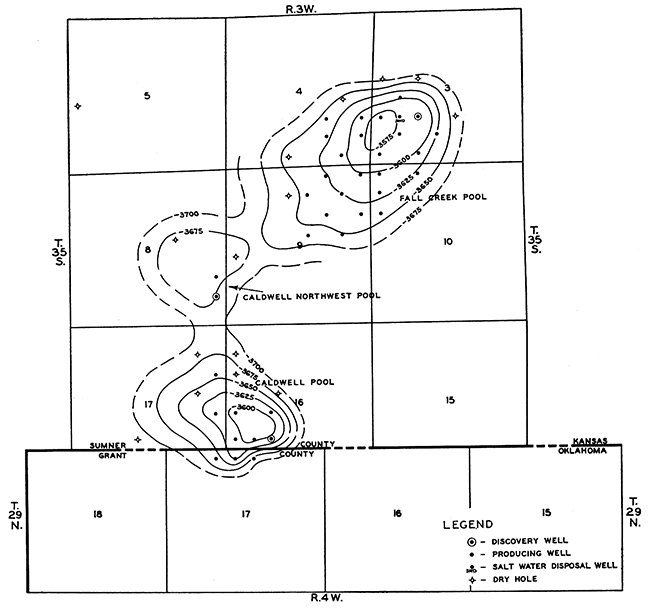
Figure 10--Isochore map of interval between top of Marmaton Group (Fig. 8) and top of Viola limestone (Fig. 9). Contour interval 25 feet.
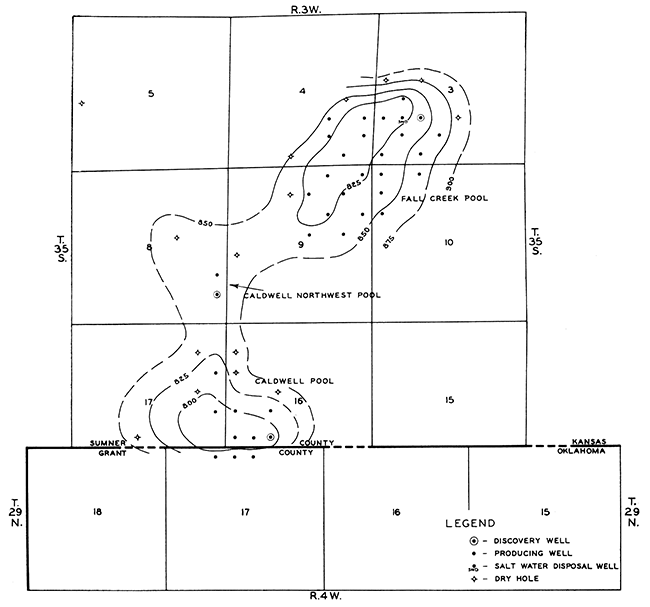
Figure 11--Index map showing location of southwest-northeast subsurface geologic section through Caldwell, Caldwell Northwest, and Fall Creek pools.
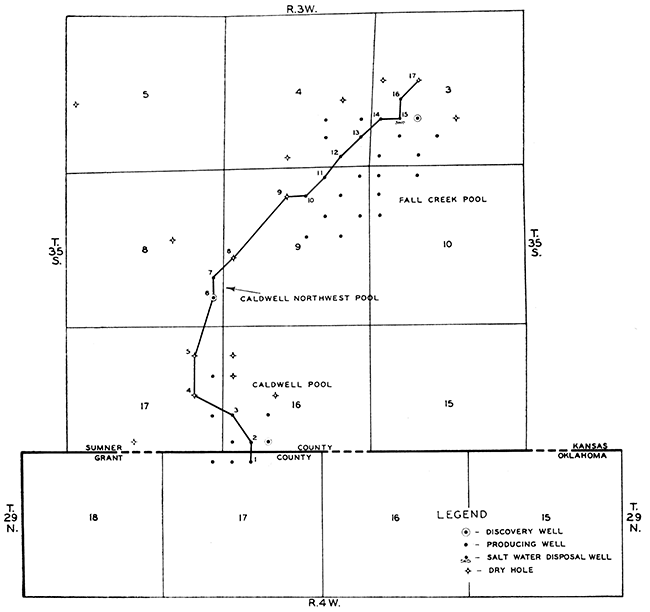
Figure 12--Southwest-northeast subsurface geologic section through Caldwell, Caldwell Northwest, and Fall Creek pools. (For location of wells, refer to Fig. 11.)
The Fall Creek pool shows a westward shift of the highest part of the anticline on the Viola map with respect to structure of the Marmaton rocks. An increase in structural closure with depth also is discernible.
Calculated pressure-bomb test potential of the No. 1 Hobbisiefkin was 6,226 barrels of 46.30 gravity oil per day; the gas-oil ratio was 900:1.
Production in the Fall Creek pool is obtained from permeable zones in dolomite, sandy dolomite, and sandstone layers in the upper part of the Simpson Group. Producing wells were drilled to an average depth of 3,675 feet below sea level; surface elevations average 1,128 feet.The pool has been defined by drilling 24 producing wells and 5 dry holes. The producing mechanism is a combination of solution-gas-drive and a partly effective edge-water drive. All royalty and working interests were unitized on November 1, 1956, in order to adopt operating methods that would conserve reservoir energy. Participation in the unit was based on acre-feet of "pay" sand distribution of the Simpson sand reservoir. The Texas Company, possessing 91 percent of the unit, was designated as Unit Operator.
At the time of unitization, the Fall Creek pool had produced 1,835,000 barrels of oil. The cumulative production prior to September 1, 1957, was 2,055,851 barrels, and the current production rate is approximately 650 barrels per day.
The geophysicist or geologist should not rely on any single method of seismic interpretation in evaluation of seismic results. Both the conventional structure maps and isopachous maps should be studied. All subsurface data should be incorporated into the interpretation, and the geologic history of the region should be known in order to determine the regional attitude of the sequence used for isopach mapping.
The writers are indebted to The Texas Company for permission to publish these data. Thanks are extended to Paul Allen for drafting the illustrations, and to all other employees of The Texas Company who have contributed in any way.
Lukert, L. H. (1949) Subsurface cross section from Marion County, Kansas, to Osage County, Oklahoma: Am. Assoc. Petroleum Geologists, Bull., v. 33, p. 131-152.
Kansas Geological Survey
Comments to webadmin@kgs.ku.edu
Web version Jan. 17, 2014. Original publication date 1959.
URL=http://www.kgs.ku.edu/Publications/Bulletins/137/Bass/index.html