Previous--Walta Field (Simpson and Mississippian), Sumner County
1Kansas Geological Survey, 2University of Missouri-Rolla, 3Continental Exploration, Inc.
This article available as an Acrobat PDF file (5 Mb).
The oil reservoir encountered by the Timmons #1 well, Wilson County, Kansas, produces from a fluvial channel sandstone facies (point bar deposit) within the Cherokee Group known commonly as the "Bartlesville" Sandstone. Hydrocarbons are stratigraphically trapped, the porous sandstone facies effectively sealed within tight, dense shales. The reservoir is characteristic of many of the Pennsylvanian pools in southeastern Kansas in that the sandstone is both shallow (335 m; 1,105 ft) and thin (3 m; 10 ft). Its thinness makes it effectively transparent or invisible to conventional seismic data. High-resolution seismic data, however, use frequencies that are harmonic with the thickness of the sandstone, creating a tuning situation and effectively a bright-spot response of the horizon when sandstone is encountered. The interpretation is validated with the observation of drape over the channel and the polarity of the reflection.
Finally, the interpretation scheme was confirmed with the drilling of Timmons #3 directly north of Timmons #1 where a reflection character similar to that under Timmons #1 is seen on Line 2. Timmons #3 encountered porous sandstone of greater thickness than that under Timmons #1.
Lower Middle Pennsylvanian sandstones of the Cherokee Group are estimated to have produced more than a billion barrels of oil in eastern Kansas over the past century. Traditionally, use of conventional CMP seismic methods has not been economically viable nor capable of detecting these sandstone lenses. However, using high-frequency CMP seismology, it is now possible to detect sandstone lenses as thin as 2 or 3 m (7-10 ft), encased in shales at depths of about 500 m (1,650 ft) or less.
Pennsylvanian strata in the area of study (Wilson County, Kansas, fig. 1) accumulated in the Cherokee basin. This shallow foreland basin is the northetn extension of the Arkoma basin. Although biostratigraphic control is poor, the basin probably began accumulating sediments during the Atokan Stage when the Arkoma basin rapidly subsided (Rascoe and Adler, 1983).
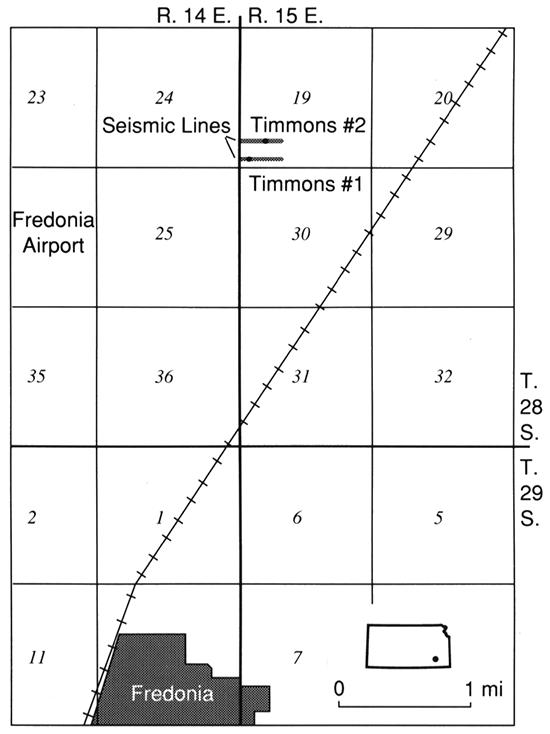
Figure 1--Map showing the locations of the example seismic lines and Timmons #1 and Timmons #2 wells.
The entire Pennsylvanian section in the study area is about 450 m (1,485 ft) thick. Cyclic Missourian carbonate-dominated units, consisting of the classical Kansas cyclothem (Moore, 1936; Heckel, 1977) extend from the surface to about 18 m (59 ft) in depth. Below these rocks lie 75 m (248 ft) of carbonate- and shale-dominated cyclothems of the Marmaton Group (Desmoinesian). Below the Marmaton Group and above the basal Pennsylvanian unconformity surface lies about 150 m (495 ft) of siliciclastic mudrock-dominant cycles that comprise the Cherokee Group. Typically these cycles (3- to 15-m [10-50-ft] thick) consist of thin black or dark-gray marine shales and locally distributed thin limestones (less than 1 m [3.3 ft] thick) that grade upwards into coarsening-upward silty and sandy shales and locally thin sandstones. These coarsening-upward siliciclastic packages are interpreted to be the result of deltaic progradation into the marine realm.
Delta plain underclays and coals cap most Cherokee cycles. Locally, Cherokee Group cycles may be partially or completely removed by incision and the resultant valleys may be filled with up to 75 m (248 ft) of sandstone. Sand-filled valleys, or shoestrings, may consist of several stacked, fining-upward successions (Staton, 1984; Brenner, 1989). Although early workers interpreted shoestring sandstones as marine barrier bars (Bass, 1936), recent workers have interpreted them to be deltaic distributary channels or upper delta-plain fluvial sands (Rich, 1923; Hulse, 1978; Staton, 1984; Walton et al., 1985; Jordan and Tillman, 1987).
The oil-productive sandstone in this investigation is referred to as upper "Bartlesville" (Bluejacket). It is confined within a valley that was incised up to 10 m (33 ft) into underlying noncyclic shales and localized coals. The lack of cyclicity in the underlying shales suggests that the upper "Bartlesville" valley may have incised into a slightly older valley, the upper part of which was filled with shale and minor coals. Insufficient control exists to map the lateral extents of the upper "Bartlesville" paleovalley; however, these valleys typically average about 400 m (1,320 ft) in width. Cores of the producing sandstone are not available and the genesis of the valley-fill sandstone is uncertain.
Sandstone in the Timmons #1 (fig. 1) is about 3 m (10 ft) thick (at 336-339 m; 1,104-1,114 ft) with an average porosity of 19.5%. The Timmons #2 well contains about 1.5 m (5 ft) of relatively tight sandstone (porosity, estimated from uncalibrated neutron logs, is about 9%). Although correlation of the sandstone between the two wells is tentative, they are probably genetically related (fig. 2).
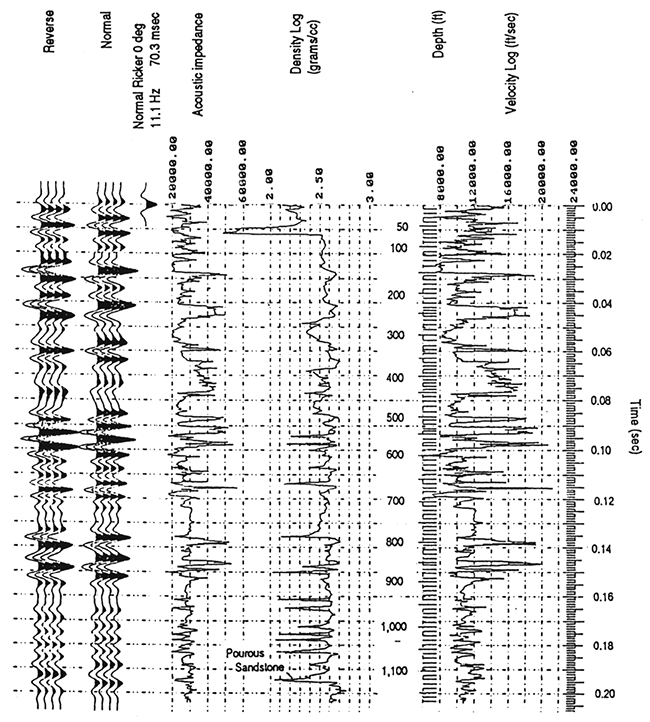
Figure 2--Integrated velocity log, density log, acoustic-impedance curve, and synthetic seismogram for the Stroud #5 well. This well encountered about 2.4 m (8 ft) of porous Cherokee sandstone at a depth of 341 m (1,119 ft). It is used as an illustrative example because of the availability of both density and sonic log control.
Oil in the reservoir is stratigraphically trapped within a thin, shallow, and porous sandstone, probably of point-bar origin. The sandstone is encased in tight shales which effectively seal the reservoir and probably serve as the source. This is an excellent example of a stratigraphic trapping of hydrocarbons in a sandstone that can be resolved on high-resolution seismic data but cannot be seen on conventional-resolution data.
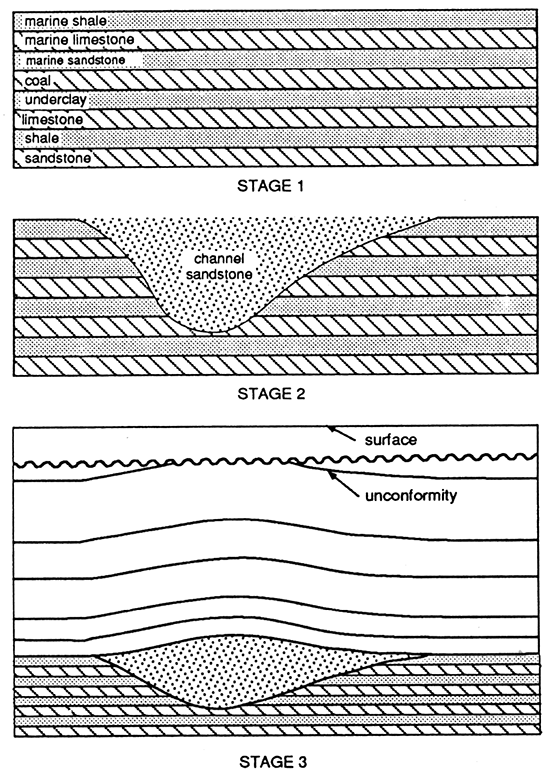
Figure 3 is a schematic diagram of the geological/morphological history of the shallow subsurface in the study area. In stage 1, a complete Pennsylvanian cyclothem has been deposited. These strata, from bottom to top, comprise a succession of nonmarine sandstone and shale, freshwater limestone, underclay and coal, and marine sandstone, limestone, and shale. In stage 2, fluvial sandstones representing the basal sediment of the overlying cyclothem are deposited in an incised channel. The channel sandstone is disconformable to the sediment of the underlying cyclothem. In stage 3, the cyclothem has gone through deep burial and subsequent uplift. It is once again proximal to the surface and is overlain by only a thin section of younger Pennsylvanian strata and a shallow veneer of Pleistocene sediment. Because of differential compaction, the pancake-layered stratigraphy of stages 1 and 2 has disappeared. The upper Pennsylvanian strata are now draped across the lensoid-shaped channel sandstone. Such drape is one of the keys, and a necessary condition, to identifying channel sandstones on seismic data.
Figure 3--Schematic showing the sequential development of a fluvial channel sandstone in a typical cyclothem sequence.
As used here, the term compaction refers to net volume loss, whether physical or chemical, that a sediment undergoes in response to burial and loading. Differential compaction refers to the variable degrees to which different sediments with the same burial history will be compacted. The susceptibility of sediments to compaction is principally, although not exclusively, a function of lithology. The processes which contribute to the overall compaction of sediment include: 1) porosity loss due to the physical compression and deformation of strata and the expulsion of pore water (principally sandstone, shales, and clays); 2) pressure solution (principally carbonates); 3) dissolution (principally evaporites); 4) oxidation of organic matter (principally coals); 5) dehydration due to temperature (principally shales and clays); and 6) diagenetic chemical transformation (such as limestone/dolomite, gypsum/anhydrite, aragonite/calcite, and within clay minerals).
As suggested by fig. 3 and as seen on the seismic section (fig. 5), the channel sandstone is less compactable than the adjacent assemblage of interlayered shales, sandstones, coals, clays, and limestones. The result is that post-channel Pennsylvanian strata are draped across the sandstone lense.
Tuning occurs when the reflection from the base of a reflector constructively interferes with the reflection from the top of the reflector when there is a polarity reversal between the upper and lower reflections. In this situation, the travel path (two times the thickness of the layer) is half a wavelength, or the reflector thickness is onefourth wavelength (fig. 4). Such thickness is termed tuning thickness. Knapp et al. (this volume, p. 39-42) show that the strongest reflections on a seismic section are not necessarily those with the largest reflection coefficient, but rather are those that are tuning. Tuning can nearly double the amplitude response, thus doubling the apparent reflection coefficient.
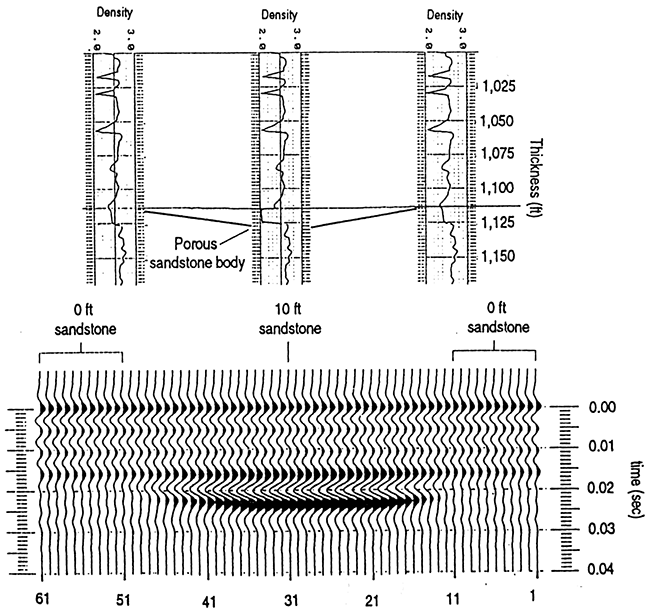
Figure 4--Synthetic seismic section illustrating the signature of a 3-m (10-ft)-thick channel sandstone.
It is common practice to estimate the thickness of a reflector using tuning principles (Widess, 1972). In this manner, reflector thickness adjusts itself to the properties of the seismic data, and its thickness at that point is thereby derived. High-resolution methods, on the other hand, in effect adjust the seismic-data properties to the reflector. To create tuning of a thin reflector, a short wavelength (high-frequency) source function must be used. When the source function contains a wavelength that corresponds to that necessary for tuning of a thin sandstone lense, that lense will produce a strong reflection amplitude, i.e., a bright spot.
Further, Knapp (1990) shows that a particular thickness of cyclothem will tune to a particular frequency when that frequency is contained in the source function. This has two implications. First, data with a large bandwidth will be able to tune to more varieties of reflector thickness. This is the definition of high-resolution, a combination of high frequency (short wavelength) and broad bandwidth. Second, thickness of the pay zone can be estimated from the apparent frequency of the reflector.
Twenty-four-fold CMP data (Mayne, 1962) were obtained along two west-east-oriented lines 470 m (1,551 ft) long (fig. 1). Line 1 passed through the Timmons #1 well where 3 m (18 ft) of reservoir sandstone were known to be. Line 2 passed through the Timmons #2 well where the sandstone was tight.
Group interval was 10 m (33 ft). Geophones were fixed in position and the source was shot through. The line used half-integer (5-m [16.5-ft] in-line offset) geometry (Knapp, 1985) and a lateral offset of 10 m (33 ft), The resulting near offset was 11 m. Due to cable restrictions only 36 channels could be recorded at a time, although the system had 48-channel capability. Geophones were Mark 23E models of 40-Hz natural frequency. Three bunched geophones were used per group. Data were recorded on two piggy-backed 24-channel model ES-240l EG&G seismographs.
Seismic source was the "auger gun" (Miller et al., 1990) which screws into the ground, sealing the shot hole with the auger flighting. Air-blast is minimal and the energy coupling is maximized. The auger gun uses a blank 12-gauge shotgun shell, detonated at the bottom of 1-m (3.3-ft)-deep holes tamped with water.
Field records were 512 msec long with a sampling interval of 0.5 msec. To attenuate ground-roll noise, the records were low-cut filtered with a 70-Hz filter prior to digitization. Ground roll (and other noise) was further attenuated in processing (stacking) by use of the half-integer offset method (Knapp, 1985), stack-array principles (Morse and Hildebrandt, 1989), and correlation stack (Knapp, 1991a).
Processing followed all normal procedures except that several special steps were performed to enhance quality of the results. To improve noise reduction of the data, two steps were followed:
First, stack-array processing was performed (Morse and Hildebrandt, 1989). The stack-array concept quantifies the attenuation of ground roll and other noises by CMP stacking. It assures that both the surface and subsurface are smoothly and evenly sampled in all possible sorting of the data: common shot (field files), common receiver, and common midpoint (CMP). It assures that the effective geophone array of the CMP gather is long and evenly sampled, which results in maximum possible rejection of ground-roll noise. Without stack-array processing and/or deliberate design of field arrays, the effective array of the CMP gather is a periodic square-wave function. The consequences of such an array are that it enhances particular frequencies of ground roll that are harmonic with the effective array. This enhancement is equal in magnitude to the enhancement of the reflection signal.
Second, a correlation-stack method (Knapp, 1991a) was used to perform CMP stacking. The correlation-stack routine used performs a residual normal moveout to enhance alignment of the reflection signal, and it weights the trace of each stack according to the correlation coefficient raised to a power n. In this case, n = 4. Both these function are time-variable. In short, the correlation stack performs a time-variable optimization of the reflection stack by time shifting and trace weighting.
Finally, post-stack spectral whitening (Knapp, 1991b) was performed to recover the losses of high frequencies due to source-function attenuation and the stacking process. This process is essential to the recovery of the full potential of the data. Resolution is proportional to frequency bandwidth, and this process enhances bandwidth by recovering the amplitudes of frequencies attenuated either by transmission through the earth or by unavoidable timing errors of the reflections prior to stacking during processing. Without spectral whitening, the data contain an unfulfilled resolution potential. The trick of spectral whitening is to recover the higher frequencies of the data without unnecessarily adding high-frequency noise. Thus, it is done experimentally with processor intervention and control.
To aid the interpretation of the seismic data (figs. 5 and 6), a suite of ID synthetic seismograms were generated (figs. 7 and 4). The SP (sand present) synthetic and a synthetic seismic section were generated using the borehole density log for the Stroud #5. The SA (sand absent) synthetic A is a modified version of the SP synthetic created by replacing the porous sandstones by higher density shale. The SP synthetic C correlates satisfactorily with the seismic data of Line 1 (fig. 5) at the location of Timmons #1 (CMP 240). The SA synthetic A ties Line 2 (fig. 6) at the location of Timmons #2 (CMP 484), where the sand is absent.
Figure 5--Seismic line 1. This seismic profile ties Timmons #1 well at trace 240.
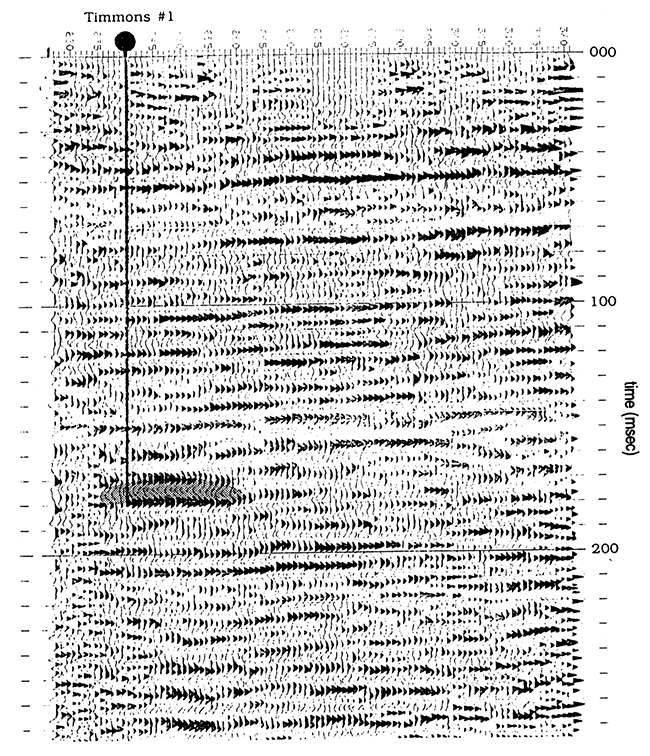
Figure 6--Seismic line 2. This seismic profile ties Timmons #2 at trace 484, and Timmons #3 at trace 440.
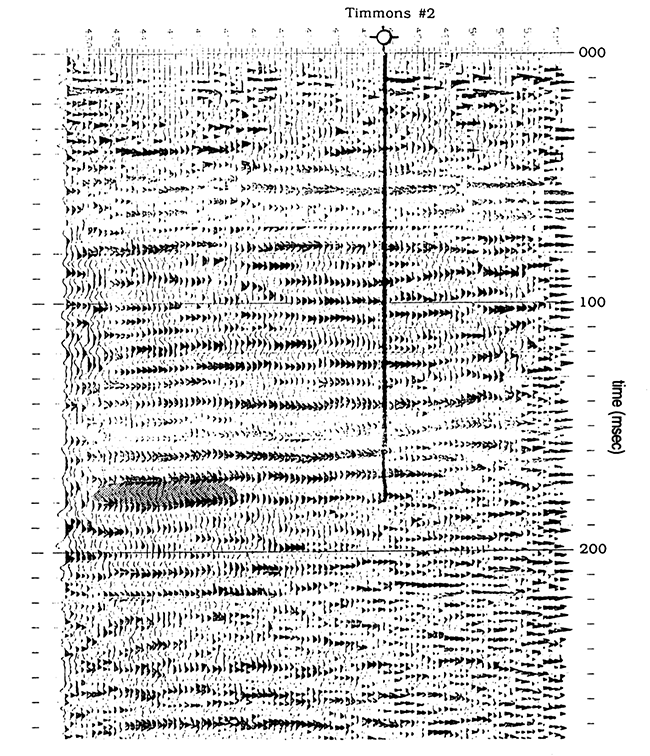
Figure 7--Suite of synthetic seismograms for the Stroud #5 well. Seismogram A illustrated the situation where the porous sandstone has been removed from the section. In seismograms B through E, the thickness of the porous, low-density sandstone is increased from 0.9 m (3 ft) to 3.6 m (12 ft) in 0.9-m (3-ft) increments.
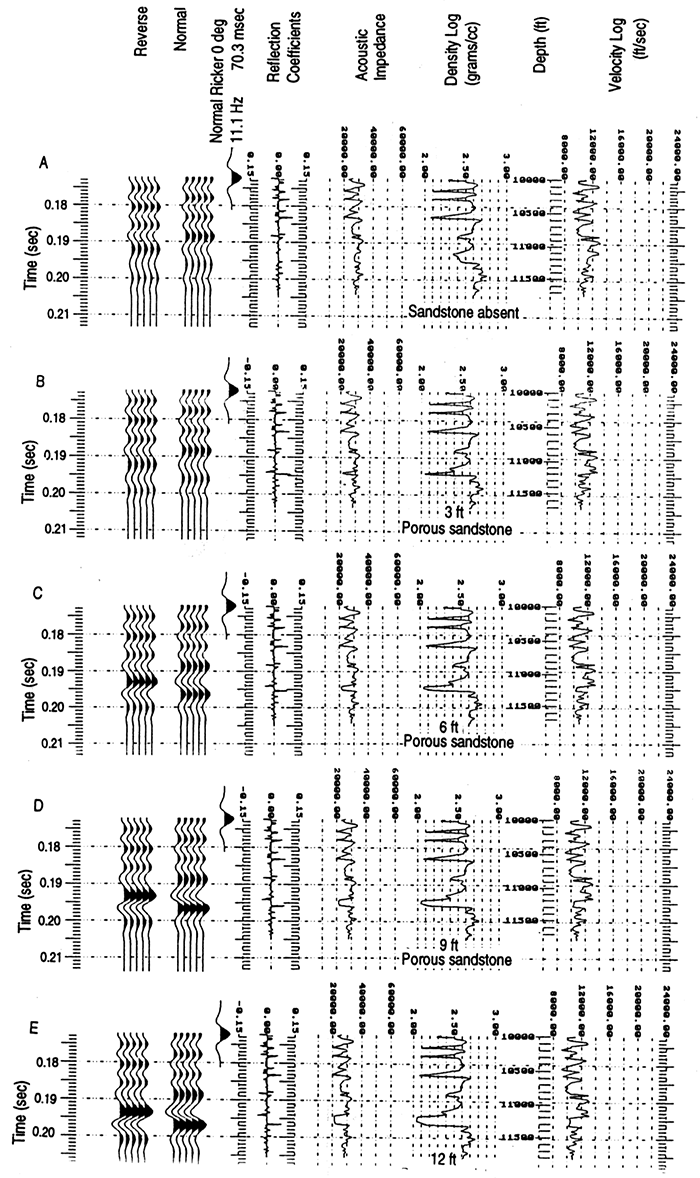
Of particular interest on the synthetic seismic section is the signature of the channel sandstone (fig. 4). The channel sandstone is characterized by an anomalously high-amplitude trough-peak sequence which originates from the top and base of the upper and lower porous zones. This trough-peak sequence has a significantly lower amplitude on the SA synthetic, where the sandstone has been replaced by higher density shale. It is clear that, although interval velocity plays a roll in the reflection response, the reflection due to the sandstone is predominantly due to density, consistent with the lower density values of the porous sandstone compared to the tight surrounding shales. The magnitude of the reflection amplitude is enhanced by the fact that seismic-data wavelengths are harmonic with the two-way travel-time thickness of the channel, which causes tuning amplification.
The pattern of reflections on the seismic lines in the vicinities of the Timmons #1 (sandstone present) and Timmons #2 (sandstone absent) wells are similar in many respects to those on the SP and SA synthetic-seismic sections. Although comparison of the synthetic seismogram with the seismic data is consistent with the interpretation of the sandstone channel, an experienced interpreter knows that there can be coincidences between the two that are in fact unrelated and lead to mis-interpretation. (Such non-uniqueness is due to modeling and/or wavelet estimation errors, resolution limits of the wavelet, and/or inappropriate assumptions of the modeling process, e.g., omission of multiples).
An important aspect of the interpretation of the sandstone channel is the positive time-structural drape across it that is attributed to differential compaction between the channel sandstone and the surrounding regional facies (fig. 5, CMP 230 to CMP 260). The drape shown as indicative of the channel sandstone is not seen in the vicinity of the Timmons #2 well (CMP 484, fig. 6). This result is expected as the Timmons #2 well did not encounter any sandstone.
On Line 2, under CMP 445 (175 msec), one sees a signature similar to that under the Timmons #1 well on Line 1. One can even speculate that because the tuning frequency of this response is 100 Hz, that the sandstone is about 25% thicker under this location than at the Timmons #1 wellsite. Timmons #3 was drilled at this trace location, and this interpretation was confirmed. Oil production exceeded that of Timmons #1.
High-resolution seismic-reflection data were able to successfully map a thin, shallow channel sandstone. The channel sandstone was characterized by a high-amplitude trough-peak sequence that was sufficiently prominent to be called a bright spot. The trough-peak sequence is consistent with the fact that density of the sandstone is significantly less than the density of the adjacent shales. The bright spot is due largely to tuning amplification of signal considered to be high-resolution. The tuning frequency (125 Hz) is consistent with the thickness (3 m; 10 ft) of the channel sandstone with an interval velocity of about 1,500 m/sec (5,000 ft/sec).
Along with the amplitude anomaly of the seismic data, the data are characterized by draping of the surrounding strata over the bright-spot amplitude anomaly. This second line of evidence is also a necessary property of the data to derive the conclusion that the bright spot is a channel sandstone. The drilling of Timmons #3 confirmed the interpretation.
Thus, the channel sandstone is characterized by 1) a high-amplitude bright-spot density reflection, 2) negative polarity of the reflection (i.e., trough-peak sequence), and 3) draping of the overlying reflections over the lensoid-shaped sandstone.
Bass, N. W., 1936, Origin of the shoestring sands of Greenwood and Butler counties, Kansas: Kansas Geological Survey, Bulletin 23, 135 p. [available online]
Brenner, R. L., 1989, Stratigraphy, petrology, and paleogeography of the upper portion of the Cherokee Group (Middle Pennsylvanian), eastern Kansas and northeastern Oklahoma: Kansas Geological Survey, Geology Series 3, 70 p. [available online]
Heckel, P. W., 1977, Origin of phosphate black shale in Pennsylvanian cyclothems of midcontinent North America: American Association of Petroleum Geologists, Bulletin, v. 61, no. 7. p. 1,045-1,068
Hulse, W. J., 1978, A geologic study of the Sallyards field area, Greenwood County, Kansas: M.S. thesis, University of Kansas, 153 p.; also available as Kansas Geological Survey, Open-file Report 78-6
Jordan, D. W., and Tillman, R. W., 1987, Geologic facies analysis for enhanced oil recovery, Bartlesville sandstone, Greenwood County, Kansas; in, Reservoir Sedimentology, R. W. Tillman, and K. J. Weber, eds.: Society of Economic Paleontologists and Mineralogists, Special Publication, no. 40, p. 311-332
Knapp, R.W., 1985, Using half-integer source offset with split-spread CDP seismic data: The Leading Edge, v. 4, no. 10, p. 66-69
Knapp, R.W., 1990, Vertical resolution of thick beds, thin beds, and thin-bed cyclothems: Geophysics, v. 55, no. 9, p. 1,184-1,191
Knapp, R.W., 1991a, Correlation stack--seismic data processing technique: Kansas Geological Survey, Open-file Report 91-28, 10 p., 4 figs., 3 tables
Knapp, R.W., 1991b, Spectral whitening of seismic data: Kansas Geological Survey, Open-file Report 91-31, 13 p., 5 figs., 3 appendices
Mayne, W. H., 1962, Common reflection point horizontal data stacking: Geophysics, v. 27, no. 6, p.927-938
Miller, R. D., Steeples, D. W., Grantham, R. L., Ali, M., Keiswetter, D. A., Anderson, J. M., Healey, J. M., Bennett, B. c., and Wirkar, F. T., 1990, Preliminary seismic tests to detect the presence of air in a semi-confined aquifer: Kansas Geological Survey, Open-file Report 90-16, 150 p.
Moore, R. C., 1936, Stratigraphic classification of the Pennsylvanian rocks of Kansas: Kansas Geological Survey, Bulletin 22, 256 p. [available online]
Morse, P. F., and Hildebrandt, G. F., 1989, Ground-roll suppression by the stack array: Geophysics, v. 54., no. 3, p. 290-301
Rascoe, B., and Adler, F. J., 1983, Permo-Carboniferous hydrocarbon accumulations, midcontinent, U.S.A. (abs.): Ninth International Congress Carboniferous Stratigraphic Geology: American Association of Petroleum Geologists, Bulletin, v. 67, no. 6. p. 979-1,001
Rich, J. L., 1923, Shoestring sands of eastern Kansas: American Association of Petroleum Geologists, Bulletin, v. 7, no. 2. p. 103-113
Staton, M. D., 1987, Stratigraphy and depositional environments of the Cherokee Group (Middle Pennsylvanian), central Cherokee basin, southeastern Kansas: M. S. thesis, The University of Kansas, 102 p.; also available as Kansas Geological Survey Open-file Report 87-24
Walton, A. W., Bouquet, D. J., Evenson, R. A., Rofheart, D. H., and Woody, M. D., 1985, Characterization of sandstone reservoirs in the Cherokee Group (Pennsylvanian, Desmoinesian) of southeastern Kansas; in, Reservoir Characterization, L. W. Lake and H. B. Carroll, eds.: Academic Press, Orlando, FL, p. 39-62
Widess, M. B., 1972, How thin is a thin bed?: Geophysics, v. 38, no. 6, p. 1,176-1,180
Previous--Walta Field (Simpson and Mississippian), Sumner County
Kansas Geological Survey
Comments to webadmin@kgs.ku.edu
Web version placed online Jan. 4, 2016. Original publication date 1995.
URL=http://www.kgs.ku.edu/Publications/Bulletins/237/Knapp4/index.html