Kansas Geological Survey, Bulletin 114, pt. 6, originally published in 1955
Originally published in 1955 as Kansas Geological Survey Bulletin 114, part 6. This is, in general, the original text as published. The information has not been updated.
The discovery well of the Lost Springs Pools Area was drilled in November 1926. By June 1, 1955, a total of 533 wells had been drilled, including 194 dry holes. Of the 339 producing wells, 218 were still producing at that date, and cumulative production exceeded 10,000,000 barrels.
Surface structure was used as a guide to exploration initially, but geologic evidence gained from drilling indicated that accumulation of petroleum was related primarily to stratigraphic factors and secondarily to structure. All wells produce from the Pennsylvanian basal conglomerate (Mississippian "chat").
Accumulation of petroleum in the Lost Springs Pools Area is associated with the following stratigraphic and structural features: (1) a broad anticline plunging gently westward from the west flank of the Nemaha anticline, (2) local closed anticlines and small plunging anticlines superimposed upon the broad fold, (3) gentle structural terraces, (4) a thickness of the combined Pennsylvanian basal conglomerate and Mississippian limestone ranging from 80 to 120 feet, and (5) a thickness of 150 feet, or more, of the Chattanooga shale.
Possibilities for the discovery of additional petroleum reserves in the Lost Springs Pools Area and in the area north of it along the west flank of the Nemaha anticline are excellent.
The Harwood Oil Company completed the discovery well in the Lost Springs Pools Area in the SW NW sec. 22, T. 17 S., R. 4 E., Marion County, Kansas, in November 1926. Initial production was 75 barrels of oil per day from the Pennsylvanian basal conglomerate, often called the Mississippian "chat," at a depth of 2,375-2,397 feet. This well was deepened 30 feet in the spring of 1927, increasing the potential production to 275 barrels of oil per day.
Drilling activity increased slowly through 1926, gained momentum, and reached a peak in 1928. The depression of 1930 to 1938 resulted in a great decrease in drilling. Drilling activity accelerated again in 1939 under the stimulus of increased prices for crude oil. Figure 1 B shows drilling activity from 1926 to the end of 1954. By June 1, 1955, a total of 533 wells had been drilled, including 194 dry holes. Of the 339 producing wells, 218 were still producing at that time, and cumulative production exceeded 10,000,000 barrels.
Figure 1--A, Index map showing location of area. B, Chart of drilling activity in Lost Springs Pools Area. (Some wells for which drilling dates were not recorded are not included.)
Surface geologic structure was used to control exploration in the early stages of development. Additional subsurface stratigraphic and structural evidence, gained from drilling, proved that accumulation of petroleum was controlled primarily by stratigraphic factors and only secondarily by structure.
This investigation includes pools officially designated as the Lost Springs pool, the Lost Springs East pool, the Lost Springs North pool, the Lost Springs Northeast pool, the Lost Springs South pool, and the Lost Springs Southeast pool. All of these pools, designated collectively as the Lost Springs Pools Area, lie within the S2 T. 16 S., R. 4 E., Dickinson County, Kansas, T. 17 S., R. 4 E., Marion County, Kansas, and the N 1/3 T. 18 S., R. 4 E., Marion County, Kansas, (Fig. 2).
The townsite of Lost Springs, near the center of the pool, is 8 miles southwest of Herington, 25 miles southeast of Abilene, and 75 miles southwest of Topeka.
Figure 2--Generalized stratigraphic sequence in Lost Springs Pools Area.
Kesler (1928) reported the discovery well of the Lost Springs pool. Rich (1930) described structural features of part of the Lost Springs pool and defined the surface syncline in the NE sec. 28, T. 16 S., R. 4 E. (Pl. 3B); Rich also described results obtained from a well drilled in the center of this syncline. Some data gained from the well are presented in the structure section of this report.
Production statistics from the Lost Springs Pools Area are contained in Bulletins of the American Institute of Mining and Metallurgical Engineering and in Mineral Resources Circulars and Bulletins of the State Geological Survey of Kansas. Jewett and Abernathy (1945) constructed a diagrammatic cross section through the center of T. 15 S. extending from R. 1 E. to R. 25 E. The line of this cross section is 6 miles north of the north limits of the Lost Springs Pools Area and depicts stratigraphic and structural conditions similar to those in the Lost Springs Pools Area. Taylor (1946) described the Hunton limestone, the Maquoketa shale (Taylor, 1947a), and the Viola limestone (Taylor, 1947). Lee (1939, 1940) described structural and stratigraphic features of Mississippian rocks. In 1948 Lee, Leatherock, and Botinelly described the stratigraphy and structure of the Salina basin. Upper Cambrian and Lower Ordovician rocks were described by Keroher and Kirby in 1948. Koester (1952) summarized geologic factors associated with production from the Lost Springs Pools Area and adjacent pools and suggested that fractures probably play a role in the accumulation of oil in this area. Jewett (1949) and Ver Wiebe and others (1950) summarized the production history of the Lost Springs pool. Lee and Merriam (1954) prepared an east-west cross section through Marion County south of the Lost Springs Pools Area.
The stratigraphic trap is usually more difficult to define, in a geological sense, than the more familiar anticlinal trap. Most of the obvious surface anticlinal folds in Kansas have been drilled; hence, much of the future search for petroleum in Kansas must be directed toward the discovery of stratigraphic traps and anticlinal traps beneath unconformities. Stratigraphic traps are complex and variable in geologic character; consequently, the cost and risk involved in the search for them may be relatively high.
This investigation is directed toward analysis of geologic factors associated with accumulation of petroleum in the Lost Springs Pools Area, which is a structurally modified stratigraphic trap. Analysis of the geological conditions in this pool should provide data that will lead to the discovery of similar traps for petroleum in Kansas and elsewhere.
Grateful appreciation is accorded to many individuals, representing both independent operators and major oil companies, for assistance in preparation of this report. Their cooperation and willingness to provide essential data were of utmost importance.
Especial thanks are expressed to the following individuals: Edward A. Koester, consulting geologist, W. G. Iversen, consulting geologist, W. K. Harwood, Harwood Oil Company, Virgil Cole, Gulf Oil Company, Jess Cling, McPherson Oil Company, F. W. Heiser and William Hendricks, Derby Oil Company, Ward A. McGinnis, Eureka, Kansas, and Ada Swineford of the State Geological Survey of Kansas, who examined thin sections of well cuttings.
Sedimentary rocks in the Lost Springs Pools Area range in age from Upper Cambrian to the Leonard Series of the Permian System and average 3,200 feet in thickness.
Although many wells have been drilled in this area, relatively few sets of samples are available for study. Many of the samples that are available represent the Pennsylvanian basal conglomerate only. Samples from the sedimentary rocks above the Pennsylvanian basal conglomerate are rare. Relatively few wells have been drilled through the Mississippian rocks, so geologic data are incomplete from lower Paleozoic rocks.
Figure 2 is a generalized geologic column of sedimentary rocks in the Lost Springs Pools Area. Plate 1A is a stratigraphic cross section through the area. General information concerning sedimentary rocks in Kansas is contained in a bulletin prepared by Moore and others (1951).
Bonneterre dolomite, consisting of finely to coarsely crystalline dolomitic limestone, lies in nonconformable contact on Pre-Cambrian granite. In places the Bonneterre probably is separated from the granite by a thin sandstone correlated with the Lamotte sandstone, which thickens northwest toward the center of the Salina basin.
The upper boundary of the Bonneterre dolomite cannot be defined in subsurface, so this unit is included with the overlying Arbuckle group of formations. Thickness of the combined Bonneterre dolomite and Arbuckle group averages 250 feet.
Arbuckle group (dolomite) is a term applied to the formations lying between the top of the Cambrian Bonneterre dolomite and the base of the Simpson group of Early Ordovician age. Formations included in the Arbuckle group, in ascending order, are: the Eminence dolomite of Late Cambrian age, the Gasconade dolomite, the Roubidoux formation, and the Cotter and Jefferson City dolomites, undivided, of Early Ordovician age. Recognition of the various formations within the Arbuckle group is difficult in subsurface. Some formations of the Arbuckle group are probably missing in the Lost Springs Pools Area.
The Arbuckle group consists of crystalline chert-bearing dolomite.
Simpson group--The Simpson group lies unconformably on the Arbuckle group. Formations of the Simpson group, in ascending order, are the St. Peter sandstone and the Platteville formation. The average thickness of the Simpson group is 70 feet.
The St. Peter sandstone of Early Ordovician age consists of rounded, frosted quartz grains and various amounts of green shale. The rounded sand grains are easily identified in samples. Leatherock (1945, p. 10) divided the St. Peter sandstone into three units in the Salina basin. These units could not be distinguished in the few samples from the St. Peter sandstone in the Lost Springs Pools Area.
The Platteville formation of Middle Ordovician age consists of sandy dolomite and green dolomitic, sandy shales transitional with the underlying St. Peter sandstone. The upper part of the Arbuckle group and the lower part of the Simpson group are abnormal in that they consist of 48 feet of arkosic conglomerate at a depth of 2,881 to 2,929 feet in the Daetwiler No. 1 well drilled by the Hutchinson Oil and Gas Company in the NW sec. 33, T. 16 S., R. 4 E., Dickinson County, Kansas. [Note: Koester, Edward A., personal communication, 1954. Mr. Koester logged these samples as arkosic conglomerate; some geologists have logged these samples as granite porphyry.] This conglomerate was not present in other samples examined.
Viola limestone (Kimmswick limestone) of Middle Ordovician age, averaging 95 feet in thickness, overlies the Simpson group. The basal 15 to 20 feet consists of crystalline gray limestone and dolomitic limestone containing various amounts of gray chert and brown stippled chert. A middle zone approximately 60 feet thick consists of gray crystalline dolomite and dolomitic limestone and mottled gray chert. The upper 10 feet is a light-gray to white crystalline dolomitic limestone.
Maquoketa shale, of Late Ordovician age, averages 65 feet in thickness. The lower half consists of soft gray shale. The shale near the base becomes dolomitic westward from the Lost Springs Pools Area. The upper half is dolomitic, siliceous, gray shale, which grades laterally into silty, gray chert.
"Hunton" limestone is a term applied to the limestones and dolomitic limestones lying between the top of the Maquoketa shale and the base of the Chattanooga shale. The "Hunton" includes rocks of Silurian and Devonian age. Distinction of Silurian from Devonian rocks, in samples, is difficult. Average thickness of the "Hunton" is 100 feet.
Lee and others (1948) separated the Silurian and Devonian parts of the "Hunton" limestone in the Salina basin on the basis of a widespread disconformity revealed by sample study. Lee and Merriam (1954, fig. 2, p. 6) believed that most of the Devonian part of the "Hunton" had been removed by post-"Hunton" erosion in the Lost Springs Pools Area.
The "Hunton" limestone consists of tan to gray crystalline dolomitic limestones. In places chert occurs near the top. Chert is scattered irregularly throughout the middle part of the "Hunton" and chert and oolitic chert occur, consistently, in dolomitic limestones near the base.
Erosion that followed deposition of the "Hunton" limestone produced considerable topographic relief on the "Hunton" surface so thickness of the "Hunton" limestone is variable.
Chattanooga shale, often called the "Kinderhook shale," lies unconformably above the "Hunton" limestone. Age of the Chattanooga shale has not been established; it is either Devonian or Mississippian. The Chattanooga consists of gray or black to green fine micaceous shales. Spores occur near the base. Thickness of the Chattanooga shale ranges from 145 to 196 feet within the Lost Springs Pools Area. The Boice shale is included with the Chattanooga shale. Lee and others (1948) believe that the Boice shale occurs in this area, above the Chattanooga, and is derived from weathering and erosion of the top of the Chattanooga shale.
Plate 2A is an isopachous map of the Chattanooga shale. This map shows that maximum thickness of the Chattanooga shale trends north-south through T. 16, 17, and 18 S., R. 4 E., and northeast-southwest through T. 17 S., R. 5 E., thence northward into T. 16 S., R. 5 E. Comparison of the isopachous map with the structure map, Pl. 2B, which is contoured on top of the Chattanooga shale, indicates that the increased thickness of the Chattanooga shale is due to thickening at the base of the Chattanooga and probably results from filling of pre-Chattanooga valleys. Outline of the area included within the 150-foot contour on the isopachous map is similar to the outline of typical dendritic stream drainage patterns. It may be significant that production of petroleum is aligned within, or adjacent to, the area enclosed by the 150-foot thickness contour. Minor erosion followed deposition of the Chattanooga shale. The upper boundary of the Chattanooga shale is at the contact with the overlying Sedalia dolomite of Mississippian age.
Thickness of Mississippian rocks varies as the result of erosion during and after Mississippian time. A major erosional unconformity separates Mississippian and Pennsylvanian rocks.
Mississippian rocks were dominantly chert-bearing limestones and dolomitic limestones. As chert is much more resistant to weathering than limestone or dolomite, intensive weathering of Mississippian rocks produced a land surface that was covered with a thick mantle of resistant chert. This surface was probably similar to parts of the present surface of the "Flint Hills" of Kansas. Weathered and eroded chert fragments of the Mississippian limestones became imbedded in lateritic red and vari-colored clay and shale. In places the clay and shale are absent and the chert fragments are either unconsolidated or cemented by quartz and chalcedony. The weathered chert is often called the Mississippian "chat." In this investigation, as in previous investigations, the eroded and weathered chert will be considered as a basal deposit of the Pennsylvanian System; hence, the top of the Mississippian is placed along the irregular, eroded surface of the unweathered cherty limestones and dolomitic limestones of Mississippian age.
Plate 3A shows the combined thickness of the Mississippian limestones and the overlying Pennsylvanian basal conglomerate. Thickness of the combined units decreases rapidly toward the flank of the Nemaha anticline (Fig. 3) as the result of uplift and erosion in post-Mississippian time. Mississippian and all older rocks were arched over the axis of the Nemaha anticline by post-Mississippian folding. Subsequent erosion removed all sedimentary rocks and exposed granite along the northern crest of the anticline. Pennsylvanian rocks were deposited on this eroded surface, producing an angular unconformity between Pennsylvanian rocks and all pre-Pennsylvanian sedimentary rocks (Pl. 1A).
Figure 3--Map showing post-Mississippian structural features of Kansas in relation to area covered by this report (adapted from Moore and others, 1951).
Sedalia dolomite, a buff-gray crystalline dolomitic limestone averaging 10 feet in thickness, overlies the Chattanooga shale.
St. Joe limestone--Above the Sedalia dolomite is a green, soft, slightly micaceous shale ranging in thickness from 4 to 10 feet. This shale thickens southward from the Lost Springs Pools Area. Examination of sample logs from wells drilled south from the Lost Springs Pools Area into Oklahoma indicates that this shale is correlative with the green shale at the base of the St. Joe limestone of Southeastern Kansas. [Note: Redmon, H. E., personal communication, 1954.] The upper part of the St. Joe limestone consists of 20 to 30 feet of light-gray to white limestone.
Reeds Spring limestone overlies the St. Joe limestone and has a maximum thickness of 10 feet in the Lost Springs Pools Area. In places it has been removed by erosion. The Reeds Spring consists of limestone and dolomitic limestone containing blue-gray to white translucent chert.
Pennsylvanian rocks, including the Pennsylvanian basal conglomerate, average 1,500 feet in thickness. The Pennsylvanian basal conglomerate is the reservoir rock for petroleum in the Lost Springs Pools Area. Relatively few wells have been drilled into rocks beneath the conglomerate and very few samples have been saved from the rocks above the conglomerate. The stratigraphic sequence of Pennsylvanian rocks, depicted in the generalized diagram, (Fig. 2), is based largely upon a radioactivity log from the Martin No. 1 well drilled in the SW SW NW sec. 1, T. 17 S., R. 4 E.
The Pennsylvanian basal conglomerate consists of grains of tripolitic chert, chert, quartz, and chalcedony imbedded in vari-colored clay and shale. [Note: Tripolitic chert is the end product of weathering of siliceous limestone, cherty limestone, or chert. Weathering removes the calcium carbonate, leaving a finely divided, siliceous residue to which the name tripoli has been applied. The name tripolite has been applied to diatomaceous earth found in North Africa; considerable confusion has resulted.] Buff, finely crystalline dolomite occurs irregularly in the conglomerate in the northern and western parts of the Lost Springs Pools Area. In places, the vari-colored clays and shales are absent and the weathered chert particles may be unconsolidated, or loosely cemented by iron oxide or silica.
Photographs of cuttings from wells in the Lost Springs Pools Area in Plate 4 show that the relationship between chert and tripolitic chert is variable. Some grains show chert surrounded by the tripolitic variety, but other grains are wholly tripolitic. Porosity and permeability increase as the amount of tripolitic chert increases.
Plate 4--Photomicrographs of well cuttings from Pennsylvanian basal conglomerate. [Note: image enlarged for web to show detail; magnifications recalculated.] A, Porous white chert and tripolitic chert (x 14) from No. 1 Ucker well, sec. 2, T. 17 S., R. 4 E., depth 2393-2396 feet. B, Porous gray tripolitic chert (x 14) from No. 1 Ucker well, depth 2388-2393 feet. C, White chert and porous tripolitic chert with impression of crinoid columnal (x 14) from No. 1 Williams well, sec. 4, T. 17 S., R. 4 E., depth 2308-2313 feet. D, Quartz and chert; quartz crystals surround cavity in upper right (x 7) from No. 1 Ucker well.
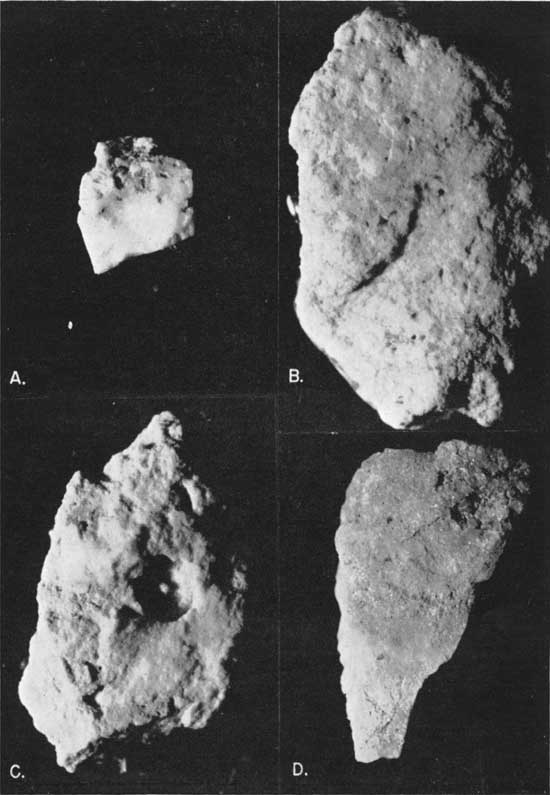
Study of thin sections from the Pennsylvanian basal chert conglomerate indicates that the tripolitic chert is formed by weathering of chert-bearing limestone and also by differential replacement of dolomite and probably calcite. Outlines of dolomite rhombs replaced by chert can be seen in thin sections. The replacement may have occurred both prior to weathering and during weathering. Quartz crystals and chalcedony are abundant.
Study of samples from the weathered chert sequence reveals several zones of intensely weathered chert separated by zones of fresh, relatively unweathered chert. Brown iron-stained chert, associated with clusters of iron oxide, occurs in the intensely weathered zones. These conditions suggest that the chert, part residual and part detrital, was deposited in successive layers and weathered before deposition of overlying layers of chert. The variation in weathering probably accounts for the great variation in permeability and porosity in the Pennsylvanian basal conglomerate.
In most wells some oil is found at the top or in a porous permeable interval near the top of the conglomerate, but greater volume has been produced from porous, permeable zones. 30 to 50 feet below the top of the conglomerate.
Pennsylvanian rocks above the basal conglomerate--Shales lying above the Pennsylvanian basal conglomerate are dominantly red, purple, and drab-green, and provide a good marker in subsurface. These variegated shales probably belong in the "Cherokee" group.
Pennsylvanian rocks lying above the basal conglomerate are shown in Figure 2.
Thickness of Permian rocks in the Lost Springs Pools Area averages 900 feet. The Wolfcampian Series is disconformable on Pennsylvanian rocks. Permian rocks are shown on the generalized stratigraphic section, Figure 2. Thickness of subsurface Permian rock units is based on analysis of the radioactivity log of a well in sec. 1, T. 17 S., R. 4 E., and on projected thickness data from surrounding areas.
The upper part of the Chase group of the Wolfcampian Series and the lower part of the Sumner group of the Leonardian Series of the Permian System are exposed at the surface.
The Lost Springs Pools Area is situated on the east flank of the Salina basin. Sedimentary rocks dip west 15 to 20 feet to the mile through the pool; however, east of the Lost Springs Pools Area in T. 17 S., R. 6 E., the west dip becomes steeper along the flanks of the Nemaha anticline. Figure 3 shows the position of the area in relation to regional structural features. Plate 1B is an areal structure map contoured on top of the Pennsylvanian basal conglomerate. Slight flattening of regional dip in the Lost Springs Pools Area produces terraces.
The Lost Springs Pools Area structure map, Plate 3B, contoured on the top of the Pennsylvanian basal conglomerate, shows west regional dip. The surface on which contours are drawn is an unconformity representing an erosion interval in the geologic past; such a surface presents certain limitation upon structural interpretations. Undoubtedly, some topographic relief is present on the surface of the Pennsylvanian basal conglomerate, but it is believed that the detrital and residual chert was redistributed so as to make a fairly level surface over the eroded top of the Mississippian limestones. Later deformation distorted the conglomerate surface. The fact that the surface of the Pennsylvanian basal conglomerate can be contoured on a 20-foot interval without many closed anticlines and synclines suggests that the surface of the conglomerate does not have much topographic relief.
Two closed anticlinal folds are delineated in the S2 sec. 21, T. 17 S., R. 4 E., and the S2 sec. 9, T. 17 S., R. 4 E.
A large closed syncline in the N2 sec. 28, T. 16 S., R. 4 E., is reflected in surface rocks, where the lowest part of the syncline is 75 feet lower, structurally, than surrounding rocks. The top of the Pennsylvanian basal conglomerate is about 150 feet structurally "low." In this syncline, thicknesses of the combined Mississippian limestone and Pennsylvanian basal conglomerate and the Chattanooga shale are normal, but the "Hunton" limestone is 274 feet thick, which is more than twice the thickness in adjacent areas (Rich, 1930). This great increase in thickness may result from faulting and repetition of part of the "Hunton" limestone. The No. 1 Kandt, drilled by the Pierce Oil Company in 1920 in the NE SE sec. 20, T. 16 S., R. 4 E., encountered only 40 feet of combined Mississippian limestone and Pennsylvanian basal conglomerate. This anomalous thickness also may result from faulting.
Plate 2B is a structure map contoured on top of the Chattanooga shale. This map can be used to modify and verify structural interpretations from Plate 1B and 3B, both contoured on the top of the Pennsylvanian basal conglomerate. Although less control is available on the Chattanooga surface, topographic relief does not obscure structure. Additional points on the Chattanooga surface were cained by projecting isopachous intervals from Plate 3A upon the elevations of contours on the top of the Pennsylvanian basal conglomerate (Pl. 1B).
The Chattanooga structure map shows a broad anticline plunging gently westward from the flanks of the Nemaha anticline into the Lost Springs Pools Area. Some small plunging anticlinal folds are outlined within the pool. Comparison of the Chattanooga structure with the isopachous map of combined Mississippian limestone and Pennsylvanian basal conglomerate (Pl. 3A) indicates that the thin zones of the isopachous map occur over the structural "highs" extending northwest and southwest from the center of T. 17 S., R. 5 E. Uplift of these anticlinal folds in post-Mississippian time caused the Mississippian limestones to be eroded more than in surrounding areas. Lee (1939) employed thickness of the Mississippian limestone and Pennsylvanian basal conglomerate as a guide to location of pre-Pennsylvanian structural features. The principle proves valid here as elsewhere.
Lee and others (1948) discussed the structural development of the Salina basin in considerable detail. This summary includes data from that report in addition to details unique to this area.
Lower Paleozoic rocks were deposited within a tectonic framework wholly different from the present tectonic conditions. The Lost Springs Pools Area, in early Paleozoic time, lay along the southern edge of the North Kansas basin (Fig. 4).
Figure 4--Map showing early Paleozoic structural features of Kansas in relation to area covered by this report (adapted from Moore and others, 1951).
The first evidence of erosion occurs at the unconformity at the base of the St. Peter sandstone. The Arbuckle group and older rocks were uplifted, then eroded, and the St. Peter sandstone was deposited upon this erosional surface. A second phase of folding and faulting, and erosion, followed deposition of the "Hunton" limestone. In places deep valleys were carved into the exposed surface of the "Hunton" limestone. Abrupt, local increase in the thickness of the Chattanooga shale reflects filling of the pre-Chattanooga valleys incised on the "Hunton" surface.
The third major time of uplift followed deposition of the Mississippian limestones and dolomitic limestones. This uplift produced the Nemaha anticline, which divided the North Kansas basin into the Forest City basin east of the Nemaha anticline, and the Salina basin west of the Nemaha anticline (Fig. 3). The Central Kansas uplift was re-elevated at this time forming the southwestern boundary of the Salina basin. Intermittent movement through Pennsylvanian and Permian time created numerous unconformities in the sedimentary rocks. Post-Permian uplift is suggested by the fact that surface Permian rocks partly reflect the attitude of the deeper subsurface rocks. Rich's analysis (1930) outlines both Permian and Pennsylvanian deformation. Deformation has continued to the present time (Lee, 1954).
Early records of production of petroleum in this pool are not complete. Estimated cumulative production to the end of 1954 totals 10,084,021 barrels. Figure 5 summarizes production by years in the Lost Springs Pools area as recorded in files of the Kansas Geological Survey. Maximum production occurred in 1941. Production from 1931 to 1940 was relatively low as a result of the economic depression.
Figure 5--Chart of petroleum production in Lost Springs Pools Area.
Increased prices paid for petroleum because of the demands of World War II caused more drilling in 1940-1945 and a resultant increase in production.
Production histories of individual wells are highly divergent. In some wells, large initial production may be coupled with a relatively short life and low cumulative production. Other wells may have a small initial yield, but will produce over a long span of time. Table 1 summarizes the production histories of four wells as revealed by pumping tests. In every case presented, the amount of water increased as the amount of oil declined. The rate of decline is quite variable.
Table 1--Well test records from selected wells in the Lost Springs Pool (Derby Oil Company records).
| Well: Rogers No. 1; C W2 SE SE Sec. 9, T. 17 S., R. 4 E. |
||
|---|---|---|
| Date of Test |
Oil (bbl/day) |
Water (bbl/day) |
| 11-10-1943 | 142 | 3 |
| 5-20-1944 | 245 | 15 |
| 1.1-14-1944 | 94 | 84 |
| 6-8-1945 | 40 | 40 |
| 11-2-1945 | 18 | 28 |
| 5-22-1946 | 24 | 39 |
| 11-10-1946 | 20 | 40 |
| 5-11-1947 | 24 | 36 |
| 11-7-1947 | 20 | 29 |
| 6-5-1948 | 12 | 56 |
| 10~-29-1948 | 12 | 40 |
| 4-4-1949 | 9 | 39 |
| 7-8-1949 | 9 | 34 |
| 5-30-1950 | 5 | 24 |
| 11-1-1950 | 4 | 40 |
| 4-27-1951 | 3 | 36 |
| 10-9-1951 | 4 | 36 |
| 5-12-1952 | 3 | 38 |
| 10-20-1952 | 3 | 30 |
| 4-21-1953 | 4 | 42 |
| 10-6-1953 | 3 | 41 |
| 6-13-1954 | 3 | 36 |
| Well: Sklenar No. 1; SE SW SW Sec. 15, T. 17 S., R. 4 E. |
||
|---|---|---|
| Date of Test |
Oil (bbl/day) |
Water (bbl/day) |
| 11-11-1944 | 13 | 57 |
| 6-17-1944 | 15 | 48 |
| 6-4-1945 | 9 | 29 |
| 11-15-1945 | 8 | I.R 0 |
| 4-24-1946 | 10 | 30 |
| 11-14-1946 | 8 | 30 |
| 5-13-1947 | 8 | 37 |
| 11-4-1947 | 8 | 36 |
| 6-8-1948 | 10 | 36 |
| 10-30-1948 | 10 | 36 |
| 4-5-1949 | 8 | 40 |
| 11-4-1949 | 7 | 40 |
| 6-3-1950 | 8 | 40 |
| 11-1-1950 | 10 | 40 |
| 5-5-1951 | 7 | 40 |
| 10-6-1951 | 6 | 40 |
| 5-20-1952 | 7 | 40 |
| 10-15-1952 | 6 | 46 |
| 4-11-1953 | 6 | 42 |
| 10-13-1953 | 13 | 97 |
| 5-24-1954 | 10 | 120 |
| Well: Watson No. 3; CN2 SE SE Sec. 29, T. 17 S., R. 4 E. |
||
|---|---|---|
| Date of Test |
Oil (bbl/day) |
Water (bbl/day) |
| 12-2-1944 | 42 | 222 |
| 6-3-1945 | 12 | 206 |
| 11-11-1945 | 5 | 2.15 |
| 4-25-1946 | 10 | 230 |
| 11-6-1946 | 7 | 194 |
| 7-15-1947 | 9 | 244 |
| 11-6-1947 | 7 | 238 |
| 6-15-1948 | 6 | 279 |
| 4-28-1949 | 7 | 246 |
| 12-4-1949 | 6 | 238 |
| 11-5-1950 | 4 | 209 |
| 10-19-1951 | 4 | 208 |
| 5-12-1952 | 3 | 209 |
| 10-21-1952 | 4 | 236 |
| 4-13-1953 | 4 | 236 |
| 10-9-1953 | 4 | 236 |
| 5-12-1954 | 2 | 285 |
| Well: Riffel No. 4; NE NW SW Sec. 10, T. 17 S., R. 4 E. |
||
|---|---|---|
| Date of Test |
Oil (bbl/day) |
Water (bbl/day) |
| 11-17-1945 | 83 | 0 |
| 4-24-1946 | 68 | 33 |
| 11-15-1946 | 72 | 44 |
| 5-14-1947 | 49 | 8 |
| 11-17-1947 | 36 | 9 |
| 6-8-1948 | 40 | 56 |
| 10-30-1948 | 36 | 88 |
| 4-4-1949 | 25 | 71 |
| 6-6-1950 | 15 | 75 |
| 11-1-1950 | 19 | 86 |
| 4-28-1951 | 16 | 100 |
| 10-7-1951 | 17 | 120 |
| 5-19-1952 | 17 | 120 |
| 10-20-1952 | 15 | 99 |
| 5-7-1953 | 12 | 84 |
| 10-6-1953 | 12 | 82 |
| 5-20-1954 | 14 | 92 |
Oil is not produced from any uniform depth of penetration of Pennsylvanian basal conglomerate. A second "break" from 20 to 50 feet within the conglomerate usually provides the "pay" zone. Water may occur with the oil, above it, or below it (Koester, 1952). A modified water drive is present along the western edge of the field. Porosity and permeability are so variable that flowing wells have been offset by dry holes. Gas production also is variable.
Figures 6 and 7 summarize the production histories of four leases in the Lost Springs Pool. The Cowman lease in the E2 SW sec. 11, T. 17 S., R. 4 E., owned by the Harwood Oil Company, is one of the most productive leases in the pool.
Figure 6--Decline curves of Cowman (A) and Watson (B) leases in Lost Springs Pools Area. Producing formation, Mississippian limestone. Cumulative total of Cowman lease in 1953 = 365,894 bbls. Cumulative total of Watson lease in 1953 = 104,627 bbls.
Figure 7--Decline curves of Rogers (A) and Riffel (B) leases in Lost Springs Pool Area. Producing formation, Mississippian limestone. Cumulative total of Rogers lease in April 1954 = 249,525 bbls. Cumulative total of Riffel lease in April 1954 = 270,333 bbls.
Salt water, produced with the oil, is disposed of both by evaporation in shallow ponds and by pumping into salt-water disposal wells.
Fracture treatment as a stimulant to wells now producing, and for new wells, will undoubtedly increase in the future. Figure 8B shows the production history of the Kasha lease in the S2 SW sec. 9, T. 17 S., R. 4 E. Three wells are producing on this lease. In September 1951, the Kasha No. 1 was fractured. The decline curve shows the effect of treatment. Favorable "flattening" of the decline curve over a period of three years is obvious though the favorable result is somewhat obscured by the fact that only one of the three wells on the lease was fractured.
Figure 8A shows the decline curve and effect of another fracture treatment; however, the period since treatment is short and the long-time effect cannot be determined.
Fracture treatment of abandoned wells that formerly produced, and of abandoned wells having good shows of oil has been attempted with some favorable results. [Note: Slusser, Bill, Slusser Drilling Company, Marion, Kansas: personal communication, 1954.]
Figure 8--Production records of Sklenar (A) and Kasha (B) leases in Lost Springs Pools Area. Producing formation, Mississippian limestone. Cumulative total of Sklenar lease in April 1954 = 30,303 bbls. Cumulative total of Kasha lease in APril 1954 = 46,506 bbls.
From 1926 to 1943 most wells were drilled by cable tools, but since 1944 most wells have been drilled by rotary equipment. Rotary tools are used to drill to the top of the conglomerate, or 2 to 8 feet into the conglomerate, where pipe is set, then the rotary tools are moved and the well is "drilled in" with cable tools.
Considerable care must be exercised in the study of well cuttings for oil "shows." In places oil occupies only the spaces between impermeable chert grains. Washed samples may not yield evidence of oil; hence, unwashed samples should be examined for correct evaluation of oil "shows" (Koester, 1952).
Plates 1B and 3B show relationships between the petroleum reservoir rock, the Pennsylvanian basal conglomerate, and structure. Plate 2B, contoured on the top of the Chattanooga shale, shows that the Lost Springs Pools Area lies along a broad anticlinal fold plunging gently westward from the flank of the Nemaha anticline. The northwest flank of this anticline is modified by the syncline in sec. 28, T. 16 S., R. 4 E., and by local minor anticlines, terraces, and plunging anticlines.
Accumulation of petroleum is concentrated on the closed anticlines in sec. 9, 10, 16, 21, 28, and 33, T. 17 S., R. 4 E. Additional accumulation is apparent along the axes of small plunging anticlines (possibly topographic features on the buried surface) in sec. 33, T. 16 S., R. 4 E. Considerable petroleum, however, is not associated with any well-defined structural features other than gentle terracing relative to regional dip.
Plate 3A shows the thickness of combined Mississippian limestones and Pennsylvanian basal conglomerate and the location of producing wells in the Lost Springs Pools Area. Petroleum accumulation is restricted to a zone in which the thickness is 80-120 feet. A similar relationship between accumulation and thickness of Mississippian limestones and Pennsylvanian basal conglomerate occurs on the opposite flank of the Salina basin in the Welch-Bornholdt Pools in Rice and McPherson Counties, Kansas. [Note: Holl, F. G., personal communication, 1954.]
It seems that the 80- to 120-foot thickness of combined Pennsylvanian basal conglomerate and Mississippian limestones can be used as a crude guide to zones where favorable porosity and permeability may be encountered in the Pennsylvanian basal conglomerate in the Salina basin.
Some evidence indicates that in areas in the Salina basin where the combined units of conglomerate and limestone are thinner than 80 feet, vari-colored clays and shales fill all pore spaces and eliminate porosity and permeability. A core of the Pennsylvanian basal conglomerate and the Mississippian limestone taken from the Lewellyn No. 1 well in the NE sec. 11, T. 9 S., R. 4 E., Riley County, Kansas, has 13 feet of Pennsylvanian basal conglomerate and 50 feet of limestone. The chert conglomerate is imbedded in red, brown, and yellow clays and shales. Porosity and permeability are extremely low. [Segments of this core have been split and mounted for inspection at the Department of Geology, Kansas State College, Manhattan, Kansas.] Although this core comes from a well outside the Lost Springs Pools Area, it is believed that conditions are similar wherever thickness of the combined units is less than 80 feet.
The Burdick pool and the Three Mile Creek pool outlined on Plate 1B produce from a combined thickness of conglomerate and limestone totaling only 60 to 70 feet. Other production from areas having a thickness of less than 80 feet can be cited, but generally the amount of production has been small.
Plate 2A shows relationship between areas of petroleum accumulation and thickness of the Chattanooga shale. Accumulation seems to be associated with the greater thicknesses of the Chattanooga shale. The Lost Springs Pools Area, the Nelson pool, the Burdick pool, the Three Mile Creek and the Three Mile Creek South pools lie within, or adjacent to, areas outlined by the 150-foot contour.
Taylor (1947a, p. 1597) noted a similar relationship between increased thickness of shale, folding, and accumulation of petroleum,
"The oil productive Voshell anticline in Western Harvey County lies on the site of a comparatively thick Maquoketa-Sylvan shale section. It is interesting to note that this area which contains relatively thick deposits of upper Ordovician shales is in the same region which was deformed by minor faulting and folding in a later geologic period."
The relationship between thickness of underlying shales and accumulation of petroleum may be mere coincidence, but thickness of the Chattanooga shale may be related to accumulation in the overlying Pennsylvanian basal conglomerate.
In summary, accumulation of petroleum in the Lost Springs Pools Area is associated with the following stratigraphic and structural features: (1) a broad anticline plunging gently westward from the west flank of the Nemaha anticline, (2) local closed anticlines and small plunging anticlines superimposed upon the broad fold, (3) gentle structural terraces, (4) a thickness of the combined Pennsylvanian basal conglomerate and Mississippian limestone ranging from 80 to 120 feet, and (5) a thickness of 150 feet or more of Chattanooga shale.
Possibilities exist for discovery of additional petroleum reserves in the Lost Springs Pools Area where the drilling sites are located by accurate stratigraphic and structural analyses. Many small structural terraces and small plunging anticlines have been incompletely explored by drilling. Many wells have logged good "shows" of oil in the Pennsylvanian basal conglomerate but did not produce commercial volumes of oil. Fracture treatment of some of these abandoned wells and abandoned producers may yield considerable oil. Results of fracture treatment will probably be more satisfactory along the eastern side of the pool where water is not abundant in the conglomerate.
The plunging anticlinal folds, associated with relatively thin sections of combined Pennsylvanian basal conglomerate and Mississippian limestones, extending northwest and southwest from the center of T. 17 S., R. 5 E., offer possibilities for accumulation of petroleum in the Pennsylvanian basal conglomerate along the flanks of the anticlines. Accumulation of petroleum could occur in deeper zones in this same area in structural and stratigraphic traps associated with the "wedge edges" of the truncated lower Paleozoic sedimentary rocks.
Stratigraphic and structural conditions similar to those in the Lost Springs Pools Area occur north and south of the Lost Springs Pools Area along the west flank of the Nemaha anticline. The area north of the Lost Springs Pools Area is relatively unexplored as compared with the area to the south.
The entire west flank of the Nemaha anticline extending north from the Lost Springs Pools Area into Nebraska offers possibility for the discovery of oil in the Pennsylvanian basal conglomerate and in anticlines and stratigraphic traps buried beneath Pennsylvanian rocks. Location of most exploratory drill sites, therefore, should be chosen to permit testing the Pennsylvanian basal conglomerate as well as structural and stratigraphic traps in lower Paleozoic rocks.
Stratigraphic and structural conditions similar to those associated with production in the Lost Springs Pools Area should be regarded as favorable areas for exploration.
Barwick, J. S. (1928) The Salina basin of north-central Kansas: Am. Assoc. Petroleum Geologists, Bull., vol. 12, pp. 177-199, fig. 1-5.
Jewett, J. M. (1949) Oil and gas in eastern Kansas: Kansas Geol. Survey, Bull. 77, pp. 1-308, fig. 1-53, pl. 1-4.
Jewett, J. M. (1954) Oil and gas in eastern Kansas: Kansas Geol. Survey, Bull. 104, pp. 278-284, fig. 1-59, pl. 1.
Jewett, J. M., and Abernathy, G. E. (1945) Oil and gas in eastern Kansas: Kansas Geol. Survey, Bull. 57, pp. 1-244, fig. 1-91, pl. 1-4.
Keroher, R. P., and Kirby, J. J. (1948) Upper Cambrian and Lower Ordovician rocks in Kansas: Kansas Geol. Survey, Bull. 72, pp. 1-140, fig. 1-13, pl. 1-6. [available online]
Kesler, L. W. (1928) Oil and gas resources of Kansas in 1927: Kansas Geol. Survey, Min. Res. Circ. 1, pp. 1-60, fig. 1-6.
Koester, E. A. (1952), Mississippian "chat" production in east-central Kansas (abs.): Am. Assoc. Petroleum Geologists, Bull., vol. 36, p. 922.
Leatherock, Constance (1945) The correlation of rocks of Simpson age in north-central Kansas with the St. Peter sandstone and associated rocks in northwestern Missouri: Kansas Geol. Survey, Bull. 60, pt. 1, pp. 1-16, fig. 1-2, pl. 1. [available online]
Lee, Wallace (1939) Relation of thickness of Mississippian limestones in central and eastern Kansas to oil and gas deposits: Kansas Geol. Survey, Bull. 26, pp. 1-42, pl. 1-3. [available online]
Lee, Wallace (1940) Subsurface Mississippian rocks of Kansas: Kansas Geol. Survey, Bull. 33, pp. 1-114, fig. 1-4, pl 1-10. [available online]
Lee, Wallace (1943) The stratigraphy and structural development of the Forest City basin in Kansas: Kansas Geol. Survey, Bull. 51, pp. 1-142, fig. 1-22. [available online]
Lee, Wallace (1954) Earthquake and Nemaha anticline: Am. Assoc. Petroleum Geologists Bull., vol. 38, pp. 338-340, fig. 1.
Lee, Wallace, Leatherock, Constance, and Botinelly, Theodore (1948) The stratigraphy and structural development of the Salina basin of Kansas: Kansas Geol. Survey, Bull. 74, pp. 1-155, fig. 1-11, pl. 1-14. [available online]
Lee, Wallace, and Merriam, D. F. (1954) Cross sections in eastern Kansas: Kansas Geol. Survey, Oil and Gas Inves., no. 12, pp. 1-8, fig. 1-2, pl. 1-4.
Lukert, L. H. (1949) Subsurface cross sections from Marion County, Kansas, to Osage County, Oklahoma: Am. Assoc. Petroleum Geologists, Bull., vol. 33, pp. 131-152, fig. 1-5, pl. 1-2.
McClellan, H. W. (1930) Subsurface distribution of pre-Mississippian rocks of Kansas and Oklahoma: Am. Assoc. Petroleum Geologists, Bull., vol. 14, pp. 1535-1556, fig. 1-3.
McNeil, H. E. (1941) Wherry pool, Rice County, Kansas: Am. Assoc. Petroleum Geologists, Stratigraphic type oil fields, pp. 118-138, fig. 1-8.
Merriam, D. F. (1955) Stone Corral structure as an indicator of Pennsylvanian structure in central and western Kansas: Kansas Geol. Survey, Bull. 114, pt. 4, pp. 133-152, fig. 1-11. [available online]
Moore, R. C.,, and others, (1951) The Kansas rock column: Kansas Geol. Survey, Bull. 89, pp. 1-132, fig. 1-52. [available online]
Ockerman, J. W. (1935) Subsurface studies in northeastern Kansas: Kansas Geol. Survey, Bull. 20, pp. 1-178, fig. 1-4, pl. 1-13. [available online]
Rich, J. L. (1930) Circular structural depressions in central Kansas: Geol. Soc. America, Bull., vol. 41, pp. 315-320, fig. 1-3.
Taylor, M. Hall, Jr. (1946) Siluro-Devonian strata in central Kansas: Am. Assoc. Petroleum Geologists, Bull., vol. 30, pp. 1221-1254, fig. 1-23.
Taylor, M. Hall, Jr. (1947) Middle Ordovician limestones in central Kansas: Am. Assoc. Petroleum Geologists, Bull., vol. 31, pp. 1242-1282, fig. 1-28.
Taylor, M. Hall, Jr. (1947a) Upper Ordovician shales in central Kansas: Am. Assoc. Petroleum Geologists, Bull., vol. 31, 1594-1607, fig. 1-7.
Thomas, C. R. (1927) Flank production of the Nemaha mountains (granite ridge), Kansas: Am. Assoc. Petroleum Geologists, Structure of Typical Am. Oil Fields, vol. 1, pp. 60-72, fig. 1-5.
Ver Wiebe, W. A., and others (1951) Oil and gas developments in Kansas during 1950: Kansas Geol. Survey, Bull. 92, pp. 1-187, fig. 1-12, pl. 1-2.
Kansas Geological Survey, Depositional Facies of Toronto Limestone Member
Placed on web March 26, 2009; originally published in Nov. 1955.
Comments to webadmin@kgs.ku.edu
The URL for this page is http://www.kgs.ku.edu/Publications/Bulletins/114_6/index.html