Kansas Geological Survey, Bulletin 26, originally published in 1939
Originally published in 1939 as Kansas Geological Survey Bulletin 26. This is, in general, the original text as published. The information has not been updated.
The thickness of the Mississippian limestones in central and eastern Kansas bears a close relation to the geologic structure features of the state, and thus to the occurrence of the oil and gas deposits. The limestones of this age are widely distributed in the central and eastern portions of the state, though they are absent over large areas in the central Kansas uplift and the northern part of the Nemaha ridge, as well as in many smaller areas in other parts of the state. They attain a thickness of 1,138 feet in Clark County, but in most of eastern Kansas they have a general thickness of only 300 to 450 feet.
The Mississippian limestones include representatives of the Kinderhook, Osage, Meramec, and Chester series. They were deposited on a nearly flat surface on the Chattanooga shale. After their deposition they were gently folded and elevated and the subsequent erosion reduced the surface in pre-Pennsylvanian time to a nearly flat horizontal peneplain. Rocks lowered below the plain of base leveling were preserved; those that had been raised above it were worn away. There is, therefore, a close relation between the thickness of the Mississippian limestones and the folding that occurred during the time interval between the final deposition of the Chattanooga shale and the close of base leveling. In western Kansas the Chattanooga shale was not deposited and the Mississippian limestones rest on an eroded pre-Chattanooga surface, so that the thickness there is not so significant of structure as in eastern Kansas.
During the pre-Pennsylvanian folding of the Mississippian rocks, pronounced anticlines, such as the Nemaha ridge fold, the Voshell anticline and many others of less prominence were initiated. They are expressed on the accompanying thickness map (Plate I) by thinning of the Mississippian limestones. The base leveling appears to have been complete. Over 1,100 feet of rocks were removed from the crest of such steep anticlines as the Burns dome and the Eldorado anticline. Erosion revealed the basement granite on parts of the central Kansas uplift and the Nemaha ridge, but on most anticlines the Mississippian was not entirely removed.
During early Pennsylvanian time in eastern Oklahoma 18,000 to 20,000 feet of Cherokee and earlier Pennsylvanian rocks were deposited in a gradually subsiding basin. The surface of eastern Kansas appears to have remained above sea level during most of this time, for only about 500 feet of the uppermost Cherokee rocks overlapped upon the surface in Kansas. During this epoch, the previously eroded surface of the Mississippian, which had been reduced to base level, was gradually reelevated. The reelevation was accompanied by synclinal folding, which developed the northern extension of the Cherokee basin of Oklahoma and probably also the Forest City basin. During the same time, anticlinal movements rejuvenated the Nemaha ridge fold and there was a relative downward displacement on the east of 100 to 500 feet. Most of the other earlier anticlines and synclines were rejuvenated in varying degree.
The continued advance of the Cherokee sea ultimately covered the region except for the northern part of the Nemaha ridge, the central Kansas uplift, and the intervening area which were not submerged until Marmaton time.
The slow and gradual deformation that was going on during the deposition of the early Pennsylvanian rocks in Oklahoma continued in some degree after the Cherokee sea reached Kansas, and it continued to deform the later Pennsylvanian rocks by small increments of folding during their deposition.
Some erosion affected the parts of the surface that had not yet been submerged. Because the limestones contained many porous zones and the surface was covered by residual chert, and because the gradients of the surface were low, most of the rainfall escaped by underground channels and the surface dissection was relatively small.
The folds of determinable pre-Mississippian age trend in a northwesterly direction. The original folds of the Mississippian rocks trend chiefly toward the north or northeast, although there is some continuation of the northwesterly trending folds. During the Cherokee and later Pennsylvanian time and during the Permian period, both sets of folds were active although northeasterly trending folds predominated.
In some places, particularly along the Nemaha ridge fold, there was a tendency toward en echelon arrangement of secondary anticlines. The areas in which igneous intrusions occurred in Pennsylvanian or later time are shown to have been already slightly domed by pre-Pennsylvanian folding. An ill-defined area in Republic and adjoining counties appears to have no Mississippian rocks. The absence of Mississippian rocks in this area may indicate only a local pre-Mississippian topographic high. It may, on the other hand, indicate a folding that trends northwest, parallel to the central Kansas uplift.
As the structural features are closely related to the thinning of the Mississippian rocks, there is a close relation between thinning and the occurrence of oil and gas on the anticlines in the central and eastern parts of the state. Nearly all fields that produce from anticlines are underlain by thin sections of Mississippian rocks. It is concluded, therefore, that the presence of a thin section of the Mississippian in areas thus far unproductive may in some cases indicate the proximity of incompletely explored structural highs and warrant further investigation of the local conditions. Some prominent anticlines, however, are not productive of oil or gas. A list of unproductive areas where the Mississippian rocks are thin is presented.
The producing zones in Mississippian rocks appear to be independent of the stratigraphic formations. Production is dependent on the porosity of the limestone. The base leveling of the folded rocks brought the various formations of the Mississippian to the surface at different places and subjected them to weathering and leaching. In some places where the ground-water level had been lowered, porous zones are present to a depth of over 100 feet below the surface of the Mississippian. A list of fields that have produced from Mississippian rocks is given and the available production figures are presented.
The thickness of the Mississippian limestones in central and eastern Kansas bears a close relation to the geologic structural features of the state, and thus to the occurrence of the oil and gas deposits. The present report on the thickness of the limestones of this age contains some of the results of an investigation of the subsurface Mississippian rocks of the state conducted by the writer since 1935 under a cooperative agreement between the Federal Geological Survey and the State Geological Survey of Kansas.
The thickness of the Mississippian limestones is shown on the accompanying map (Plate 1) by means of lines that connect points of equal thickness, drawn at intervals of 50 feet. Because the thickness of these limestones bears a close relation to some of the structural features, the names of the prominent regional anticlines and synclines, as well as the names of many local features, are shown on the map. These include the central Kansas uplift, the Nemaha ridge, the Voshell, Valley Center, Longton and other anticlines, and the Salina and Dodge City basins. The positions of the Cherokee basin and the Forest City basin and some other structural features are also shown, although they are basins filled by Pennsylvanian strata and are not related to the thickness of the Mississippian beds. The fields that have produced oil and gas from the Mississippian rocks and those that have produced oil and gas from other rocks on anticlines are also shown on the map, but fields that have produced from lenticular sand bodies, including shoestring sands, are omitted.
The data on which the map is based have been obtained from the logs of about 3,500 wells that were drilled for oil and gas, although several times this number of logs that did not reach the base of the limestones were examined. Most of the logs were issued by the Kansas Well Log Bureau of Wichita. The logs made available to November 15, 1938, are included. The logs of some wells in the southeastern part of the state were secured from other sources.
Most of the logs of wells drilled by standard tools appear to be reasonably accurate, but some of the older wells were drilled at a time when sandstone, chert, conglomerate, dolomite and any other water-bearing zone were logged indiscriminately as "sand" by some drillers and operators. Some of these older logs were discarded, but comparison with logs of more recent neighboring wells served to identify the top of the Mississippian in most of the questionable records. The cuttings of about 400 widely distributed wells were examined by the writer. The top and bottom of the Mississippian are not accurately noted in the logs of wells drilled by rotary tools; for the determination of the thickness in such wells the writer is indebted to the geologists of oil companies in whose laboratories the samples were examined microscopically.
The accuracy of the map depends on the number of logs available for the drawing of the thickness lines; and in areas where few wells have been drilled some generalization has been necessary. In order to show the degree of control, the locations of the wells have been shown, but to avoid crowding of well symbols, about 1,200 wells that lie within oil pools have been omitted. Inasmuch as the logs are of unequal accuracy, the wells whose cuttings are known to have been examined by geologists are shown on the map with a cross. All others are shown by dots.
The sequence of rocks whose thickness is represented on the map (Plate I) extends from the top of the Chattanooga shale to the top of the Mississippian limestones (Table 1).
Table 1--Showing sequence of Mississippian limestones and lower Pennsylvanian units penetrated in wells in central and eastern Kansas.
Chert deposits occur on the eroded surface of the Mississippian limestones. The chert was accumulated during the weathering of the Mississippian and a portion of it was reworked during the invasion of the early Pennsylvanian sea. The weathered chert that has remained in place in the Mississippian limestones is, of course, Mississippian in age, and the chert that was reworked by the Cherokee sea is classed as detrital deposits of Pennsylvanian age. Unless well samples are studied with the aid of a microscope, however, no distinction can be made between chert weathered in place and the reworked chert of Pennsylvanian age, and even where samples are studied, chert weathered in place, residual chert and reworked chert are not everywhere distinguishable. For this reason, although it is recognized that part of the chert at the top of the Mississippian is really the basal deposit of the Pennsylvanian, it has been necessary to consider the top of the chert as the top of the Mississippian in compiling data for the thickness map (Plate I). Also, relatively few well samples of these rocks from the eastern part of the area are available for study.
The top of the chert, as thus determined, presents a more even surface than the true top of the Mississippian, for the advancing Pennsylvanian sea, in reworking the loose material, distributed it thickly in depressions and thinly on elevations of the eroded surface. In the preparation of Plate I the thick basal deposit of the Pennsylvanian on the flanks of the central Kansas uplift, where it reaches its greatest thickness, was excluded from the Mississippian, insofar as it was distinguishable.
The Mississippian limestones are widely distributed in central and eastern Kansas, though they are absent over large areas in the central Kansas uplift and the northern part of the Nemaha ridge, as well as many smaller areas in other parts of the state, all of which are shown on the map (Plate I). The Mississippian limestones have a more or less regular thickness of 300 to 450 feet in the greater part of the area shown on the map.
East of the Nemaha ridge the thickness exceeds 450 feet in some places. On some sharp domes and anticlines, particularly in the southern part of the state, the limestones are less than 200 feet thick. A single isolated well near the Kansas line in T. 1 N., R. 14 E., in Nebraska (Plate I), penetrated only 35 feet of Mississippian limestone. This well was drilled on a local anticline in the surface rocks, and the thickness, therefore, probably represents only the local thinning of the Mississippian rocks that is usual on anticlines. The thickness of the Mississippian, as mapped along the Nebraska border east of the Nemaha ridge, is consistent with the data available; but, as wells are infrequent in this area, the thickness map is not as accurate as in areas of better control.
Between the Nemaha ridge and the central Kansas uplift the Mississippian limestones form a roughly lenticular body. They thin eastward on the flank of the Nemaha ridge. Toward the west they wedge out on the flank of the central Kansas uplift. Within this area there are local variations in thickness. The greatest thickness found in the area of the map is in Harper County, where the thickness of the limestones is more than 500 feet, but southwest of the central Kansas uplift, in Clark County, outside the area mapped, a thickness of 1,138 feet is known. Even greater thicknesses are reported from wells farther south and southwest, in Woods and Harper counties, Oklahoma. The Mississippian limestone is absent in part of sec. 33, T. 20 S., R. 3 W., where a fault brings 270 feet of Mississippian limestone against an area from which it has been removed. It is absent on the crest of the Cunningham dome, T. 27 S., Rs. 10 and 11 W., and on a considerable but as yet ill-defined structural high centering in Ts. 30 and 31 S., R. 14 W. The Mississippian is absent also on the central Kansas uplift, except on its flanks, on the northern part of the Nemaha ridge, and on a number of secondary anticlines along the crest of the southern part of the Nemaha ridge in Kansas. It appears to be absent also in parts of Republic and possibly in adjoining counties.
There is no reason to doubt the former presence of a normal section of the Mississippian on those parts of the Nemaha ridge where these rocks are now absent. In fact, it is probable that Mississippian limestones were originally deposited over all of Kansas. At least a part of the younger Mississippian may have extended across the central Kansas uplift, though no Mississippian limestones are now present on the central part.
The Mississippian limestones were deposited on the nearly flat surface of the Chattanooga shale. After their deposition the Mississippian rocks were gently folded and elevated. The subsequent erosion reduced the surface in pre-Pennsylvanian time to a nearly flat, horizontal peneplain. The concept of peneplanation at this time was already tentatively accepted in 1926 when Ley (1926, p. 96) pointed out that the granite ridge "was reduced practically to the base level of the surrounding country." Barwick, referring to the Salina basin in 1928, mentioned that "the surface was nearly base leveled," and Hall that it was "practically reduced to a peneplain" (Barwick, 1928, p. 188).
Rocks lowered by folding below the level of the pre-Pennsylvanian peneplain were preserved and rocks raised above it by folding were worn away. The original flatness of the upper and lower surfaces, together with the probability that only a slight amount of dissection altered the features of the upper surface before its burial, warrants the conclusion that the thickness of the Mississippian in eastern Kansas is a definite expression of the folding which occurred between the close of the Chattanooga and the completion of the peneplain.
The Mississippian limestones, as expressed by the thickness lines of the map (Plate I), are thus thick in synclines and thin on anticlines. A comparison of the thickness in adjacent thick and thin areas in a large part of eastern Kansas furnishes an approximate quantitative measure of the structural relief at the close of peneplanation. The relation between thickness and structure, however, is lost or becomes imperfect in the areas noted below where either the original flat upper surface of the limestones or the flat lower surface on which the limestones rest was modified by erosion.
The Mississippian rocks west and northwest of Clark County, in western Kansas, overlie a pre-Chattanooga surface of considerable regional relief upon which the Chattanooga shale was never deposited. In this region the under surface of the Mississippian limestones is irregular and it is thus unlikely that their thickness in western Kansas will prove to be as significant of structure as in eastern Kansas. For this reason, and because wells are relatively few in number, the preparation of a thickness map of western Kansas has not been attempted. In parts of Cowley, Chautauqua, and southeastern Sumner counties, the Chattanooga shale was completely or partially removed in middle Mississippian time by erosion, and the base of the Mississippian limestones is an irregular surface in such areas. In consequence, the relation between thickness and structure is not as close as in other parts of the region mapped, although the major folds are rather generally indicated. In parts of northern Kansas immediately northeast of the central Kansas uplift, a hiatus exists between the Chattanooga shale and the next younger rocks. The surface of the Chattanooga, prior to the deposition of the next overlying beds, however, had very low relief, as indicated by the widespread overlap of a bed of brown dolomite, only 10 to 20 feet thick, upon the weathered surface of the Chattanooga.
The deformation expressed by the thickness map (Plate I) is a composite of a number of structural movements. Evidence of slight movement along the Nemaha ridge in early Mississippian time was noted by the writer during work on the stratigraphy of the Mississippian, the results of which have not yet been published. Slight southerly tilting seems to have occurred preceding the deposition of the Burlington and Keokuk limestones. Southwesterly tilting before the deposition of the Meramec beds is also suggested by the stratigraphic relations. Though none of these movements, so far as known, were of local importance in the area covered by the thickness map, all are included in the deformation shown by the thickening and thinning of the Mississippian.
The principal movement followed the deposition of the Mississippian rocks. The movement is definitely post-Meramec, for cores from the upper part of the Mississippian collected by the writer from several wells in southwestern Kansas were found by the late Geo. H. Girty, of the Federal Geological Survey, to contain fossils of Meramec age. No cores could be obtained from the upper 350 feet of the 1,138-foot section of Mississippian rocks in the Watchorn-Morrison No. 2 well (sec. 20, T. 32 S., R. 21 W.) in Clark County, immediately below which Doctor Girty reported fossils of probable Spergen (Salem) age. Roth, who examined cores and cuttings from this well, reports that fossils of Chester age were found in its upper part (Roth, Robert, oral communication quoted in McClellan, 1930; confirmed by letter of June 8, 1930, to the writer.). Rocks of Chester age are also reported by Roth in deep wells in Woods and Harper counties, northwestern Oklahoma, where the Mississippian is thick. Chester limestones of Batesville age occur at the surface in extreme southeastern Kansas and in northeastern Oklahoma. These occurrences mean that the folding was not completed until after the deposition of some Chester rocks.
The features shown on the map do not reveal pre-Mississippian folding and they do not indicate the folding that took place after pre-Pennsylvanian peneplanation. However, since a great many Pennsylvanian anticlines were developed on the axes of pre-Pennsylvanian folds, their location and trends in most places coincide with the older folds.
The most prominent fold shown on Plate I is the Nemaha ridge fold which crosses the state toward the northeast from Oklahoma to Nebraska. Peneplanation removed the Mississippian and older rocks from the northern part of the fold and the pre-Cambrian was exposed in considerable areas. The Mississippian, together with varying thicknesses of older rocks, was removed from some of the secondary anticlines along the crest of the southern part of the fold.
Only about 60 feet of Cambrian rocks remain at the center of the Burns dome (T. 23 S., R. 5 E.). The pre-Cambrian surface appears to have had relatively low relief along the southern part of the Nemaha ridge in Kansas, so that the thickness of Cambrian and Ordovician rocks is locally fairly constant. The local average thickness of the pre-Mississippian limestones in the region near the Burns dome is 687 feet. It appears, therefore, that, including the Mississippian limestones and Chattanooga shale, at least, 1,140 feet of rocks were worn away from the crest of this dome. Irrespective of any uncertainty in regard to the original thickness of the lower part of the Arbuckle on the eroded part of the anticline, not less than 800 feet of rocks was eroded from the flanks of the dome. These estimates include Mississippian rocks present near by, but make no allowance for the younger Mississippian rocks no longer represented in the immediate region, several hundred feet of which may have been eroded. Reeves (1929, p. 163) reports that 650 feet of Ordovician rocks were removed from the crest of the Eldorado anticline (Tps. 25 and 26 S., R. 4 and 5 E.). Adding to this a minimum of 500 feet for the Mississippian limestones and the Chattanooga shale, at least 1,150 feet of rocks was removed.
It has been assumed by some geologists that even greater thicknesses of rocks have been eroded from the northern part of the Nemaha ridge, because broad areas of the pre-Cambrian there underlie the Pennsylvanian. However, on the crest of the Nemaha ridge in Nebraska east of Lincoln and also in a well east of the Nemaha ridge in Nebraska just north of the Kansas line, the St. Peter sandstone is in contact with pre-Cambrian rocks. Rocks older than the St. Peter, therefore, were thin or absent toward the north on both sides of the line of maximum displacement of the Nemaha ridge and because the rocks above the granite were thinner in northern Kansas and Nebraska than farther south, the pre-Cambrian rocks were broadly exposed in pre-Pennsylvanian time by much less erosion in the northern part than in the southern part of the state. On the southern part of the Nemaha ridge, except on sharp secondary anticlines, such as Burns and Eldorado and other anticlines, no erosion of pre-Mississippian rocks took place, for the Mississippian blanket was not entirely removed during the peneplanation.
At the close of peneplanation, the Nemaha ridge was simply a pronounced truncated fold that differed from other parallel folds formed at the same time only by its greater length and more pronounced folding. It did not constitute a ridge in the topographic sense, for its surface, like the surface of the less prominent folds, was reduced to base level.
Moore (1917) as early as 1917, reported that the evidence showed "a rather pronounced though local deformation in central Kansas (Nemaha mountains) in late Mississippian or early Pennsylvanian time, followed by rapid erosion which removed all the sediments covering at least the top of the granite."
McClellan (1930) concluded that the northeast-trending Nemaha ridge fold had not come into existence at the time of the post-Devonian pre-Chattanooga erosion. McClellan's areal geologic map of the pre-Mississippian rocks shows their distribution after folding and peneplanation of the Mississippian rocks. Where the Mississippian rocks were denuded, the underlying formations were also eroded in varying degree. Unless it is borne in mind that the map represents the pre-Mississippian rocks, as they were after post-Mississippian peneplanation, the map may result in a misapprehension as to the age of the Nemaha ridge fold. Lugn (1934) has discussed speculatively the amount of pre-Mississippian deformation of the Nemaha ridge east of Lincoln, Neb., but the assumption of pre-Mississippian folding there needs additional support. However, the possibility exists, as discussed below, that some slight premonitory movements took place along the axis of the Nemaha ridge fold in pre-Chattanooga time.
The pre-Cambrian rocks appear to have been high on the Nemaha ridge in the Nehawka well (sec. 26, T. 11 N., R. 12 E.) east of Lincoln, Neb., for in this well the St. Peter sandstone is shown by Lugn to rest on pre-Cambrian rocks. The St. Peter also rests on pre-Cambrian rocks in the area of downward displacement east of the ridge, in a well in southeastern Nebraska (sec. 9, T. 1 N., R. 14 E), just north of the Kansas border. Although these two wells are 60 miles apart, the occurrence of St. Peter sandstone in contact with pre-Cambrian on both sides of the displacement, together with regional increase in the thickness of the pre-St. Peter rocks southward in Kansas and Oklahoma, suggests, but does not prove, that the overlap of St. Peter upon pre-Cambrian is not related to the Nemaha ridge fold. It may indicate only a broad structurally positive area in southern Nebraska underlain by pre-Cambrian rocks that were not submerged until St. Peter time.
The most prominent folds that trend toward the northeast parallel to the Nemaha ridge fold are the Voshell anticline, the Valley Center anticline, and the Longton anticline, which turns toward the north in Elk County. The maximum deformation of the Voshell anticline is in sec. 33, T. 20 S., R. 3 E., where peneplanation has exposed a small area of pre-Mississippian rocks raised by faulting. The amount of deformation at this point is about 300 feet. Elsewhere on this anticline the beveling of the rocks shows folding of 100 to 200 feet. The deformation indicated on the Valley Center anticline in Tps. 27 and 28 S., Rs. 1 and 2 W., is slightly more than 100 feet. The pre-peneplain folding of the Longton anticline reaches a maximum of slightly over 100 feet in T. 32 S., R. 12 E. The folding on the Dexter-Otto anticline is broad and low and inconspicuous. The thickness lines show a maximum deformation of less than 50 feet. Its deformation at most places along its trend, however, is too low to be expressed very definitely by thinning of the Mississippian limestones. Relations similar to those on the Dexter-Otto anticline prevail along the Winfield anticline. Both these folds are strongly indicated by folding in the Pennsylvanian rocks. The fold extending from T. 28 S., R. 1 E., to T. 26 S., R. 2 E., is indicated by a line of small closed areas of thin limestone, none of which indicates a relief of more than 50 feet. The Halstead pool, Tps. 22 and 23 S., R. 2 W., lies on a fold that shows a deformation of over 100 feet at the time of peneplanation. The Graber pool in T. 21 S., R. 1 W., shows pre-peneplain folding of about 50 feet. Many other northeasterly trending anticlines are shown by the thinning of the limestones on Plate I. Most of these anticlines show a deformation of less than 50 feet at the end of the peneplanation. Many of them appear to be isolated folds, but alignment with other similar folds is apparent in some places. It is possible that future drilling will develop a relationship to trends not apparent from the data at hand.
The Cherokee basin of southeastern Kansas and the Forest City basin in the northeastern part of the state are both prominent structural synclines. Both were well developed in early Pennsylvanian time. As neither has any expression on the Mississippian map, it appears that the structural movements that caused them were not inaugurated until after peneplanation.
Folds trending toward the northwest are, in general, less conspicuous than those trending toward the northeast. However, the Salina basin, a broad regional syncline extending along the northeastern side of the central Kansas uplift, is well expressed by the thickening of the Mississippian rocks. This basin is broad, though not sharply defined in Lincoln County. From Saline County, where the Mississippian rocks are thickest, it extends with diminishing intensity southeastward toward central Greenwood County. At the point where this fold crosses the Nemaha ridge, in T. 21 S., Rs. 6 and 7 E., only a few wells have been drilled, but pronounced thickening of the Mississippian limestones occurs in T. 20 S., R. 5 E. The disposition of the thicker parts of the Mississippian rocks in Greenwood County, though somewhat irregular, may be an extension of the same fold.
Barwick (1928, p. 179) who named the Salina basin, described it as "the pre-Pennsylvanian syncline bounded on the east by the Nemaha ridge, on the southwest by the Barton arch [the central Kansas uplift of later writers], and on the south by the saddle between the Chautauqua arch and the Barton arch. The basin continues northward into Nebraska, where its exact termination is unknown." The Salina basin, as defined by Barwick, is primarily a broad peneplaned structural syncline of the same type as the north Kansas basin shown on the areal map of the pre-Chattanooga peneplain by Rich (1933, p. 797). (See Fig. 1.)
The boundaries of the Salina basin, as shown by the thickness of the Mississippian limestones, are essentially as described by Barwick on the southwest, south, and east. Drilling in the Salina basin, since the date of Barwick's paper, has shown that the Salina basin has a much more limited extension toward the north and northeast than was anticipated. In these directions its limits are shown by the thinning of the limestones, which decrease from 355 feet in Saline County to less than 150 feet in Clay, Cloud and Smith counties, and as suggested in the chapter on thinning in Republic County, the Mississippian limestones may wedge out, before reaching the Nebraska state line.
Figure 1--Sketch showing the location of the most prominent of the regional structural features of Kansas.
The broad central Kansas uplift is itself a northwesterly trending complex anticlinal area which appears to have been in existence prior to Mississippian time. It was reelevated at the close of the Mississippian epoch, and, like the other folds that were formed, was peneplaned. The younger Mississippian formations, which, it appears probable, were deposited across the area, were removed, and in some areas the pre-Cambrian rocks were exposed.
What appears to be a segment of a northwest-trending syncline occurs in T. 18 S., Rs. 1 and 2 W., interrupting the northeastern trend of the Voshell anticline. A similar but smaller syncline in T. 24 S., R. 1 E., cuts off the northern end of the Valley Center anticline.
Low anticlines and parallel synclines trending northwest are shown in northern Chautauqua County and southern Elk County. These folds do not have very pronounced expression on the thickness map, for their structural relief at the close of peneplanation reached a maximum of not much over 50 feet.
Northwesterly trending folds are represented in Wilson County by local anticlines, such as the fold in T. 2S S., R. 13 E., and the Fredonia anticline in sec. 10, T. 29 S., R. 15 E. These minor anticlines are elongated toward the northwest and show a thinning of the Mississippian of about 100 feet.
Northwest-trending folds of low relief occur in Cherokee and Crawford counties. So few wells have been drilled through the Mississippian in this area, however, that the drawing of the thickness lines is largely speculative and was guided by the knowledge of similar folds in the Pennsylvanian rocks shown on the geologic structure map of Crawford County prepared by Pierce, Courtier and others (Pierce and Courtier, 1937, Plate 5). The thickness lines as shown in this district, therefore, express only the probability that the Pennsylvanian folding here was on the axis of earlier folds, there being no data to the contrary.
The general east-west pattern of the thickness lines showing anticlinal thinning in Douglas County also is based on relatively few wells. A slight thinning of the Mississippian in northern Allen County suggests that a low doming of the peneplain in that area may have anticipated the broad northwest trending fold which was formed in early Pennsylvanian time.
A prominent anticlinal dome is shown in northwestern Barber County, Tps. 30 and 31 S., Rs. 14 and 15 W., from which the Mississippian has been removed. Not enough wells have been drilled in this area to define its area or trend. Another ill-defined anticline in Franklin County, centering in T. 17 S., R. 19 E., is outlined on the basis of a few wells. The direction of its trend is uncertain.
Among the outstanding areas of thinning shown on the map, aside from those obviously related to anticlines, is an area in Republic and Washington counties. This area is not very clearly outlined, for very few wells have been drilled in this part of Kansas. The nearest wells in Kansas from which samples are available are in T. 9 S., R. 4 E., and T. 10 S., R. 3 E., in Clay County. The Mississippian limestones have been traced from these wells through drillers' logs of wells in Clay and Washington counties to the Nebraska line. The thickening of the Mississippian limestones appears to indicate that a synclinal area occurs west of the Nemaha ridge in eastern Clay and eastern Washington counties. Farther west a thinning of the same beds suggests a structural high in Republic County.
The log of the well in sec. 16, T. 2 S., R. 1 E., is interpreted as having 20 feet of Mississippian limestone and 55 feet of Chattanooga shale. The well in sec. 23, T. 2 S., R. 1 W., appears to have no Mississippian. North of this well, in sec. 31, T. 1 N., R. 1 E., in Nebraska, a well drilled in 1937 penetrated 145 feet of Mississippian limestone, but no Chattanooga shale. Except for the last-named well, the information in this area is somewhat vague, since none of the logs of the few wells drilled are as satisfactory as could be desired. The interpretation given suggests a "high" in eastern Republic County, on which the Mississippian is missing. This interpretation is supported by the fact that northward from the Salina basin the Mississippian limestones thin toward the same area.
The presence of Mississippian limestone in the Nebraska well just mentioned shows that the trend of this area is not toward the northeast paralleling the Nemaha ridge. If the absence of Mississippian rocks indicates more than a local doming the trend of the high area probably extends toward the northwest parallel to the central Kansas uplift. It is possible, as suggested by the thinning of the Chattanooga in sec. 16, T.. 2 S., R. 1 E., and its absence in the Nebraska well, that the phenomena may indicate a topographic high on the pre-Mississippian surface that was never covered by the Chattanooga or other lower Mississippian formations.
The Rose dome is a small anticline in sec. 13, T. 26 S., R. 15 E., in southern Woodson County. It is one of the few places in Kansas where igneous rocks are known to be intruded into the sedimentary rocks. Weathered granitic rocks are found on the surface in a small area and two wells drilled on the southwestern flank of the dome penetrated basic igneous rocks considered by Knight and Landes (1932) as probably a sill. One of these wells was studied by Twenhofel and Bremer (1928), who reported 102 feet of peridotite. Loose fragments of much-altered igneous rock have been described by Weidman (1933) from the small Silver City dome in sec. 32, T. 26 S., R. 15 E.
Several wells in adjoining townships found hydrothermally metamorphosed rocks at various depths on small, steep domes. On the Silver City dome, hydrothermally metamorphosed rocks are reported at the surface. Knight and Landes concluded that intrusions were responsible for these small domes, although no igneous rock was penetrated by the drill except on the Rose dome. The date of these intrusions is known only to be later than the Pennsylvanian rocks that are affected.
The greater part of the townships in which the intrusions of the Rose and Silver City domes occur, and in which most of the metamorphic rocks are found, shows broad pre-Pennsylvanian thinning of the Mississippian limestones, amounting to 60 feet at one point. This thinning seems to indicate that the general area in which the intrusions and metamorphism occurred had already been slightly arched long before the igneous activity.
Similar post-Pennsylvanian metamorphism was noted by Knight and Landes in samples from a well in sec. 8, T. 24 S., R. 17 E., on the crest of the Neosho Falls anticline, which produces oil. They inferred that deep-seated intrusions of igneous rock had caused the fold. It is interesting to note that in this well also there is a thinning of the Mississippian of about 50 feet on the crest of the anticline, indicating that in this locality also part of the folding movements antedated the intrusion.
The pre-Cherokee surface or peneplain appears to have been deformed during early Pennsylvanian time and the extent of the deformation appears to be indicated by the configuration of the lower surface of the Cherokee shale, as expressed on the accompanying map (Plate II), showing the thickness of the Cherokee east of the Nemaha ridge. On this map, prepared by Bass (1936), it is assumed that the Fort Scott limestone, immediately overlying the Cherokee, was essentially flat and horizontal when the Fort Scott was deposited. When the surface of the Mississippian rocks, upon which the Cherokee was deposited, is thus referred to the base of the Fort Scott limestone many irregularities, including considerable local relief, are shown on the top of the Mississippian. These irregularities, in the opinion of the writer, are not an expression of relief due to incomplete base leveling, but they are rather, as mentioned above and as fully discussed below, due to deformation between the close of pre-Cherokee peneplanation and the end of Cherokee time.
The Cherokee shale, as shown on Plate 11, is thin over the Nemaha ridge and is thick in the Cherokee and Forest City basins of eastern Kansas. These basins are separated by a broad area of thinning, trending northwest from Bourbon and Allen counties to southern Lyon County. In a belt trending north of west from central Wilson County, the Cherokee shale is 100 to 200 feet thinner than in the surrounding region. These and many other variations in the thickness of the Cherokee shale, not of sufficient magnitude to appear in a map with 50-foot thickness lines, are all closely related to folding movements that deformed the Pennsylvanian.
The deepest part of the Cherokee basin lies in eastern Oklahoma. The thickness of the early Pennsylvanian rocks, including beds equivalent to the Cherokee shale in Kansas and including also the formations older than the Cherokee, reaches 18,000 to 20,000 feet in southeastern Oklahoma (Miser, 1934), where deposition took place in a gradually subsiding basin. In general, less than 500 feet of the upper part of the Cherokee overlapped upon the surface in Kansas, although the thickness of the overlapping beds is somewhat greater in the deeper parts of the basins of eastern Kansas. The folding that formed the deeper parts of the basins in Oklahoma was going on contemporaneously with the deposition of the rocks in that region and probably continued in some degree during the expansion of the sea into Kansas.
Pierce and Courtier (1938, p. 37) state that the Cherokee shale is "only 375 feet thick in northeastern Crawford County (Kansas). It increases in thickness to the southwest, and in southern Labette County (Kansas) reaches a thickness of 560 feet. This increase in thickness is gradual and occurs principally in the lower half of the formation. The thickness of the upper half of the Cherokee shale remains remarkably uniform except for two small local areas in the northeastern part of the district." The significance of this observation lies in the fact that this cross section lies transverse to the steep east side of the Cherokee basin (see Pl. II), where gradual subsidence, if it had been going on during the interval of deposition, would have been expressed by convergence between datums.
Bass (1936, p. 26-27) states that "the more uniform and more widespread persistence of the strata in the upper part of the formation (Cherokee) than in the lower part, suggests that the marine waters were not only more widespread in late Cherokee time, but that the Cherokee basin had been leveled with sediments permitting the accumulation of sheet-like deposits of uniform thickness and character."
The absence of dependable datum beds in the lower part of the Cherokee rocks of Kansas makes it impossible to determine whether the same degree of parallelism prevailed in the lower part of the overlapping rocks as in the upper part. Although the strata in the upper part are essentially parallel, it seems probable that local deformation of the rocks in such localities, as mentioned by Pierce and Courtier, was taking place. It is probable also that, although the area on the northeast side of the Cherokee basin of southeastern Kansas at the close of Cherokee time was not being deformed except locally, other parts of the region may have been subjected to gradual and irregularly repeated deformation.
If the Cherokee basin had been formed by erosion of the underlying Mississippian limestone, a thinning of the limestone conforming to the basin should be evident on Plate I. If the basin had been originally folded before peneplanation the thickness lines of the Mississippian rocks should outline the basin. Since Plate I shows neither of these conditions, it is concluded that the thickness of the Cherokee in southeastern Kansas is due to postpeneplain deformation during Cherokee time. No thickening of the Mississippian rocks conforming to the area of the Forest City basin is shown on Plate I. As the Forest City basin is a closed basin, and it could not have been produced by erosion, the thickening of the Cherokee there also appears to have been caused by postpeneplain deformation.
In addition to the folding that produced the Cherokee and Forest City basins, conspicuous structural movements, including faulting, took place after the peneplain had been formed. These structural movements produced a downward displacement of the rocks east of a line closely following the east side of the Nemaha ridge fold and caused a slight rejuvenation of folding on its crest. They are indicated by the relations of the Cherokee shale to the subjacent truncated surface of the Mississippian limestones.
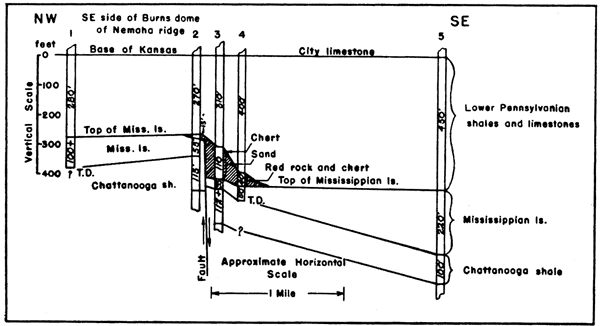
These relations have been studied most closely in oil and gas pools on pronounced secondary anticlines along the main fold. The Cherokee rocks in these areas are thin on the crest of the Nemaha ridge and in the region on the west side, but they thicken abruptly on the east side. The Mississippian rocks east of the Nemaha ridge have been displaced vertically 200 to 500 feet. On the downthrown side they thin westward toward the ridge in the same way that the Mississippian rocks west of the ridge thin toward the east (see diagrammatic cross sections b and c of Figure 2). The increase in the thickness of the Cherokee shale where the beveled Mississippian rocks have been displaced is abrupt and corresponds approximately to the amount of displacement. On most anticlines the increase in thickness of the Cherokee shale occurs within the distance of one well location. The overlap of only the topmost beds of the Cherokee or Marmaton rocks upon the higher surface to the west shows that the displacement preceded submergence of the crest. These relations are shown in Figure 3 and Plate III, and are interpreted as indicative of pre-Cherokee faulting in the cross sections of all the anticlines along the Nemaha ridge that have been described. The anticlines thus described include the Eldorado (Reeves, 1929, Reeves' cross section shows the relation as a beveled, steeply inclined slope) anticline and Burns (Kellett, 1932) dome in Kansas, and the Tonkawa (Clark, G.C., 1926), Blackwell (Clark and Daniels, 1929), Thomas (Clark, S., 1926), and Oklahoma City (McGee and Clawson, 1932) anticlines in Oklahoma.
Figure 2--Diagrammatic cross sections, illustrating peneplanation and postpeneplain faulting of anticline in Mississippian rocks. Section a, simple anticline; section b, peneplanation of anticline, showing beveling of Mississippian rocks on both sides of the crest; section c, faulting of beveled anticline with displacement of peneplaned surface. These cross sections illustrate the origin of the faulted anticlines on the Nemaha ridge fold.
Figure 3--Sketch showing in cross section a fault southeast of the Burns dome and east of the Nemaha ridge in section 6, T. 24 S., R. 6 E. The deposit, cross-lined in the section, is believed to have accumulated after the deformation of the pre-Pennsylvanian peneplain but before the deposition of the lower Pennsylvanian shales and limestones. Wells:
McClellan (1930, p. 1553), quoting R. L. Kidd, reports faulting on the east side of the Augusta pool amounting to 600 feet, but this figure probably includes also the displacement that occurred during later Pennsylvanian and Permian time.
East of the Burns dome, on the line of the Kellett cross section (Plate III), the displacement resulted in the lowering of the peneplaned surface 300 to 350 feet. The displacement is interpreted as a fault, but the evidence available does not exclude the possibility of folding. Just southeast of the Burns dome, in sec. 6, T. 24 S., R. 6 E., the displacement of 150 feet between well locations, however, appears to indicate a fault. (See Fig. 3.) The cross section shows that the Mississippian limestone was thinned but not removed from the area west of the fault.
Fewer wells have been drilled along the ridge outside the areas of oil-producing anticlines, and there is thus less evidence that the displacement east of the ridge has been caused by faulting. In many places the gradual increase in the thickness of the Cherokee, as shown by the Cherokee thickness map, indicates that the displacement was accomplished by gentle monoclinal tilting of the surface basinward from the Nemaha ridge. The amount of displacement, as expressed by the thickness of the Cherokee, was as low as 100 feet in places near the Oklahoma border, but increased irregularly toward the north, reaching 500 feet or more near the Nebraska state line. The vertical displacement was periodically increased during later Pennsylvanian and in Permian time. The northern end of the reelevated fold was raised so high that it was not submerged by the advancing Pennsylvanian sea until middle Marmaton time.
In central Kansas and along the northern part of the ridge the displacement appears to be steeper than in the southern part, but this may be due to the fact that not so many wells have been drilled in the northern area. The line of the displacement is well marked at several points, however, and not much latitude is left for deviation from the trend shown on the map, although the character of the displacement at most places is obscure for lack of data. In the absence of well data the eastern side of the Nemaha ridge north of T. 10 S. has been sketched on Plate I from the line of pronounced cast dips in the Pennsylvanian formations shown on the areal geologic map of Kansas.
The surface of the beveled Mississippian rocks west of the crest of the Nemaha ridge fold, when referred to the Fort Scott limestone, shows a low westward slope, which appears to be the expression of rejuvenation of folding during the period of faulting.
The relation of the beveled Mississippian rocks on the downthrown side of the faults and the overlap of the Cherokee rocks upon the crest of the Nemaha ridge indicate that the variations in thickness of the Cherokee along the ridge are not the result of erosion, but are due to folding and faulting that took place between peneplanation and the end of Cherokee time. Folding on the crest of the Nemaha ridge and displacement along its east side continued by small increments throughout Pennsylvanian and Permian time.
The area of thin Cherokee rocks in Wilson County includes the Fredonia anticline in T. 29 S., R. 15 E. Stryker (1925, p. 1207) has published two detailed cross sections of Wilson County. Both include the Fredonia anticline, which lies on the elevated area. His sections show that the intervals between Pennsylvanian datum beds are thinner on the anticline than in near-by synclinal areas, and that they express progressive growth of the anticline during post-Fort Scott deposition. The Cherokee shale below the Fort Scott is about 200 feet thicker in the syncline north of the Fredonia anticline than on its crest.
Not many wells had been drilled through the Mississippian at the time the cross sections were drawn, so that the full relation of the Pennsylvanian folds to the thickness of the Mississippian is not disclosed. The northeast-southwest cross section, however, shows that the thickness of the Mississippian on the crest of the Fredonia anticline is about 90 feet less than in a well in a synclinal area about a miles to the north.
The thickness of the Cherokee rocks on the flanks of the anticline is more than double that of the Mississippian in the same position. If the relief necessary for the deposition of this thickness of the Cherokee had been produced by erosion, as shown in section C of Figure 4, the Mississippian could not have remained thicker on the flank than on the crest. The existing relations, as shown in section D of Figure 4, could only have been caused by the rejuvenation of the eroded pre-peneplain fold during or before the deposition of the Cherokee rocks of the area, and are not the result of pre-Cherokee erosion.
The relief of the base of the Cherokee in this area is so pronounced that the deformation must have been more rapid than on most contemporaneous folds and it seems probable that the surface was in part deformed before submergence. The presence of lenticular bodies of chert conglomerate mixed with sand on the flank of the anticline and the absence of chert on its crest, as reported by Stryker (oral communication), support the theory that the ridge was exposed to erosion before submergence.
There are some structural discrepancies in Wilson County between the folding, as indicated by the Mississippian thickness map, and the folding shown by the Cherokee thickness map. Some of these differences are due to the fact that fewer wells have been drilled through the Mississippian than through the Cherokee and to differences in the interpretation of the data. Some of the differences may be due to dissection that occurred during the period of reelevation. There is also a possibility that in this area northeasterly trending folds, as expressed on the Mississippian thickness map, were dominant during the post-Mississippian folding, but that during the deformation of the peneplain there was a revival of northwesterly trending folds as expressed on the Cherokee thickness map.
In order to show the relations between the elevations on the Mississippian limestones and the Cherokee folding in another part of eastern Kansas, the cross section of Kansas prepared by Betty Kellett (1932) was in part redrawn in skeleton form, using the base of the Fort Scott limestone (top of the Cherokee shale) as a datum. Only those wells were used that passed through the Mississippian. Thus redrawn, the cross section (Plate III) shows the elevations and depressions of the Mississippian surface at the end of Cherokee time. The folds in the Pennsylvanian rocks between the Fort Scott limestone and the top of the Lansing are expressed on the cross section (Plate III) by the thinning and thickening of the interval between the top of the Cherokee shale and the top of the Lansing group. This thinning is caused by the anticlinal warping of the originally flat Fort Scott limestone before the deposition in a horizontal position of the top of the Lansing. The structural relations on the top of the Lansing, as drawn, however, are inverted, due to the fact that the underlying Fort Scott, instead of the Lansing, has been drawn horizontal.
Anticlinal elevations on the Mississippian surface are shown on the cross section (Plate III) to underlie anticlines affecting the rocks between the top of the Lansing and the base of the Fort Scott limestone. They also overlie thin sections of the Mississippian that represent pre-peneplain anticlines. Synclinal depressions on the Mississippian surface similarly underlie thick intervals between the same datum beds and they overlie thick sections of Mississippian rocks. Elevations and depressions of the surface of the Mississippian on the line of the Kellett cross section are thus closely related to both pre-peneplain and early Pennsylvanian folds. This close relation of the Mississippian surface to the structural features appears to indicate that they were caused by the rejuvenation of pre-Cherokee folds during Cherokee time and that the folds continued to grow during later Pennsylvanian deposition. They do not, therefore, appear to be the result of incomplete reduction of the surface to a peneplain.
In Bass report on Cowley County (Bass, 1929, p. 124), after pointing out the close relation between the folds and the thickness of the Mississippian, he notes that an unpublished map prepared by him showing the thickness of the Cherokee rocks in Cowley County "indicates that the Mississippian surface sloped gently southeastward and was characterized by very low hills over anticlines and domes with intervening shallow valleys. The surface was nearly a peneplain. The topographic relief in the area of the Slick-Carson dome (sec. 19, T. 32 S., R. 3 E.) was only 10 feet to 15 feet; in the area of the Winfield anticline (Tps. 32 and 33 S., Rs. 4 and 5 E.), even less, and in the area of the Dexter-Otto anticline (Tps. 33 and 34 S., Rs. 6 and 7 E.) there was a maximum relief of 35 feet." These observations by Bass in the closely studied area of Cowley County illustrate again the close relation of the pre-Cherokee topography to structure.
The low mounds of the pre-Cherokee surface in Cowley County all overlie earlier folds that are shown by the thinning of the Mississippian. The post-Cherokee deformation, which continued through the Pennsylvanian and Permian, deformed the peneplain and increased considerably the structural relief of the pre-Pennsylvanian rocks.
The pre-peneplain folding of the Dexter-Otto anticline (T. 34 S., Rs. 6 and 7 E), as indicated by the thickness of the Mississippian, is so low as to be scarcely distinguishable, being no more than 10 to 13 feet, or less than the probable limit of error. The topographic relief of the Mississippian surface, as reported by Bass (1929, p. 124), shows a maximum relief on the same anticline of 35 feet at the end of Cherokee time. The structure map of the Mississippian surface by Bass (1929, plate XI) shows the ultimate deformation of the anticline to be about 150 feet. It appears, therefore, that there was little if any deformation of the Dexter-Otto anticline prior to peneplanation, and that the Mississippian surface, when referred to the Fort Scott, had a relief of 35 feet, which was greater than the deformation of the original fold. The deformation of the Mississippian surface increased by small increments during Pennsylvanian and Permian time to about 150 feet.
The Slick-Carson dome shows a thinning of the Mississippian of about 50 feet. The relief of the Mississippian surface, referred to the Fort Scott, is given by Bass as 10 to 15 feet, and the deformation of the Mississippian surface reached about 100 feet during or after the Pennsylvanian and Permian. The folds were, therefore, growing during the entire postpeneplain period.
Such modest secondary mounds on the pre-Pennsylvanian surface, as have been mentioned in connection with the Slick-Carson dome and similar folds, might reasonably be interpreted as residual hills on the base-leveled surface, caused by greater resistance to erosion of upturned beds at the center of anticlines. The surface of the Mississippian, referred to the Fort Scott limestone, however, shows a greater relief in some places than the folding of the Mississippian. The surface was thus more deformed in these places during the time interval between peneplanation and the end of the Cherokee than before peneplanation. As shown in Figure 4, this relation is inconsistent with the origin of the mounds by means of erosion. The elevations of the Mississippian surfaces, even though of low relief, may therefore have been due to the general deformation of the region that occurred during the long period of time between peneplanation and the end of Cherokee time.
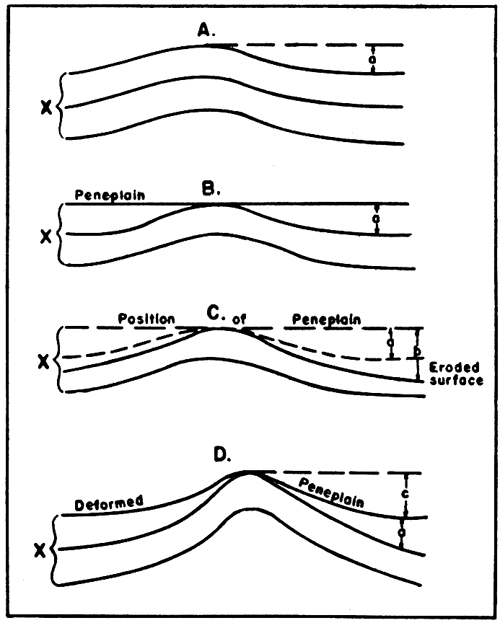
Figure 4--Diagrammatic cross sections of anticlines showing relation of thickness of exposed rocks to topographic relief, to erosion on flanks of anticlines, and to rejuvenation of folding.
(X) Folded strata; (a) measure of original deformation of strata (X); (b) measure of erosional relief caused by erosion on flank of anticline; (e) measure of relief caused by deformation of peneplain and rejuvenation of fold.
Section A represents original fold of strata (X).
Section B represents peneplanation of folded strata.
Section C represents erosion of rocks on flank of anticline to produce relief (b) greater than deformation (a). The surviving parts of the strata (X) are thinner on the flank than on the crest.
Section D represents conditions where topographic relief (e) is greater than original folding (a) without thinning of the, strata (X) on the flank of the anticline. In this case the relief (c) has been produced by folding of the peneplain and rejuvenation of the original fold.
The conditions on the northern flank of the Fredonia anticline, T. 29 S., R. 15 E., Wilson County, and in some other places, conform to the conditions of section D. Some erosion of the crest of the anticline could have taken place without destroying the relation.
The deformation during Cherokee time involved the gradual reelevation of parts of eastern Kansas and the lowering of adjacent areas. At this time there was a slow rejuvenation of old folds and the initiation of some new folds. The Kansas part of the Cherokee basin is a northward continuation of the syncline produced by the folding of the deep contemporaneously filled Cherokee basin of Oklahoma. The Forest City basin appears to be a part of the same syncline, since it lies on the northern extension of the same axis of folding. As the basin extends toward the east around the northwestern flank of the Ozark uplift, other synclinal elements may have contributed to its development. The Forest City basin is cut off from the Cherokee basin by a broad northwesterly trending arch from Bourbon and Allen counties to southern Lyon County.
The folding of these basins was accompanied by rejuvenation of the Nemaha ridge fold and by the downward displacement of the region on its east side. The displacement, which extends from southeastern Nebraska to central Oklahoma took the form of faulting in some areas and monoclinal folding in others. The surface on the western side of the Nemaha ridge was tilted gently toward the west. The central Kansas uplift, which was not covered by the Cherokee sea, was among the structural areas rejuvenated during this period and the gradients of the slopes that were developed, were steep enough for the transportation and deposition of residual debris around its flank. The surface between the Nemaha ridge and the central Kansas uplift was warped into a broad, gentle syncline, on the surface of which slight elevations were formed by the rejuvenation of earlier folds, such as the Voshell and other anticlines. This syncline trends northward into the area of the Salina basin, but the pre-peneplain syncline, which formed the Salina basin, appears to have been only slightly rejuvenated. The Forest City basin and the Cherokee basin are distinguished from the Salina basin by the fact that they trend toward the north or northeast and do not appear to have been folded until after pre-Cherokee base leveling. The Salina basin, on the contrary, trends northwest and was strongly folded before peneplanation and only slightly rejuvenated prior to the close of Marmaton time. The Forest City and Cherokee basins received thick Cherokee deposits, the Salina basin none.
The known folds of pre-Mississippian age in Kansas-trend toward, the northwest. Among them are the broad Chautauqua arch in eastern Kansas, the central Kansas ' uplift, and northwest-trending folds in Miami, Franklin, Douglas, Osage and Shawnee counties in the eastern part of the state (Howell, 1932; Rich, 1933).
Both northwesterly and northeasterly trending folds deformed the Mississippian rocks prior to peneplanation (Plate 1). Folds trending toward the northwest continued into the time when northeasterly trending folds began. The northeasterly trending folds tend to be interrupted where they meet the more strongly marked northwesterly trending synclines shown by the thickness lines. For example, the northeast end of the strongly developed Voshell anticline, as already noted, terminates in a northwesterly trending syncline in T. 18 S., R. 2 W., and the northeast end of the well-defined Valley Center anticline terminates in an area of thick Mississippian in T. 24 S., R. 1 E., which appears to represent a similar northwesterly trending synclinal fold. Even the Nemaha ridge fold is broken by the southeastward extension of the Salina basin syncline in T. 20, Rs. 5, 6 and 7 E. Less well-defined examples of interrupted northeasterly trending folds may be noted at several other points. The writer interprets these interruptions of northeasterly trending anticlines as due to local resistance offered by the presence of earlier synclinal cross folds, though this cannot be fully demonstrated, since the pre-Mississippian history of these northwesterly trending folds is not now known. The northwesterly trending minor folds shown in Elk and Chautauqua counties on Plate I may be the revival of earlier folds on the northwesterly trending Chautauqua arch, the detailed structure of which in pre-Mississippian time is not known.
Both northwesterly and northeasterly trending folds were active during Cherokee time. They were chiefly revivals of folds known to have deformed the Mississippian rocks prior to peneplanation. The northerly trending Cherokee and Forest City basins, however, are not represented on the Mississippian thickness map. The broad northwesterly trending structural swell, which separates these basins on the Cherokee thickness map (Plate II), trends more or less parallel to the Chautauqua arch. Like the Cherokee and Forest City basins, it had no obvious pre-Cherokee history east of the Nemaha ridge, unless the broad low dome in Allen County on Plate I represents pre-peneplain deformation on this trend. Folding of the Chautauqua arch, if it were revived during Cherokee time, is not shown by the 50-foot thickness lines of Plate II. The Fredonia and associated anticlines, which overlie northwesterly trending local folds in the Mississippian, were strongly rejuvenated during Cherokee time and more slowly during later Pennsylvanian time. Slow growth of most of the northeasterly trending folds continued through the Pennsylvanian and Permian. The activity of northwesterly trending folds is exemplified by the Ellsworth-Kanapolis anticline in Ellsworth County, on which Pennsylvanian, Permian and Cretaceous beds are folded.
It appears, therefore, that only northwesterly trending folds were active in pre-Mississippian time. The folds with this trend and the more important northeasterly trending folds were active in pre-Pennsylvanian time when the Mississippian rocks were deformed, and again through the Pennsylvanian and the Permian and even during the Cretaceous. Either the stresses that produced these two sets of folds were alternately active or the folds represent different expressions of the same stresses more or less simultaneously relieved. Most of the folds trending in a northeasterly direction, as discussed above, originated during the initial deformation of the Mississippian rocks and continued their growth through Pennsylvanian and Permian time. Some exceptions to this regularity of growth are mentioned below.
A pre-peneplain fold, shown by the narrow belt of thin Mississippian limestones that trends northeast from the center of T. 13 S., R. 3 E. (Plate I), has a pre-peneplain structural relief of about 50 feet, but is reported to have very slight, if any, development in the exposed Permian rocks. Some folds with little or no pre-peneplain deformation were folded chiefly or entirely after peneplanation. Such folds are illustrated by the Dexter-Otto anticline in Cowley County and the Beaumont anticline in Cowley and Greenwood counties. Both anticlines lie within areas of thin Mississippian rocks in northeastern Cowley County; but their expression on the Mississippian thickness map is so feeble and local that their existence would probably not have been recognized had it not been known that strong folds were present in the overlying Pennsylvanian rocks. The expression on the thickness map of these and some other anticlines in Cowley County is to some extent clouded by the unconformity at the base of the Mississippian limestone.
The Abilene anticline in Dickinson and Clay counties is another example of a fold that is well developed in the surface rocks, but without expression on the thickness map of the Mississippian rocks. Although few wells have been drilled through the Mississippian on the axis of the anticline, it does not appear from the evidence to have been folded before the Pennsylvanian. Other folds of the Abilene anticline type may be present in other parts of eastern Kansas. Some of the anticlines that, yield oil and gas from Pennsylvanian rocks are not expressed by thinning of the Mississippian rocks on the map, but they may do so when test wells have been drilled on them through the Mississippian.
The thinning of the Mississippian limestones on the southern part of the Longton anticline, in Chautauqua and Elk counties, shows definite deformation at the close of peneplanation. The absence of thinning on its northern extension in Greenwood County, where it is shown by deformation of the Pennsylvanian rocks, means that this part of the anticline was developed at a later date.
On Plate I the anticlines on the Halstead-Graber structural trend (T. 23 S., R. 2 W., to T. 21 S., R. 1 W.) show offset relations. Parts of the Nemaha ridge in Sumner, Cowley and Butler counties show secondary folds trending north or northwest at a slight angle with the axis of the Nemaha ridge. It is believed by many geologists (Fath, 1920; Fath, 1921) that en echelon faults and folds in the relatively incompetent Pennsylvanian and Permian rocks are the expression of deep-seated horizontal displacements in the pre-Cambrian rocks. The deep-seated vertical and horizontal movements in these rocks would, it is believed, be expressed by similar displacements in the overlying relatively competent Paleozoic rocks, chiefly limestones of pre-Pennsylvanian age.
Productive oil and gas pools in Mississippian rocks and in anticlinal folds in other rocks are shown in Plate I. Productive pools in lenticular sand bodies, including shoestring sands, have been omitted. [Note: The writer is indebted to W. L. Stryker, of Fredonia, for the identification of productive anticlinal structures in Wilson and adjoining counties, where a large part of the production has come from lenticular sandstones.] A great many of the pools shown, although their oil and gas are produced from rocks older or younger than the Mississippian, lie in areas of anticlinal thinning of the Mississippian limestones. The clearness with which the outlines of the pools are indicated by the thickness lines depends on the number of available well logs. The Ritz-Canton pool in T. 19 S., Rs. 1 and 2 W., and the Lerado pool in T. 26 S., R. 9 W., are not very sharply indicated by the 50-foot thickness lines, but an intermediate 25-foot thickness line, omitted from the map, shows a close relation between productive oil and gas areas and thinning. Some anticlinal pools east of the Nemaha ridge are in areas where drilling has not yet shown the thickness of the Mississippian and its relation to the structure.
In many places the oil and gas pools do not coincide exactly with the structurally high areas indicated by thinning of the Mississippian rocks. This is shown in the Graber pool in T. 21, S., R. 1 W., in the McPherson pool in T. 18 S., R. 2 W., in the Halstead pool in T. 23 S., R. 2 W., in the Haven pool in T. 24 S., R. 4 W., in the Florence pool in T. 21 S., R. 5 E., and elsewhere. In some localities the failure of the oil- or gas-producing wells to coincide exactly with the areas having thin Mississippian rocks may be attributed to faulty data or to discontinuity of porosity in pools where the production is from limestone. The writer believes that in many places the discrepancy is due to renewal of folding at a later date with enough change in the location of maximum intensity of deformation to shift the crest shown by the thickness lines to another part of the anticline, and thus, in some anticlines, to cause the crests of oil-producing anticlines in younger rocks to be eccentric to the crests shown by thin areas of Mississippian limestone.
The association of anticlines producing oil and gas with the thinning of the Mississippian limestones is so close, however, that where a well shows the Mississippian limestones to be thinner than in near-by areas, it seems probable that an anticline whose crest may not have been drilled is present in the vicinity. Although structural conditions favorable to the occurrence of oil may be indicated in this way, there may also be factors unfavorable to oil accumulation, inasmuch as some strong anticlines such as the Burns dome (T. 23 S., R. 5 E.), the part of the Valley Center anticline that lies west of Wichita (Tps. 27 and 28 S., R. 1 W.), a fold on the Nemaha ridge (T. 33 S., R. 2 E.), and others have proved unproductive up to the present. Some anticlines in Wilson County, which were well developed on the post-Mississippian peneplain, do not yield oil from pre-Pennsylvanian rocks, although the overlying Pennsylvanian rocks are productive.
Thin areas of the Mississippian that suggest the presence of incompletely explored structural highs near by, but not necessarily the presence of oil, occur in the following places:
Some areas of thinning, which have been contoured as noses in areas of few wells, suggest the possibility of structurally high areas in their general vicinity. These include the following localities:
A broad area of thinning occurs in southern Douglas and Franklin counties. The thinner parts of this area in Douglas County show a trend from east to west. In Franklin County not enough wells have been drilled to show the trend. Other less pronounced areas of thinning are suggested at many points by the configuration of the thickness lines.
In some of the areas mentioned other factors may perhaps already have condemned them as possible oil- or gas-producing areas. Detailed structural maps of the region are not available to the author, but enough oil- and gas-producing areas are eccentric to areas of thin Mississippian limestone to suggest that further examination and perhaps exploration of some of the areas of thin limestone is warranted, even though dry holes appear to have been drilled near the crests of some of the anticlines.
The Mississippian has produced oil and gas in generous quantities in Kansas. The principal production from some of the largest pools in the state comes from the Mississippian. These pools are located on the Voshell anticline and other folds in Reno, Rice and Harvey counties. Most of the wells that yield oil from pools in the Mississippian east of the Nemaha ridge have had initial productions of less than 100 barrels, but the yield per acre in some pools has been high. Part of the Virgil pool of Greenwood County (T. 24 S., R. 12 E.) is reported by Beekley (1929) to have produced approximately 6,000 barrels of oil per acre from the Mississippian, although the average initial production of wells in the same part of the pool was only 28.5 barrels per day. Tn general, however, the Mississippian rocks east of the Nemaha ridge have been less productive than the Pennsylvanian and also less productive than the Mississippian rocks west of the ridge. There are many Mississippian pools west of the Nemaha ridge, also, in which production has been secondary in importance to production from Pennsylvanian or pre-Chattanooga rocks.
The Mississippian provides the reservoir rock of important gas pools in Barber County and on the Voshell anticline and elsewhere. Several gas wells have had initial productions in excess of 50,000,000 cubic feet (Garlough, 1935). The Medicine Lodge gas pool in Barber County (T. 33 S., R. 13 W.) was discovered in January, 1927. Garlough reports that up to January 1, 1932, seven wells had been drilled whose average initial production was 18,900,000 cubic feet. The Canton gas pool (secs. 16, 17, 20 and 21, T. 19 S., R. 1 W.) is reported by Garlough to have been discovered in February, 1931. By the end of the year sixteen gas wells had been drilled whose average initial production was 28,740,000 cubic feet. The average initial production of other Mississippian gas pools in the state ranges from five to eighteen million cubic feet, though some small gas pools have had lower initial production per well.
The variability in productivity of the Mississippian oil pools is shown in the accompanying table (Table No. 2), which gives the production per acre, up to January 1, 1938, of several important oil pools producing from Mississippian rocks west of the Nemaha ridge. Most of the pools are still producing. The data are adapted from a report by Ver Wiebe (1938).
Table 2--Partial list of all fields producing from Mississippian limestone. Shows variability of per-acre production.
| Date of discovery |
Acres | Total production to Jan. 1, 1938 |
Production in barrels per acre |
|
|---|---|---|---|---|
| Harvey County: | ||||
| Halstead pool, T. 23 S., R. 2 W. |
Apr. 1929 | 1,200 | 636,000 | 530 |
| McPherson County: | ||||
| Johnson pool, Tps. 19 and 20 S., R. 3 W. |
Jan. 1932 | 1,200 | 2,100,000 § | 1,750 |
| McPherson pool, T. 18 S., R. 2 W. |
July, 1928 | 2,000 | 600,000 §† | 300† |
| Voshell pool,* Tps. 20 and 21 S., R. 3 W. |
Aug. 1929 | 3,500 | 21,068,598* | 6,020*† |
| Ritz-Canton pool,* Tps. 19 and 20 S., Rs. 1 and 2 W. |
Dec. 1928 | 13,000 | 28,850,360*† | 2,219*† |
| Rice County: | ||||
| Welch pool, ‡ Tps. 20 and 21, R. 6 W. |
Apr., 1924 | 1,500 | 3,800,774‡ | 2,534‡ |
| Reno County: | ||||
| Burrton pool, Tps. 23 and 24 S., R. 4 W. |
Apr. 1931 | 5,000 | 21,410,489† | 4,282† |
| Sedgwick County: | ||||
| Robbins pool, T. 28 S., R. 1 E. |
Apr. 1929 | 420 | 2,511,311 | 6,000 |
| Sumner County: | ||||
| Wellington pool, Tps. 31 and 32 S., R. 1 W. |
Dec. 1929 | 1,200 | 2,504,685 | 2,087 |
| *Includes production from Viola limestone and Wilcox sand. †Large production of gas in addition to oil. ‡Production in part from Pennsylvanian basal conglomerate. §Estimated. |
||||
The accompanying table (Table 3), gives a list of oil and gas pools that derive their production in whole or in part from the Mississippian rocks, together with such production figures as are available for the various pools. Most of the data has been taken from a production report in the transactions of the American Institute of Mining and Metallurgical Engineers for 1937, compiled by Ver Wiebe and Dahlgren (1938) and their predecessors who assembled the information in a series of annual reports.
Oil produced from the Mississippian has been found chiefly in the zone of weathered rock at or near its top and in porous zones, probably caused by solution in the upper 100 feet. The depth below the top of the Mississippian to the productive zones varies a great deal indifferent pools and within the same pool. Oil has been found in the weathered upper 30 feet in less than half of the pools that have produced from the Mississippian rocks. In the others a caprock of barren limestone from 10 to 60 feet thick is penetrated before encountering oil. In part of the Burrton pool in T. 24 S., R. 4 W., the first oil in some wells is encountered in chert or limestone 25 feet below the top of the Mississippian. In other wells of this pool oil was not encountered until after a greater thickness of barren limestone was penetrated. In one well no oil was found until 95 feet and in another until 106 feet of barren limestone had been penetrated. In T. 23 S., R. 4 W., the oil in most wells is encountered at about 65 feet, and in some wells production continues to 103 feet below the top. Important amounts of gas, however, are produced within 20 feet of the top of the Mississippian. In the Johnson pool, Tps. 19 and 20 S., R. 3 W., gas is encountered at a depth of about 35 feet and is produced as much as 113 feet below the top of the Mississippian.
Most of the areas in which the productive zone of oil or gas extends downward more than 40 feet below the top of the Mississippian are on the Voshell anticline. Oil and gas were obtained in chert in the Welch pool, Tps. 20 and 21 S., R. 6 W., to a depth of 90 feet below the top of the chert in one well, but the upper part of the chert in this pool is probably Pennsylvanian basal conglomerate. In a well in the Ritz pool, T. 19 S., Rs. 1 and 2 W., oil is found to a depth of 61 feet below the top of the chert. Elsewhere the top of the producing zones is rarely more than 25 feet below the top of the Mississippian, the producing zone continuing downward in some wells to 45 feet below the top.
The oil occurs in cavities in the limestone or in weathered chert. The openings in the limestone are probably in part capillary openings, but most of the voids are relatively large and are irregularly connected by devious solution channels. Many of these openings have become partly or wholly sealed since they were charged with oil. Oil in interconnecting large openings penetrated by the drill escapes readily toward drill holes. Solution openings which may have been partly or wholly sealed off by cementation are opened up by the use of acid, thus establishing more direct and open channels for the escape of the oil. It is because the oil is mostly found in coarse and openly connected cavities that oil wells in the Mississippian lime have generally a large initial yield, but a rapid decline.
Most of the pools in Mississippian rocks produce considerable amounts of salt water with the oil. Each of the large and small connected chambers of the reservoir has its own gravitational arrangement of gas, gas-saturated oil, and water under a uniform pressure. When the well is drilled these static conditions are destroyed by the escape of gas; oil and gas rush to the drilled hole; and the oil and water in the small interconnected chambers become mixed by the violent agitation of the escaping gas. More water is thus brought to the surface from oil reservoirs in limestone than from oil in sandstone reservoirs, where the water is more sharply segregated around the flanks of the structure in the more minute but more freely connected openings between sand grains.
At the close of peneplanation in pre-Cherokee time a considerable diversity of Mississippian formations was exposed on the surface, owing to the beveling of the folded Mississippian formations. The ground-water level of this period, which must have been near the surface, cut across the contacts of the different formational units and produced more or less horizontal porous zones in all the exposed formations at and near the surface. In pre-Cherokee time, when parts of the region stood considerably above sea level, particularly west of the Nemaha ridge, horizontal solution zones were, it is believed, formed in the more soluble and less shaly portions of the limestones, irrespective of the stratigraphy. Oil and gas are found, in consequence, in nearly every one of the formational units of the upper part of the Mississippian, as the occurrence of oil and gas is dependent more on the occurrence of porous zones than on the character of any particular lithologic unit. It is possible that some porous zones are associated with unconformable contacts within the Mississippian limestone. The periods of erosion responsible for these unconformities, however, were all followed by a resumption of limestone deposition, when the residual materials of the eroded surfaces seem to have been in the main recemented without leaving sufficiently continuous porous zones for either the migration or accumulation of oil.
Production from the Mississippian rocks is chiefly from anticlines, presumably in solution-formed zones that originally were more or less horizontal. It appears to be possible, however, for oil to be trapped on the flanks of anticlines by interruption of the porosity up-dip. The Hazlett pool in the northeast corner of T. 24 S., R. 4 E., may illustrate this type of accumulation, because the producing area appears to lie on the west flank of a pronounced anticline. Mississippian rocks on the crest of this fold are apparently unproductive. The control for the thickness map in this area, however, is imperfect. The Potwin pool, which surrounds the common corner of Tps. 24 and 25 S., Rs. 3 and 4 E., appears to be eccentric to structure, though this also may be due to lack of adequate data for the thickness map.
The exact relations of the producing zone in the Mississippian in the Wellington pool, T. 31 S., R. 1 W., are not known, since few wells have been drilled through the Mississippian in that part of Sumner County. The overlying beds of Pennsylvanian age, however, are reported to be anticlinal.
In the Wherry pool, T. 21 S., R 7 W., the oil comes from the Pennsylvanian basal conglomerate and probably in part also from residual chert or weathered chert in place. Stryker, regards the oil produced from chert in some of the areas in Wilson County as having been trapped in lenses of clastic rock formed on the flanks of pre-Cherokee topographic highs (W. L. Stryker, oral communication).
The Robbins pool, T. 28 S., R. 1 E., is unique in that it produces from noncherty porous dolomite below a white limestone caprock at the top of the Mississippian.
Table 3--Pools producing oil and gas from Mississippian limestones. The available production figure is given for each.| Pool | Location | Age of pool at end of 1937 |
Area of pool | Total production to end of 1937 |
Production in 1937 |
Figures include production from the following formations as well as from Mississippian limestone | |||
|---|---|---|---|---|---|---|---|---|---|
| Year | Month | Oil, acres |
Gas, acres |
Oil, bbls |
Gas, million ft |
||||
| Barber County: | |||||||||
| Medicine Lodge | T. 33 S., R. 13 W. | 9 | 6,000 | 21,000d | a | Small production of oil from Viola limestone. | |||
| Butler County: | |||||||||
| Brandt | sec. 15, T. 28 S., R. 7 E. | 1 | 7 | 40 | 8,867 | 6,137 | |||
| Benton | sec. 10, T. 26 S., R. 3 E. | 12 | 40 | a | 6,036 | ||||
| Hazlett | sec. 1, T. 24 S., R. 4 E. | 16 | 40 | a | 1,122 | ||||
| Leon | sec. 19, T. 27 S., R. 6 E. | 19 | 500 | a | 37,825 | Viola limestone | |||
| Potwin | Tps. 24 and 25 S., Rs. 3 and 4 E. | 16 | 3,000 | a | 414,980 | Lansing-Kansas City limestone. | |||
| Steinhoff | sec. 21, T. 29 S., R. 6 E. | 11 | 40 | a | 7,120 | ||||
| Young | sec. 27, T. 26 S., R. 7 E. | 17 | 400 | a | 37,568 | ||||
| Chautauqua County: | |||||||||
| Foster | sec. 6, T. 33 S., R. 12 E. | 6 | 40 | a | a | ||||
| Coffey County: | |||||||||
| Van Noy | T. 23 S., Rs. 14 and 15 E. | ? | ? | 150 | a | 47,052 | Peru sandstone | ||
| Cowley County: | |||||||||
| Dexter-Otto | Tps. 33 and 34 S., Rs. 6 and 7 E. | 34 | 1,000b | a | 4,538 | Admire and Shawnee formations | |||
| Geuda Springs | sec. 8, T. 34 S., R. 3 E. | 1 | 8 | 80 | 70,472 | 54,298 | |||
| Murphy | sec. 8, T. 35 S., R. 3 E. | 4 | 120 | a | 44,158 | ||||
| Elk County: | |||||||||
| Denton | sec. 29, T. 30 S., R. 9 E. | 26 | 3,600b | a | a | Encill sand and Arbuckle limestone | |||
| Hanna | sec. 12, T. 29 S., R. 8 E. | ? | ? | 600 | a | a | |||
| Julian | sec. 35, T. 31 S., R. 10 E. | 5 | ? | a | a | ||||
| Longton | T. 30, 31, 32 S., R. 12 E. | 35 | 16,000c | 35,000e | a | ||||
| Moline | sec. 3, T. 31 S., R. 10 E. | 10 | 1 | 600 | a | a | Encill sandstone | ||
| Sellars | sec. 11, T. 31 S., R. 9 E. | 6 | 80c | 1,527 | 1,527 | ||||
| Greenwood County: | |||||||||
| Climax | sec. 4, T. 27 S., R. 11 E. | 11 | 160 | a | 6,204d | ||||
| Dunaway | secs. 4 to 34, T. 22 S., R. 13 E. | ? | ? | 1,000 | a | 93,593 | |||
| Eureka | sec. 35, T. 25 S., R. 10 E. | 17 | 1,200 | a | 21,498 | ||||
| Henley | sec. 25, T. 25 S., R. 9 E. | 2 | 40 | a | a | ||||
| Hinchman | sec. 17, T. 24 S., R. 13 E. | ? | ? | 200 | a | 19,814 | |||
| Pedroja | sec. 6, T. 26 S., R. 10 E. | 1 | 40 | a | a | ||||
| Reece | sec. 21, T. 26 S., R. 9 E. | ? | ? | 1,200 | 171,294f | 73,844 | |||
| Severy | sec. 16, T. 28 S., R. 11 E. | ? | ? | 200 | a | 5,400d | |||
| Taylor | sec. 6, T. 27 S., R. 12 E. | 5 | 40 | a | a | ||||
| Virgil | T. 24 S., R. 12 E., and T. 22 S., R. 13 E. |
21 | 18,000 | 25,500,000 | 126,435 | Bartlesville sandstone | |||
| Harvey County: | |||||||||
| Halstead | sec. 11, T. 23, S., R. 2 W. | 9 | 5 | 1,200b | 636,656 | 320,656 | |||
| Hollow-Nikkel | Sec. 19, 20, 30, T. 22 S., R. 3 W. |
6 | 1 | 1,500 | 16,333,585 | 1,217,585 | Lansing-K. C. limestone, Hunton limestone, Wilcox sandstone and Arbuckle limestone | ||
| Sperling | sec. 23, 24, T. 22 S., R. 2 W. | 3 | 11 | 500 | 94,567 | 31,882 | Hunton limestone and Wilcox sandstone | ||
| McPherson County: | |||||||||
| Bornholdt | sec. 30, T. 20 S., R. 5 W. | 5 | 40 | 1,647 | 1,647 | ||||
| Canton-North | sec. 26, T. 18 S., R. 1 W. | 1 | 6 | 40 | 24,827 | 15,043 | |||
| Chindborg | sec. 13, T. 19 S., R. 3 W. | 8 | 700b | 849,349 | 162,000 | Lansing-K. C. limestone | |||
| Graber | secs. 17 and 32, T. 21 S., R. 1 W. | 3 | 8 | 2,400 | 40 | 2,043,081 | 1,414,020 | Misener sandstone, Hunton limestone. | |
| Johnson | Tps. 19 and 20 S., R. 3 W. | 5 | 11 | 1,200 | 2,100,000 | 359,005 | (Also produces gas) | ||
| McPherson | secs. 27, 29, 3 1, T. 18 S., R. 2 W. | 11 | 4 | 2,000 | 600,000 | 26,800 | Lansing-K. C. limestone, Viola limestone | ||
| Ritz-Canton | Tps. 19 and 20 S., Rs. 1 and 2 W. | 9 | 1 | 13,000 | 28,850,360 | 1,981,360 | Lansing-K. C. limestone, Viola limestone, Wilcox sandstone. | ||
| Voshell | Tps. 20 and 21 S., R. 3 W. | 8 | 5 | 3,500 | 21,068,598 | 1,668,598 | Lansing-K. C. limestone, Viola limestone, Wilcox sandstone, Arbuckle limestone | ||
| Marion County: | |||||||||
| Lost Springs | sec. 22, T. 17 S., R. 4 E. | 11 | 4 | 2,400 | a | 100,911 | |||
| Propp | Sec. 8, T. 19 S., R. 4 E. | 11 | 9 | 80C | a | a | |||
| Ness County: | |||||||||
| Aldrich | T. 18 S., Rs. 25 and 26 W. | 8 | 3 | 840 | 19,174 | a | Fort Scott limestone | ||
| Reno County: | |||||||||
| Burrton | T. 23 S., R. 4 W. | 13 | 9 | 5,000 | 21,410,489 | 8,310,489 | Hunton limestone, Arbuckle limestone | ||
| Yoder | sec. 34, T. 24 S., R. 5 W. | 2 | 11 | 500b | 40,838 | a | |||
| Rice County: | |||||||||
| Welch | Tps. 20 and 21 S., R. 6 W. | 13 | 9 | 1,500 | 3,800,774 | 100,974 | |||
| Welch North | sec. 23 T. 20 S., R. 6 W. | 6 | 160 | 9,749 | 9,749 | ||||
| Scott County: | |||||||||
| Shallow Water | sec. 15, T. 20 S., R. 33 W. | 3 | 1 | 600 | 151,446 | a | |||
| Sedgwick County: | |||||||||
| Eastborough | sec. 19, T. 27 S., R. 2 E. | 8 | 5 | 1,000 | 7,216,665 | 268,844 | Viola limestone. | ||
| Goodrich | sec. 16, T. 25 S., R. 1 E. | 9 | 1 | 640 | 1,849,921 | 188,864 | Lansing-K. C. limestone, Viola limestone. | ||
| Greenwich | sec. 14, T. 26 S., R. 2 E. | 8 | 8 | 700 | 8,513,655 | 443,881 | Viola limestone | ||
| Robbins | sec. 20, T. 28 S., R. 1 E. | 8 | 7 | 420 | 2,511,311 | 82,179 | |||
| Stafford County: | |||||||||
| Zenith | sec. 23, T. 24 S., R, 11 W. | 4 | 160 | 11,767 | 11,767 | (Production from sandstone referred to Misener sandstone.) | |||
| Sumner County: | |||||||||
| Padgett | sec. 23 T. 34 S., R. 2 E. | 11 | 3 | 1,800 | 1,600,000 | 93,395 | |||
| Rutter | sec. 21, T. 33 S., R. 2 E. | 11 | 6 | 40 | 13,601 | ||||
| Vernon North | sec. 15, T. 35 S., R. 2 E. | 22 | 6 | ? | 100,902 | a | |||
| Wellington | Sec. 33, T. 31 S., R. 1 W. | 8 | 1 | 1,200 | 2,504,685 | 1,158,879 | |||
| Woodson County: | |||||||||
| Winterscheid | sec. 15, T. 23 S., R. 14 E. | 16 | 7,700 | 914,537f | 300,661 | ||||
| a. No production figures reported. b. Oil and gas. c. Estimated. d. Production in 1936. e. Production to end of 1936. f. Production in 1935, 1936 and 1937. |
|||||||||
Barwick, John S., 1928, Salina basin of north central Kansas: Am. Assoc. Petroleum Geologists, Bull., vol. 12, no. 2; and Hall, Roy H., in discussion, p. 191.
Bass, N. W., 1929, Geology of Cowley County, Kansas: Kansas Geol. Survey, Bull. 12. [available online]
Bass, N. W., 1936, Origin of the shoestring sands of Greenwood and Butler counties, Kansas: State Geological Survey of Kansas, Bulletin 23. [available online]
Beekley, A. L., 1929, Virgil pool of Greenwood County, Kansas: Am. Assoc. Petroleum Geologists, Structure of typical American oil fields, vol. II, p. 143.
Clark, Glenn C., 1926, Wilcox sand production, Tonkawa field, Oklahoma: Am. Assoc. Petroleum Geologists, Bull., vol. 10, No. 9, p. 889, fig. 3; and p. 890, fig. 4.
Clark, Stuart, 1926, Thomas oil field, Kay County, Oklahoma: Am. Assoc. Petroleum Geologists, Bull., vol. 10, no. 7.
Clark, Stuart K., and Daniels, James I., 1929, Relation between structure and production in Mervine, Ponca, Blackwell and South Blackwell oil fields, Kay County, Oklahoma: Am. Assoc. Petroleum Geologists, Structure of Typical American Oil Fields, vol. 1.
Fath, A. E., 1920, The origin of the faults, anticlines and buried "granite ridge" of the northern part of the Mid-continent oil and gas field: U. S. Geol. Survey, Prof. Paper, 128-C, p. 75-84
Fath, A. E., 1921, Geology of the Eldorado oil and gas field, Butler County, Kansas, Kansas Geol. Survey, Bull. 7, p. 150. [available online]
Garlough, J. L., 1935, Gas fields of Kansas west of Nemaha ridge, exclusive of Hugoton district: Am. Assoc. Petroleum Geologists, Geology of Natural Gas, pp. 469, 475-476, 479, 481.
Howell, J. V., 1932, Map showing areal geology of the pre-Chattanooga surface in northeastern Kansas. Kansas Geol. Soc., 6th Annual Field Conference, Guidebook.
Kellett, Betty, 1932, Geologic. cross section, western Missouri to western Kansas: Kansas Geol. Soc. Guidebook, 6th Annual Field Conference.
Knight, G. L., and Landes, K. K., 1932, Kansas laccoliths: Jour. Geology, vol. 40, pp. 8-12.
Ley, Henry A., 1926, The granite ridge of Kansas: Am. Assoc. Petroleum Geologists, Bull., vol. 10, no. 1.
Lugn, A. L., 1934, Pre-Pennsylvanian of Nebraska. Am. Assoc., Petroleum Geologists, Bull. 18, pp. 1610-1611.
McClellan, Hugh W., 1930, Subsurface distribution of the pre-Mississippian rocks of Kansas and Oklahoma: Am. Assoc. Petroleum Geologists, Bull., vol. 14, no. 12.
McGee, D. A., and Clawson, W. W., Jr., 1932, Geology and development of Oklahoma City field, Oklahoma County, Oklahoma: Am. Assoc. Petroleum Geologists, Bull., vol. 16, p. 984.
Miser, H. D., 1934, Carboniferous rocks of Ouachita mountains: Am. Assoc. Petroleum Geologists, Bull., vol. 18, p. 979.
Moore, Raymond C., 1917, Oil and gas resources of Kansas: Kansas Geol. Survey, Bull. 3, p. 169, 1917.
Moore, R. C., and Landes, K. K., 1937, Geologic map of Kansas: Kansas Geol. Survey.
Pierce, W. G., and Courtier, W. H., 1937, Geology and coal and resources of southeastern Kansas coal field: Kansas Geol. Survey, Bull. 24.
Reeves, John R., 1929, Eldorado field, Butler County, Kansas: Am. Assoc. Petroleum Geologists, Structure of Typical American Oil Fields, vol. 2.
Rich, John L., 1933, Distribution of oil pools in Kansas in relation to pre-Mississippian areal geology: Am. Assoc. Petroleum Geologists, Bull., vol. 17, no. 7, fig. 2.
Stryker, W. L., 1925, Subsurface geology of Wilson County, Kansas: Am. Assoc. Petroleum Geologists, Bull., vol. 9, No. 8.
Twenhofel, W. H., and Bremer, Bernard, 1928, An extension of the Rose dome intrusives, Kansas: Am. Assoc. Petroleum Geologists, Bull., vol. 12, no. 7, p. 758.
Ver Wiebe, Walter A., 1938, Oil and gas resources of western Kansas: Kansas Geol. Survey, Mineral Resources Circular 10.
Ver Wiebe, W. A., and Dahlgren, E. C., 1938, Kansas oil and gas during 1937: Petroleum development and technology, Am. Inst. Min. and Met. Eng., Trans., vol. 127, pp. 370-397.
Weidman, Samuel, 1933, Igneous intrusions in Silver City area, Kansas: Am. Assoc. Petroleum Geologists, Bull., vol. 17, no. 10, p. 1, 268.
Kansas Geological Survey, Mississippian Limestones in Central and Eastern Kansas, Oil and Gas Deposits
Placed on web May 13, 2009; originally published in June 1939.
Comments to webadmin@kgs.ku.edu
The URL for this page is http://www.kgs.ku.edu/Publications/Bulletins/26/index.html