![]()
Prev Page--Contents || Next Page--Background, Construction Methods
Chapter 1--Introduction
Origin of Investigation
Seasonal trends have recently been observed in water levels and water quality for two domestic water wells in Marion County, Kansas (O'Connor et al., in preparation). Each well supposedly had been constructed to meet the State's minimum well-construction standards established in 1973. Hydrographs and sample analyses for one well (#31), located in a farm pasture, indicated relatively small water-level and water-quality fluctuations occurred during the period from December 1981 to July 1984 (fig. 1). during the same interval hydrographs and water-quality data for the other well (#10), located six miles south in the small, rural town of Lincolnville, showed much greater fluctuations (Fig. 1). The largest fluctuations generally occurred during the period from late winter to early summer when the ground had thawed, precipitation was increasing, evapotranspiration losses were relatively low, and soil-moisture deficiencies had been satisfied.
Figure 1--Water-level and water-quality hydrographs for monitoring wells #10 and #31 from previous county study (O'Connor et al., in preparation).
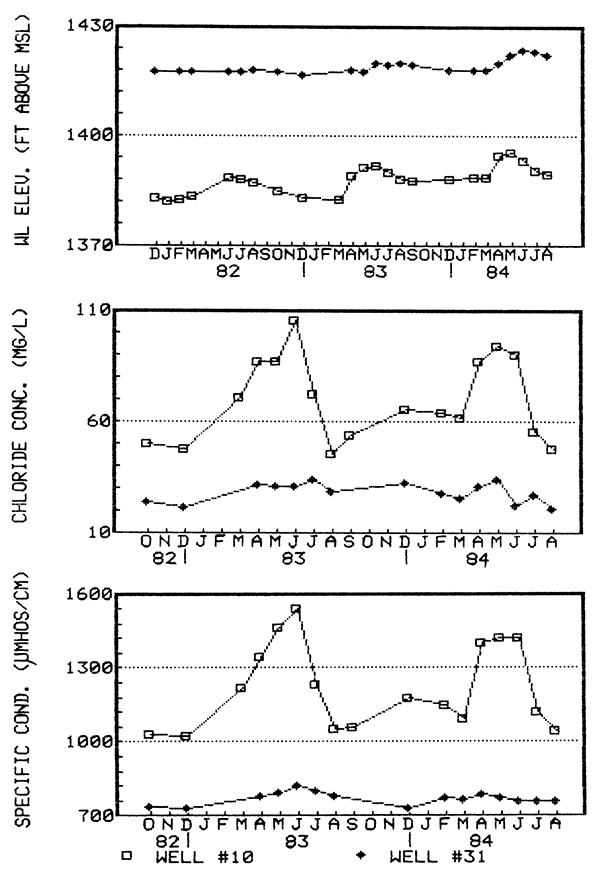
Water levels rose an average of 3 ft in the farm well in comparison with an average of 7 ft in the town well during this period. During this interval chloride concentrations increased an average of 6 and 34 milligrams per liter (mg/l) and specific conductance increased an average of 35 and 322 micromhos per centimeter (µmhos/cm) in the farm and town well, respectively.
Both wells produced ground-water from confined bedrock aquifers for domestic supplies. In addition, both wells had been constructed since 1974 when regulations governing the minimum well-construction standards were established in Kansas. Hydrographs for the farm well were typical of a confined aquifer system characterized by a nearly constant chemical quality. In contrast, the hydrographs for the town well resembled the rapid and sometimes dramatic changes typical of a shallow or surficial aquifer which is more susceptible to chemical changes brought about by natural events occurring at the land surface or from man-induced pollution (Pettyjohn, 1982).
Purpose and Scope
The purpose of the study was to determine the effect of domestic water-well construction on the temporal variability of ground-water quality observed in Lincolnville, Kansas. The methods of water-well construction and completion utilized in Lincolnville both before and since the establishment of minimum well-construction standards in Kansas were investigated. Qualitative and quantitative aspects of the ground-water quality from water wells both in and outside of Lincolnville, and the public-health aspects of the water quality were also studied.
Location and Extent of Study Area
Water wells studied were located in and around the town of Lincolnville in the northeast part of Marion County, Kansas. The area of study includes approximately four square miles whereas Lincolnville itself only covers about two-tenths of a square mile.
Previous work
The previous Marion County study conducted by the Kansas Geological Survey (O'Connor and Chaffee, 1983, and O'Connor et al., in preparation), utilized a private domestic well (#10) in Lincolnville and a domestic farm well (#31) located six miles north as monitoring wells. Water levels were measured in these wells on approximately a monthly schedule for two and one-half years and water samples were collected for determination of chloride concentration and specific conductance during the latter two years. Figure 1 shows hydrographs of these data for wells #10 and #31. The wells, which supposedly had been constructed to meet minimum standards, produced adequate domestic ground-water supplies from confined bedrock aquifers in the Chase Group of Permian age. Some of the construction standards included the use of watertight and approved casing materials, a minimum of 10 ft of grout in the annular space, and disinfection upon completion.
The previous county study also included gaging and sampling of streamflow in Clear Creek just east of Lincolnville, and test-hole drilling and coring at a site just north of the town.
Method of Investigation
The study consisted of two phases. The first phase involved the collection and analysis of existing geologic, hydrologic, and water-quality data for the town of Lincolnville and surrounding area. An initial inventory and screening of twenty private water wells in the study area were made in late July and early August 1984. Monitoring well #10 from the previous county study was included and will be referred to hereinafter as well L10.
The second phase consisted of selecting eight representative wells for use as monthly monitoring wells for a one-year period beginning in September 1984 and ending in August 1985. Fourteen other wells were added after the study began and were monitored on a less regular basis.
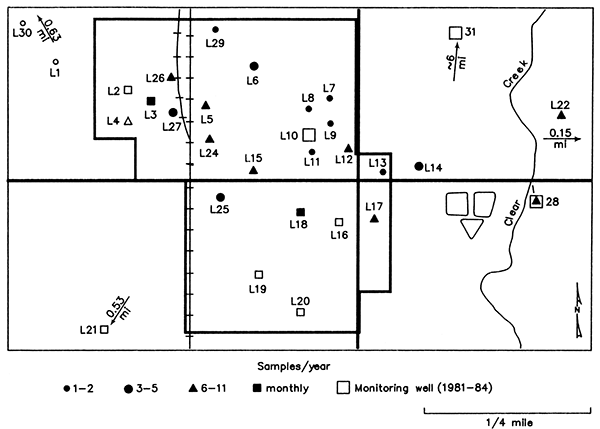
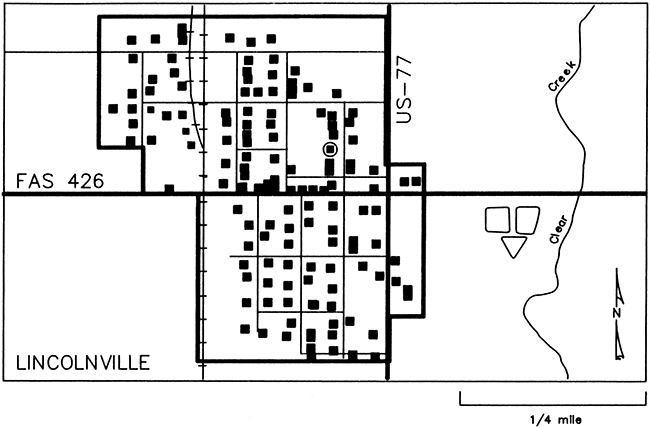
The water samples were analyzed for chloride and nitrate concentrations and specific conductance using in-field testing equipment. Due to a delay in shipping of some of the equipment, in-field nitrate measurement began in November 1984. Monitoring of well #31, also from the previous study, for these three properties was continued. Figure 2 shows the locations of the wells used in the study and the frequency with which they were sampled. Twice during the one-year period water samples from the eight monitoring wells were collected and analyzed for total organic carbon (as volatile and nonvolatile organic carbon) (May and August 1985), fecal bacteria (December 1984 and May 1985), and standard inorganic chemistry (September 1984 and May 1985). One of the sample collections was made during the spring months when water levels, chloride concentrations, and specific conductance had been observed to be at their highest in the town monitoring well, and the other collection during the period when they had declined and become relatively stable, generally in the fall and winter months.
Figure 2--Map of Lincolnville showing the locations of the wells (by well number) used in the study and sampling frequency. The arrows show the direction and distance from the map edge to wells located outside the map figure. The true relationship of these well locations to the study area can be seen in Figure 4. Solid symbols represent wells of pre-standard construction and open symbols represent wells of post-standard construction. Frequency and location of sample collections from Clear Creek are also shown.
Once during the study, water samples were collected from the monitoring wells and analyzed for dissolved gases, including methane, oxygen, and carbon dioxide.
Water samples were collected from Clear Creek on an almost-monthly basis and analyzed for nitrate and chloride concentrations and specific conductance.
Chapter 2--Description of Study Area
Physiography, Geography, and Soils
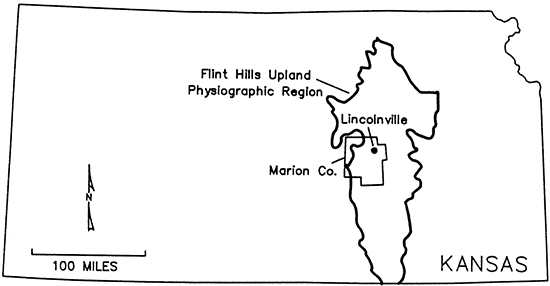
Lincolnville is located in the northeastern portion of Marion County, which is situated along the west edge of the Flint Hills Upland Physiographic Region of eastcentral Kansas (Fig. 3). The town lies between two areas: one to the east that is characterized by a well-dissected topography with deeply-incised valleys, thin soils, and many limestone outcrops, and another to the west characterized by more rounded hills because of the greater thickness of shale exposed at the surface. The major drainage in the study area is southward along the axis of Clear Creek which practically borders the town on the east.
Figure 3--Map of Kansas showing the Flint Hills Upland Physiographic Region, Marion County, and the town of Lincolnville (adapted from Schoewe, 1949).
The predominant soil type in the study area consists of Irwin silty clay loam ranging in thickness from 4 feet, where it overlies thin unconsolidated deposits, to 1 foot where it is underlain by shale or limestone. This soil type has a slow to moderately slow percolation rate (0.06 to 0.6 inches/hour). It is commonly calcareous, has a high to moderate shrink-swell potential, and has a high risk for corrosion to uncoated steel and a low risk to concrete (Soil Conservation Service, 1983).
Geology and Geohydrology
General
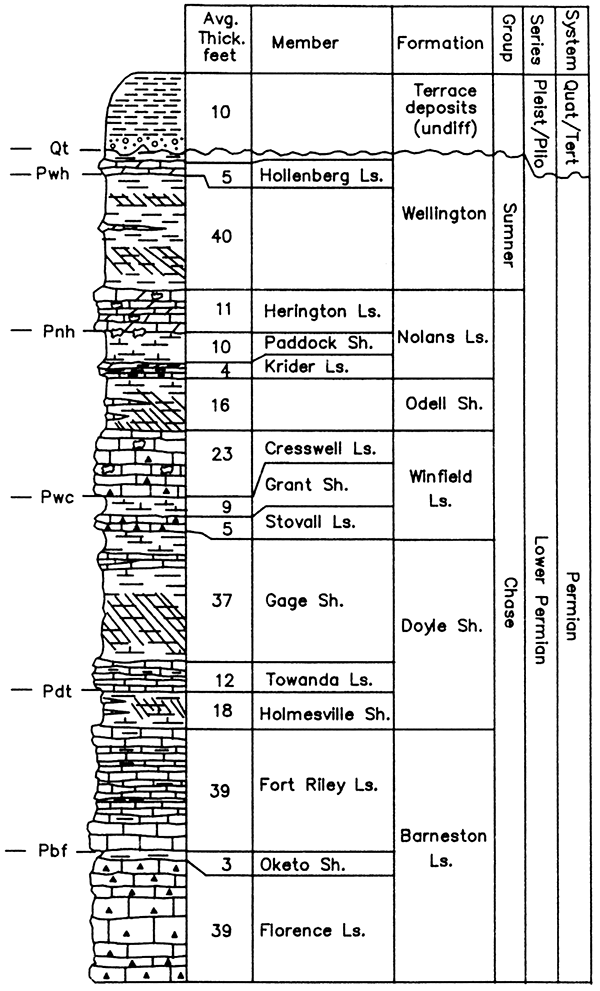
The generalized surface geology of Marion County has been previously described by Byrne et al. (1959). Figure 4 shows the surface geology of a portion of northeast Marion County, including the study area. A simplified stratigraphic column, represented in Figure 5, is useful in the following discussions on the geology and geohydrology of the study area.
Figure 4--Mapped Geologic Bases Northeast Marion County, Ks. (after Meyers, 1984)
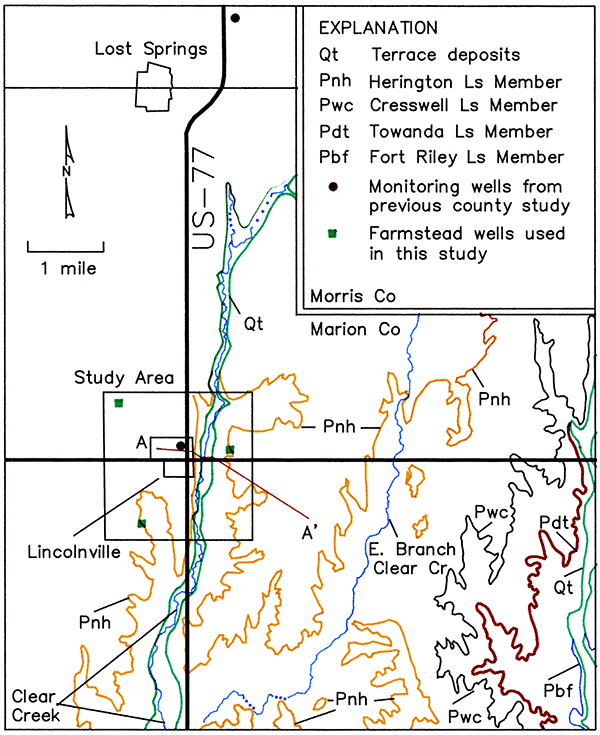
Figure 5--Stratigraphic column of rocks in northeastern Marion County, Kansas (adapted from Moore et al., 1951, Byrne et al., 1959, and Mudge et al., 1958).
Unconsolidated deposits of Quaternary and/or Tertiary age overlie older Permian bedrock in some of the study area (Byrne et al., 1959), but their thickness is generally less than 10 ft; therefore, they were not represented in Figure 4, except along Clear Creek where these deposits reach a thickness of 20 ft (State Highway Commission of Kansas, 1970). However, they are not an important source of ground water in the study area.
Rocks of the lower Sumner and upper Chase groups, Lower Permian Series, are exposed or very near the surface in the study area. In most of the study area, the Wellington Formation occurs as a thin weathered veneer over the Chase Group, becoming thicker to the north and west of Lincolnville. The four uppermost formations of the Chase Group are of hydrogeologic importance to the study.
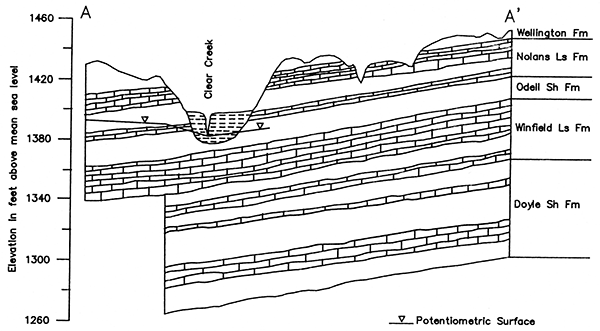
To illustrate the generalized hydrogeologic setting near Lincolnville, a geologic cross-section was constructed (Fig. 6). Its location in the study area is shown as line A-A' in Figure 4. The cross-section is based on a lithologic log submitted by a water-well contractor and a cross-section from a foundation repoLt for the bridge over Clear Creek just east of town (State Highway Commission of Kansas, 1970). In addition, two gamma-ray logs were used in the construction of the crosssection. The gamma-ray and lithologic logs in Lincolnville are provided in Appendix I.
Figure 6--Geologic cross-section A-A' showing potentiometric surface of the Winfield aquifer.
Although several lithologic logs from water-well records (WWC-5 Forms) exist for water wells in the study area, especially in Lincolnville, their inconsistent quality makes interpretation and correlation of the geologic units difficult. The WWC-5 Form or Water Well Record is a standard form which all licensed water-well contractors are required to complete for each water well drilled in Kansas. Regulations concerning the records are administered by the Kansas Department of Health and Environment and the original or first copy of the water Well Record is maintained in a public file by the Kansas Geological Survey. Records of wells used in the study area are included in Appendix II.
Inconsistencies in lithologic logs for different wells result mainly from a lack of the basic knowledge of geology and geologic nomenclature on the part of several of the local water-well contractors. As a result, greater subsurface geologic detail at Lincolnville could not be shown. Although formation and Member boundaries on the geologic cross-section were inferred in places, the four sources of geologic information used represent the best quality available.
The cross-section shows a regional westward dip averaging 15 ft/mi for the geologic units in and east of the study area. The upper formations of the Chase Group, the Nolans and Winfield limestones, contain limestone members that act as aquifers in the study area and are recharged by precipitation where they occur at the surface or at shallow depths. In Lincolnville, the Herington Limestone Member of the Nolans Limestone occurs at a relatively shallow depth as indicated in several water-well records for wells in the town (Appendix II). Therefore, the Herington is easily recharged in Lincolnville and to the east and south of town where it is exposed at the surface (Fig. 4). The Winfield Limestone is recharged east of the study area. The intervening shale unit, the Odell, averages 16 ft in thickness and acts as a confining bed or aquitard.
Nolans Limestone
The Nolans Limestone, comprising two limestone members and a shale member, is reported to reach a thickness of 30 ft in Marion County (Byrne et al., 1959). However, its high topographic position has facilitated weathering and erosion leaving it less than this thickness locally. The uppermost limestone member, the Herington, is thick-bedded, dolomitic and medium-hard near the top; while in the lower part it is thin-bedded and soft. It is characterized by siliceous and calcareous geodes and concretions, and cauliflower-like masses of chert and quartz. The thickness of the Herington is reported to range from 7 ft (Mudge et al., 1958) to 18 ft (Byrne et al., 1959). Upon weathering the Herington increases in porosity and permeability due to solution development along joints, fractures, and calcareous geodes. Evidence of this can be seen at outcrops and in core samples taken from a test hole drilled by the Kansas Geological Survey less than one mile north of Lincolnville. (Appendix I contains the test hole log and includes descriptions of core obtained).
Beneath the Herington is the Paddock Shale Member which is blocky, clayey, and somewhat calcareous in its middle part. Its thickness may average 10 to 15 ft.
The lowermost limestone member of the Nolans is the Krider. It consists of one or more beds of soft, dolomitic and a4gillaceous limestone and averages 4 ft in thickness.
Because of the lithology of the lower Nolans and the nature of the drill cuttings, water-well contractors will commonly refer to a major portion of the lower Nolans as 'clay' or 'shale,' thus making it difficult to differentiate the Paddock and Krider members from the Odell Shale based on the drillers' log from the water-well records.
Although water-well contractors do not report the Nolans as yielding ground water to wells in Lincolnville, some ground water has been reported near the base of the Herington (State Highway Commission of Kansas, 1970) and Krider limestone members of the Nolans (Stout and Brison, 1980). In addition, it has been reported that hand-dug wells supplied ground water from the Nolans early in the town's history during the 1800's. Therefore, it is known that the Nolans is capable of yielding some ground water in Lincolnville, at least during certain times of the year.
Odell Shale
The Odell Shale is mainly silty, varicolored shale, and in its middle part is calcareous. Gray-green and maroon zones are abundant in its upper part and tan-gray and gray zones are typical of the lower part. Its average thickness is about 16 ft in the study area.
Winfield Limestone
The Winfield Limestone, separated from the Nolans Limestone by the Odell Shale, consists of a thick upper limestone Member, the Cresswell, and a thin lower limestone member, the Stovall. The limestone Members are separated by. the Grant Shale Member which is about 8 ft thick.
The Cresswell Limestone Member, averaging 23 ft in thickness, is generally a massive limestone that is locally thin-bedded, clayey, and soft in the upper one-third and thick-bedded and harder with thin shale partings in the lower two-thirds. It commonly bears calcareous and siliceous geodes and concretions.
The Stovall Limestone Member of the Winfield ranges from 2 ft to 7 ft in the study area and is a hard, dense limestone commonly bearing chert nodules.
As with the Nolans Limestone, water-well contractors will refer to the softer zones of the Cresswell as clay or shale. Uery commonly they will log sand and/or gravel while drilling through the Winfield. The 'sand' notation represents the calcite and quartz grains that result from drilling through the calcareous and siliceous geodes while the 'gravel' may represent the siliceous concretions and chert nodules that are commonly found in the Cresswell and Stovall members.
Water wells in the study area obtain all or part of their ground-water supplies from the Winfield Limestone. Water-well records indicate that these wells yield as much as 50 gallons per minute (gpm) from one or two zones in the Winfield. The upper zone is associated with the Cresswell Limestone Member and the lower zone is associated with the Stovall Limestone Member and/or a thin limestone in the upper part of the Gage Shale Member of the underlying Doyle Shale.
Doyle Shale
The Doyle Shale is composed of two shale members separated by a limestone member, the Towanda. The lowermost shale member, the Holmesville, and the Towanda are known to supply some ground water to wells just east of the study area and in Chase County, whereas the uppermost shale, the Gage, does not (Moore et al., 1951). The Gage is primarily calcareous shale with one to four feet of platy limestone in the upper part and varicolored shale in the lower and middle parts. The average thickness of the Gage is 33 ft.
The Towanda Limestone Member consists of many thin beds of hard, gray to tan-brown limestone. It averages 12 ft in thickness and can yield 15 gpm of ground water to wells just east of the study area.
Hydrology
The regional flow of ground water in the Winfield aquifer, which supplies the town of Lincolnville, is to the west following the dip of the Winfield Formation. Locally, ground-water discharge from the Winfield is to Clear Creek and pumping wells in the study area.
As part of the previous county study, streamflow in Clear Creek was measured during base-flow conditions in the fall of 1983. The results showed that Clear Creek was a gaining stream along the reach in the study area obtaining its base flow from effluent seepage from the Winfield and Nolans limestones in and upstream of the study area.
The potentiometric surface of the Winfield aquifer in the study area is shown on the geologic cross-section (Fig. 6), and is based on water-level measurements made in the fall of 1985. The slope of the potentiometric surface towards Clear Creek confirms that the Winfield discharges to the stream.
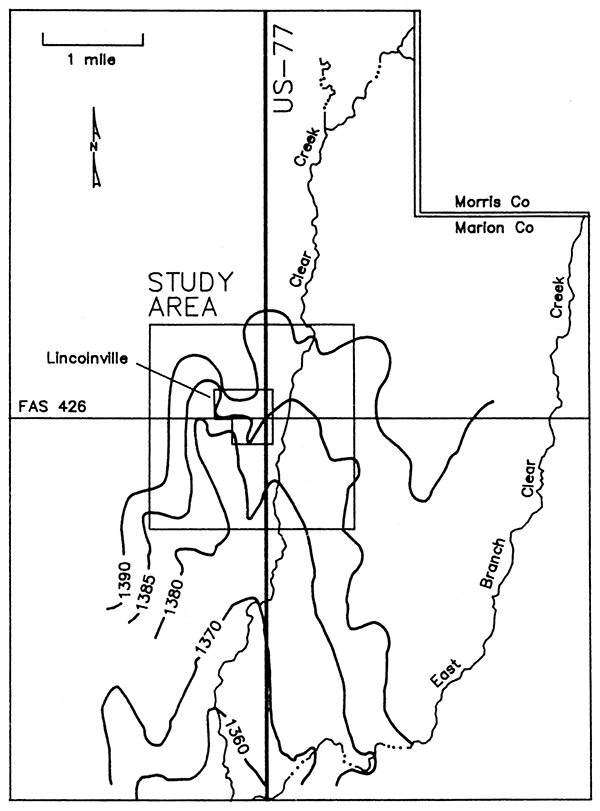
A potentiometric surface map of the region around the study area (Fig. 7), shows the effluent condition of Clear Creek in the study area. The direction of ground-water flow in the study area is towards Clear Creek and a small tributary drainage that is just southwest of town.
Figure 7--Potentiometric surface map of wells completed in the Winfield Limestone in and around the study area.
In addition, artesian flow from the Cresswell Limestone Member was reported during the drilling of pile footings for the bridge over Clear Creek just east of Lincolnville.
Climate
The climate of the study area is characterized by wide variations in temperature and precipitation. The winters are usually short and fairly cold and the summers are relatively long and hot.
The normal annual precipitation, based on a 30-yr period of record (1955 to 1985), is 34.4 inches at Herington, Kansas, 12 mi north of Lincolnville (National Weather Service, NOAA, 1985).
The U.S. Weather Service has maintained a precipitation gage at Lincolnville since 1966. The mean annual precipitation in town for 1980-1986 is 35.2 inches. The monthly precipitation at Lincolnville for the period of January 1981 through August 1985 is shown in Figure 8.
Figure 8--Precipitation at Lincolnville, Kansas.
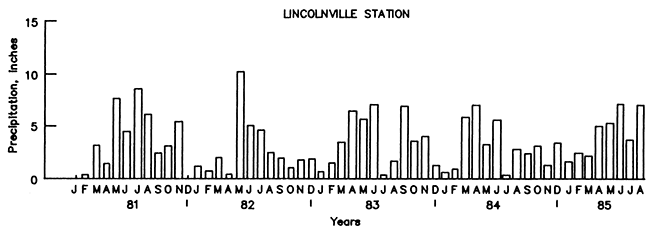
The greatest amount of precipitation generally falls during the growing season, April through September. The normal monthly precipitation values (at Herington), for the months of March through September are listed below:
| Normal Monthly Precipitation (inches) |
|
|---|---|
| March | 2.27 |
| April | 3.04 |
| May | 4.47 |
| June | 5.83 |
| July | 3.73 |
| August | 3.00 |
| September | 4.16 |
The mean annual runoff for the study area is between 3.7 and 3.9 inches (Kansas Water Resources Board, 1960).
Cultural Features
The town of Lincolnville is a small rural community with a population of about 235. Figure 9 shows Lincolnville with its approximately 100 homes, 16 businesses, and two churches. Each building or house utilizes a private well for water supply. Three waste stablization lagoons are located just to the east of town and the public sewer system has been in operation since 1960. The town is served by U.S. Highway 56/77, Federal-Aid Secondary Highway 426, and the Chicago, Rock Island & Pacific Railroad. Three rural farm wells located outside Lincolnville were included in the study for all or part of the 13-month study period.
Figure 9--Map of Lincolnville, Kansas showing cultural features (modified from U.S. Geological Survey, 1971).
Potential point sources of ground-water contamination recognized in Lincolnville are shown in Figure 10. These potential contamination sources involve, for the most part, the small businesses of Lincolnville. They include service stations and bulk petroleum-product storage, where some former spillage and leakage has been reported; a bulk-fertilizer handling and storage facility, where significant spillage along the railroad tracks and around the buildings occurs annually during loading and unloading; and a nearby farm-chemical (herbicides and pesticides) tank-mix area, where spillage also occurs. In addition, a well used for filling the tank where the farm chemicals are mixed was not equipped with a check-valve to prevent back syphoning of the chemicals into the well.
Figure 10--Location of potential point sources of contamination recognized in the study area which include (A) bulk petroleum-product storage and retail service stations, (B) bulk-fertilizer handling and storage, (C) bulk-farm-chemical storage and tank-mixing. (D) grain elevator, (E) garage-machine shop, (F) car wash, (G) waste stabilization lagoons, (H) livestock pens. (I) highway where deicing salts are applied, and (J) septic tanks and lateral fields. The arrows show the direction and distance from the map edge to potential point sources of contamination in the vicinity of wells studied on farms located outside the map figure.
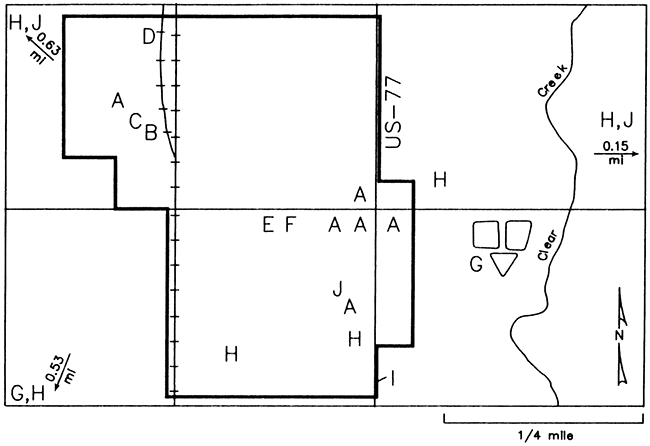
Other potential point sources include a grain elevator, where grain fumigates such as carbon tetrachloride have probably been used; a garage-machine shop, where greases and solvents are used; a car wash, where dirt, manure, highway deicing salts, greases, and other petroleum products are washed from automobiles and farm machinery; waste stabilization lagoons, where the town's sewage effluent is discharged (also a small lagoon is used for domestic wastes at one of the farmsteads used in the study); livestock pens located at each of the farm sites and also a few located on the outer edges of town; and the highway that has deicing salts applied to it in winter.
Potential point sources of contamination in Lincolnville which are not shown in Figure 10 include sewer lines, abandoned dug or drilled wells, trash-burning sites, fertilizers and pesticides applied to lawn and garden areas and pesticides to house foundations, and former privies, septic tanks, and lateral drain fields. However, one former septic tank in Lincolnville that was included in Figure 10, was reported to be 12 ft by 22 ft in size and was used by an old, large school building that was cleared from the site in the 1970's.
Prev Page--Contents || Next Page--Background, Construction Methods
Kansas Geological Survey, Geohydrology
Placed on web March 16, 2016; originally published 1998.
Comments to webadmin@kgs.ku.edu
The URL for this page is http://www.kgs.ku.edu/Hydro/Publications/1988/OFR88_26/02_intro.html