![]()
Prev Page—Recovery || Next Page—Chemical Character
Ground Water, continued
Utilization of Water
Information on 282 wells and springs in Scott County was obtained during the course of the investigation. All known irrigation, public supply, and industrial wells in the county were visited, and all available data concerning them were obtained. No attempt was made to obtain data on all the domestic and stock wells. Of the wells listed in Table 19, 87 are out of use, either temporarily or permanently. The water supplies of the others are as follows: domestic use only, 2; stock use only, 20; domestic and stock, 35; irrigation, 132; public supply, 4; and industrial, 2. Four wells (130, 131, 245, and 248) are used exclusively as observation wells by the Division of Water Resources of the Kansas State Board of Agriculture. Of these four, wells 131 and 245 were drilled by the Division of Water Resources for this purpose.
Domestic and Stock Supplies
Practically all of the domestic and stock supplies in the rural areas and in small towns that have no public water supplies are obtained from wells. In the early days springs and dug wells were used, but in later years drilled wells became more predominant. Springs are the source of supply in some parts of the Scott County State Park and in the northern part of the county. Some of the dug wells have gradually fallen into disfavor because they are subject to pollution and as they are generally not very deep, they are apt to fail in dry weather. Practically all new wells put down in the area are drilled.
On many of the farms drilled wells supply water for livestock and on many farms, the same well supplies water both for domestic use and for watering livestock. Some wells have been put down in pastures for the sole purpose of watering livestock. Springs that yield sufficient water for livestock are found in the northern part of the county. Most of the domestic and stock wells are equipped with windmills capable of pumping a few gallons of water a minute, and some are provided also with auxiliary pump jacks operated by small gasoline engines.
Industrial Supplies
Ground water is used by the Missouri Pacific Railroad at Scott City for boiler supplies for locomotives and by the Shallow Water Refinery south of Shallow Water for cooling and condensing. For some industrial purposes water must be of a certain chemical character and for others its temperature is the most important factor. Water used in boilers should be relatively free from foaming and scale-forming constituents. The ground water in much of the county must be treated to reduce the hardness to make it suitable for boiler use. Some ground water is used in Scott City for air-conditioning, but practically all of the water thus used is purchased from the city. The advantage of using ground water for this purpose is its relatively low uniform temperature throughout the year. The temperature of the ground water in Scott County ranges from about 57° to 60° F.
The largest single industrial use of ground water in the county is the Missouri Pacific Railroad at Scott City. The water, used principally for filling locomotive boilers, is pumped from a well (79) situated just east of the Missouri Pacific depot in Scott City. This well, which is 18 inches in diameter and cased to the total depth of 80 feet with cast-iron casing, derives water from sands and gravels of the Ogallala formation. The well is equipped with an electrically driven, direct-connected deep-well turbine. When drilled in 1927, the reported yield was 150 gallons a minute with a drawdown of 17 feet. Water is stored in a steel tank 44 feet high and 24 feet in diameter having a capacity of 145,880 gallons and in a wooden tank 16 feet high and 16 feet in diameter having a capacity of 31,000 gallons. The water used for locomotive boilers is first treated with the soda-lime process. The total consumption by the Missouri Pacific Railroad at Scott City for the period from December 6, 1939, to December 6, 1940, was 43,034,300 gallons.
The Shallow Water Oil Refinery about 4 miles south of Shallow Water utilizes water from a well (257) drilled in 1942 for cooling and condensing purposes at the refinery. The well, 16 inches in diameter and 180 feet deep, is reported to end in the Niobrara formation and is equipped with a deep-well turbine pump operated by a natural gas power unit. It is reported that the well is pumped continuously at a rate of about 300 gallons a minute.
Public Supplies
Scott City, the only municipality in Scott County with a public water-supply system, obtains its water supply from wells. The smaller communities depend entirely upon private wells. Water obtained from "Big Springs" (17 in Table 19 and shown in Pl. 10) constitutes the principal supply for picnickers and visitors to Scott County State Park in the northern part of the county.
Scott City (population, 2,022) is supplied by three drilled wells (82, 111, and 112, Table 19 and Pl. 2), all of which are within the city limits and all of which derive water from the Ogallala formation. Well 82, under the elevated steel tank near the center of Scott City, is 79 feet deep and its concrete casing is 24 inches in diameter. This well which is equipped with an electrically driven deep-well turbine pump, has a reported yield of 125 gallons a minute. Well 112, situated in the power plant, is 81 feet deep and its galvanized-iron casing is 16 inches in diameter. This well, also equipped with an electrically driven deep-well turbine pump, has a reported yield of 770 gallons a minute. Well 111, just east of the power plant and the newest of the three wells, was drilled in December 1943 to a depth of 225 feet and is reported to end in the Niobrara formation. The well, cased with 18-inch iron casing, is equipped with an electrically driven deep-well turbine pump. Mr. Weishaar, the driller, reported that when the well was tested it yielded 1,246 gallons a minute with a drawdown of 11 feet after several hours of pumping.
Water is pumped from the wells directly into the mains, the excess going into a 40,000-gallon elevated steel storage tank in town. The daily capacity of the system, exclusive of the newest well (111), is about 1,290,000 gallons. No figures on water consumption were obtainable. An analysis of a sample of the water from well 112 is given in Table 15. The water is moderately hard and is not treated.
Table 15—Analyses of water from wells in Scott County, Kansas. Analyzed by Elza H. Holmes. Parts per million (a) and equivalents per million (b) in italics.
| No. on Plate 2 | Location | Depth (ft) | Geologic Horizon | Date of collection 1940 | Temperature (°F) | Iron (Fe) | Calcium (Ca) | Magnesium (Mg) | Sodium and potassium (Na+K) (2) | Bicarbonate (HCO3) | Sulfate (SO4) | Chloride (Cl) | Fluoride (F) | Nitrate (NO3) | Dissolved solids | Hardness (calculated as CaCO3) | ||
|---|---|---|---|---|---|---|---|---|---|---|---|---|---|---|---|---|---|---|
| Total | Carbonate | Noncarbonate | ||||||||||||||||
| 3 | T. 16 S., R. 31 W. SW NW sec. 4 |
27.2 | Alluvium | 18-Nov | 59 | 2.1 | 125 6.24 |
19 1.56 |
3.5 0.15 |
238 3.90 |
171 3.58 |
9 0.25 |
1 0.05 |
12 0.19 |
462 | 394 | 195 | 199 |
| 6 | T. 16 S., R. 31 W. SW SE sec. 25 |
121.1 | Ogallala | 18-Nov | 58 | 0.8 | 48 2.40 |
25 2.06 |
0.5 0.02 |
200 3.28 |
32 0.67 |
11 0.31 |
1.8 0.09 |
8 0.13 |
227 | 225 | 164 | 61 |
| 8 | T. 16 S., R. 32 W. SW NW sec. 2 |
126.9 | Ogallala | 18-Nov | 58 | 2 | 54 2.69 |
14 1.15 |
1.2 0.05 |
198 3.25 |
18 0.37 |
6 0.17 |
1 0.05 |
2.9 0.05 |
198 | 196 | 162 | 34 |
| 12 | T. 16 S., R. 32 W. NE SW sec. 32 |
96.5 | Ogallala | 26-Jun | 58 | 0.08 | 74 3.69 |
19 1.56 |
26 1.14 |
203 3.33 |
84 1.75 |
22 0.62 |
1.8 0.09 |
37 0.60 |
366 | 263 | 166 | 97 |
| 14 | T. 16 S., R. 33 W. SW SE sec. 5 |
143.1 | Ogallala | 19-Nov | 57 | 1.5 | 44 2.20 |
17 1.40 |
19 0.84 |
206 3.38 |
31 0.64 |
7 0.20 |
1.8 0.09 |
8 0.13 |
232 | 183 | 169 | 14 |
| 17 | T. 16 S., R. 33 W. (Big Spring) NE NW sec. 13 |
Ogallala | 26-Jun | 59 | 0 | 44 2.20 |
16 1.32 |
21 0.93 |
205 3.36 |
33 0.69 |
7 0.20 |
1.8 0.09 |
7.1 0.11 |
233 | 176 | 168 | 8 | |
| 30 | T. 16 S., R. 34 W. SE cor. SW sec. 33 |
131.1 | Ogallala | 19-Nov | 57 | 0.36 | 40 2.00 |
21 1.73 |
21 0.89 |
205 3.36 |
38 0.79 |
9.3 0.26 |
2 0.11 |
6.2 0.10 |
240 | 187 | 168 | 19 |
| 43 | T. 17 S., R. 32 W. SW cor. sec. 21 |
98.5 | Ogallala | 18-Nov | 57 | 2.2 | 64 3.19 |
29 2.38 |
8.1 0.35 |
200 3.28 |
67 1.39 |
36 1.02 |
2.2 0.12 |
7.1 0.11 |
316 | 283 | 164 | 119 |
| 47 | T. 17 S., R. 33 W. SW cor. SE sec. 4 |
125.1 | Ogallala | 19-Nov | 57 | 0.67 | 42 2.10 |
23 1.89 |
24 1.06 |
215 3.53 |
43 0.89 |
14 0.39 |
2.3 0.12 |
7.5 0.12 |
264 | 201 | 176 | 25 |
| 54 | T. 17 S., R. 33 W. NW cor. sec. 27 |
61 | Ogallala | 19-Nov | 57 | 0.19 | 55 2.74 |
30 2.47 |
13 0.57 |
205 3.36 |
78 1.62 |
20 0.56 |
2.7 0.14 |
6.2 0.10 |
308 | 261 | 168 | 93 |
| 61 | T. 17 S., R. 34 W. SW cor. NW sec. 30 |
99.5 | Ogallala | 19-Nov | 57 | 2.9 | 60 2.99 |
40 3.29 |
8.1 0.35 |
225 3.69 |
73 1.52 |
27 0.76 |
2.4 0.13 |
33 0.53 |
359 | 319 | 184 | 135 |
| 63 | T. 18 S., R. 30 W. (c) SW cor. sec. 31 |
91.3 | Ogallala | 18-Nov | 58 | 0.17 | 47 2.35 |
31 2.55 |
15 0.67 |
239 (d) 3.92 |
50 1.04 |
14 0.39 |
2.1 0.11 |
1.9 0.03 |
283 | 246 | 200 | 46 |
| 65 | T. 18 S., R. 31 W. NE SE sec. 4 |
88.8 | Ogallala | 18-Nov | 58 | 0.19 | 45 2.25 |
30 2.47 |
15 0.65 |
246 4.03 |
42 0.87 |
9 0.25 |
3 0.16 |
4 0.06 |
271 | 237 | 202 | 35 |
| 70 | T. 18 S., R. 31 W. SE SW sec. 31 |
120.9 | Ogallala and/or Niobrara | 18-Nov | 57 | 5.8 | 341 17.02 |
116 9.54 |
181 7.87 |
163 2.67 |
1315 27.35 |
145 4.09 |
1.5 0.08 |
15 0.24 |
2202 | 1339 | 133 | 1206 |
| 87 | T. 18 S., R. 32 W. NW NW sec. 27 |
68.9 | Ogallala | 19-Nov | 57 | 0.1 | 49 2.45 |
33 2.71 |
19 0.81 |
249 (d) 4.08 |
64 1.33 |
9 0.25 |
2.8 0.15 |
4.9 0.08 |
309 | 258 | 208 | 50 |
| 107 | T. 18 S., R. 33 W. SE cor. NE sec. 12 |
83 | Pleistocene and/or Ogallala | 19-Nov | 57 | 0.49 | 58 2.89 |
25 2.06 |
8.3 0.36 |
239 3.92 |
41 0.85 |
12 0.34 |
1.7 0.09 |
7.1 0.11 |
273 | 249 | 196 | 53 |
| 112 | T. 18 S., R. 33 W. NE SE sec. 13 (public supply at Scott City) |
81 | Pleistocene and/or Ogallala | 8-Apr | 0 | 53 2.64 |
20 1.64 |
24 1.06 |
198 (e) 3.25 |
34 0.71 |
15 0.42 |
2 0.11 |
7.5 0.12 |
277 | 214 | 198 | 16 | |
| 123 | T. 18 S., R. 33 W. SW SW sec. 21 |
138.2 | Ogallala | 26-Jun | 57 | 0 | 45 2.25 |
21 1.73 |
14 0.59 |
214 3.51 |
28 0.58 |
8 0.23 |
2 0.11 |
8.4 0.14 |
233 | 199 | 175 | 24 |
| 142 | T. 18 S., R. 34 W. SE cor. sec. 2 |
100.2 | Ogallala | 19-Nov | 57 | 0.44 | 44 2.20 |
27 2.22 |
15 0.64 |
224 3.67 |
41 0.85 |
11 0.31 |
2.2 0.12 |
6.6 0.11 |
259 | 222 | 183 | 39 |
| 149 | T. 18 S., R. 34 W. SE cor. NW sec. 31 |
134.3 | Ogallala | 18-Nov | 57 | 0.02 | 52 2.59 |
25 2.06 |
14 0.61 |
224 3.67 |
54 1.12 |
13 0.37 |
1.1 0.06 |
2.2 0.04 |
273 | 233 | 183 | 50 |
| 166 | T. 19 S., R. 32 W. NE NE sec. 35 |
126.6 | Niobrara | 18-Nov | 59 | 1.4 | 67 3.34 |
17 1.40 |
8.3 0.36 |
256 4.20 |
34 0.71 |
3.3 0.09 |
0.7 0.04 |
4 0.06 |
264 | 240 | 210 | 30 |
| 174 | T. 19 S., R. 33 W. SE SE sec. 12 |
76 | Pleistocene and/or Ogallala, possibly underlain by Niobrara | 19-Nov | 57 | 0.16 | 70 3.49 |
41 3.37 |
72 3.14 |
307 5.03 |
194 4.04 |
26 0.73 |
2.7 0.14 |
3.3 0.06 |
563 | 344 | 252 | 92 |
| 223 | T. 19 S., R. 34 W. SE SW sec. 30 |
96.3 | Ogallala | 18-Nov | 57 | 1.5 | 50 2.50 |
12 0.99 |
10 0.44 |
198 3.25 |
24 0.50 |
4 0.11 |
0.5 0.03 |
2.7 0.04 |
204 | 177 | 162 | 15 |
| 229 | T. 20 S., R. 31 W. SW cor. SE sec. 12 |
Ogallala and/or Niobrara | 18-Nov | 57 | 1.6 | 61 3.04 |
33 2.71 |
58 2.53 |
276 4.53 |
136 2.83 |
27 0.76 |
2.5 0.13 |
1.6 0.03 |
459 | 291 | 226 | 65 | |
| 230 | T. 20 S., R. 31 W. NW NE sec. 19 |
36.1 | Ogallala and/or Niobrara | 18-Nov | 58 | 0.49 | 112 5.59 |
35 2.88 |
22 0.95 |
359 5.89 |
99 2.06 |
47 1.33 |
0.7 0.04 |
6.2 0.10 |
502 | 425 | 294 | 131 |
| 236 | T. 20 S., R. 32 W. SW SW sec. 8 |
44.2 | Pleistocene and/or Ogallala, possibly underlain by Niobrara | 18-Nov | 58 | 3.3 | 64 3.19 |
24 1.97 |
99 4.29 |
342 5.61 |
145 3.02 |
26 0.73 |
1 0.05 |
2.4 0.04 |
536 | 264 | 264 (f) | 0 |
| 252 | T. 20 S., R. 33 W. NE NW sec. 11 |
107.5 | Pleistocene and/or Ogallala | 26-Jun | 57 | 0 | 48 2.40 |
16 1.32 |
23 0.99 |
220 3.61 |
33 0.69 |
10 0.28 |
1.4 0.07 |
3.5 0.06 |
245 | 186 | 180 | 6 |
| 262 | T. 20 S., R. 33 W. NW SW sec. 16 |
102 | Pleistocene and/or Ogallala | 18-Nov | 57 | 0.1 | 44 2.20 |
15 1.23 |
13 0.57 |
190 (g) 3.12 |
26 0.54 |
2.5 0.07 |
1 0.05 |
3.8 0.06 |
205 | 172 | 164 | 8 |
| 271 | T. 20 S., R. 34 W. NW SE sec. 2 |
109.1 | Ogallala | 26-Jun | 58 | 0 | 46 2.30 |
15 1.23 |
20 0.87 |
211 3.46 |
27 0.56 |
7 0.20 |
0.8 0.04 |
8.8 0.14 |
231 | 177 | 173 | 4 |
| 276 | T. 20 S., R. 34 W. SW SW sec. 16 |
126.1 | Ogallala | 18-Nov | 58 | 0.19 | 43 2.15 |
13 1.07 |
3.9 0.17 |
185 3.03 |
8.4 0.18 |
3 0.08 |
0.3 0.02 |
4.9 0.08 |
169 | 162 | 152 | 10 |
a. One part per million is equivalent to one pound of substance per million pounds of water or 8.33 pounds per million gallons of water.
b. An equivalent per million is a unit chemical equivalent weight of solute per million unit weights of solution. Concentration in equivalents per million is calculated by dividing the concentration in parts per million by the chemical combining weight of the substance or ion.
c. Situated in Lane County.
d. Sample also contains 2.4 parts per million carbonate (0.08 equivalents per million).
e. Sample also contains 22 parts per million carbonate (0.73 equivalents per million).
f. Total alkalinity, 280 parts per million; excess alkalinity, 16 parts per million.
g. Sample also contains 4.8 parts per million carbonate (0.16 equivalents per million).
Irrigation Supplies
Many large wells in Scott County supply water to irrigate crops. A discussion of the early history of irrigation and of its subsequent growth is given by McCall (1944) who points out that irrigation from ground-water supplies in Scott County was practiced as early as 1888. This early development was limited principally to irrigating small garden plots from windmills. According to McCall, the next phase of irrigation development began in June 1908, when E. E. Coffin operated an irrigation plant near the center S. line sec. 36, T. 18 S., R. 33 W. The well was 90 feet deep with a 9-inch casing and was equipped with a small centrifugal pump driven by a small gasoline engine. Its reported yield was 120 gallons a minute.
Other irrigation wells were soon constructed, so that as early as 1910 there were perhaps a dozen or more irrigation plants using wells. In 1911, two large-scale windmill plants were constructed.
One such plant consisted of a circular reservoir 200 feet in diameter and 4 feet deep with a metal side wall set in a concrete foundation. This reservoir was surrounded by 10 wells and irrigated 50 acres of alfalfa.
In addition to the individual irrigation projects already mentioned several large financial interests were early attracted by the irrigation possibilities of Scott County. In 1909 the Great Western Irrigation Company attempted a development whereby ground water in the immediate vicinity of Whitewoman Creek would be brought to the surface by gravity flow. After some small experimental construction work, this project was abandoned.
At about the same time Marks and Son of Chicago bought a large block of land in the southwestern part of the area and for more than 20 years this tract of land was partially developed and managed by the company. Some development was also started on a 25,000-acre tract near Shallow Water by the Garden City Development Company, a group of investors associated with the railroad construction from Garden City north through Scott City. In 1916, the Garden City Company, owners of the sugar beet plant at Garden City and of electric lines in the Arkansas Valley, purchased 22,880 acres in south-central Scott County, constructed several irrigation wells, and built a power line to the area. The wells were equipped with deep-well turbines powered by very large direct-connected electric motors. Well sites were selected largely on the basis of favorable topographic position without any preliminary test drilling. As a result, the yields of some of these wells were rather disappointing.
By 1917, J. W. Lough, who has been called the "father of pump irrigation in Scott County," had completed a $75,000 electric generating plant to furnish power to his own pumping plants. The major development prior to 1920 was near Whitewoman Creek in T. 19 S., R. 33 W. where the J. W. Lough and Marks holdings are located. Knapp (1923, pp. 217, 223) reported that 4,921 acres of land in Scott County were under irrigation with water pumped from wells. McCall (1944) points out that the irrigated acreage in Scott County seems to have reached its maximum with the amount reported in 1922, and thereafter it declined until the early 1930s. The use of a great many of the pumping plants was discontinued and very few new wells were drilled. The probable reasons for this decline are discussed by McCall.
A continuous and more detailed record of development in Scott County is available since 1930. Beginning in 1931, the Division of Water Resources of the State Board of Agriculture has made annual surveys of the acreage irrigated from wells. Other pertinent information has been gathered also regarding crops irrigated and the irrigation plants used. The annual survey has been made at or near the end of the pumping season when the actual acreage irrigated on each farm could be readily determined. The following table, which is taken from McCall's report (1944, p. 17) and from data in the files of the Division of Water Resources, shows the manner in which expansion has occurred.
Table 9—Development of irrigation in Scott County for the period 1931 to 1946.
| Year | Rainfall | Irrigated acreage |
Number of pumping plants |
Acres per pumping plant |
|---|---|---|---|---|
| 1931 | 18.38 | 2,265 | 13 | 174 |
| 1932 | 20.06 | 1,021 | 10 | 102 |
| 1933 | 24.84 | 2,035 | 19 | 107 |
| 1934 | 12.65 | 3,859 | 28 | 138 |
| 1935 | 15.54 | 4,234 | 29 | 146 |
| 1936 | 18.21 | 3,849 | 30 | 128 |
| 1937 | 13.11 | 6,828 | 43 | 159 |
| 1938 | 14.92 | 10,355 | 53 | 195 |
| 1939 | 14.63 | 12,298 | 64 | 192 |
| 1940 | 16.88 | 17,164 | 84 | 202 |
| 1941 | 24.63 | 16,427 | 85 | 194 |
| 1942 | 22.24 | 18,651 | 97 | 192 |
| 1943 | 10.38 | 21,320 | 118 | 181 |
| 1944 | 29.92 | 16,890 | 127 | 133 |
| 1945 | 14.22 | 21,002 | 129 | 162 |
The irrigated acreage reached its lowest point in 1932. Following 1932 it increased slowly until 1937 when it began to expand, rapidly reaching a peak of 21,320 acres in 1943.
McCall (1944) points out that a relatively large acreage may be irrigated during years of more than normal rainfall, but the amount of water pumped may be less as compared with other years when rainfall is deficient. In Scott County the total pumping for different years can be compared since electric and natural gas utilities furnish almost all of the energy for pumping. Electricity has been available to irrigators for nearly two decades, and since 1937 natural gas has been piped through the area. The data for Table 10 were obtained from McCall's report (1944, p. 18) and from the files of the Division of Water Resources.
Table 10—Use of electricity and natural gas for irrigation, amount of pumpage, and the acreage irrigated in Scott County for the period 1938 to 1945.
| Year | Electricity, total KWH |
Natural gas, total cu ft |
Indicated pumpage acre-ft |
Acres irrigated |
Acre-ft per acre |
Departure from normal rainfall |
|---|---|---|---|---|---|---|
| 1938 | 1,050,712 | 9,544,300 | 14,200 | 10,355 | 1.4 | -5.8 |
| 1939 | 1,326,677 | 27,092,300 | 21,200 | 12,298 | 1.7 | -3.98 |
| 1940 | 1,143,837 | 29,164,210 | 20,800 | 17,164 | 1.2 | -1.73 |
| 1941 | 654,105 | 15,562,400 | 10,800 | 16,427 | 0.7 | +6.02 |
| 1942 | 712,729 | 18,112,000 | 12,200 | 18,651 | 0.7 | -3.63 |
| 1943 | 1,589,461 | 33,802,000 | 24,700 | 21,320 | 1.2 | -8.23 |
| 1944 | 562,898 | 13,660,000 | 9,400 | 16,890 | 0.6 | +11.31 |
| 1945 | 1,350,000 | 22,663,000 | 18,400 | 21,002 | 0.9 | -4.39 |
For the past eight years records of quantities of electricity and natural gas used for irrigation are available and the analyses of these data shown in the above table indicate how total pumping declines or increases with variations in acreage and rainfall.
During the summer and fall of 1940 an inventory of the irrigation wells in Scott County was made and estimates of the total pumpage and number of acres irrigated were obtained. In June 1944, an inventory of all irrigation wells installed after 1940 was made. Detailed records of all irrigation wells are given in Table 19 and the locations of the wells are shown on Plate 2. Records on 129 irrigation wells in Scott County were obtained. As given in Table 10, the total reported area irrigated from these wells in 1940 was 17,164, an average of about 202 acres per pumping plant. An attempt to determine the quantity of water pumped annually from irrigation wells in Scott County was made. Reported estimates were obtained from well owners. Pumpage estimates for wells that are pumped by electricity were computed from records supplied by the Inland Utilities Company of the total number of kilowatt-hours of electricity consumed in 1940. Pumpage estimates for wells that are pumped by natural gas were computed from records supplied by the Tri-County Gas Company of Holcomb. Mr. Kenneth D. McCall, Engineer for the Division of Water Resources of the Kansas State Board of Agriculture, assisted in obtaining these data. The estimated total quantity of water pumped for irrigation in Scott County in 1940 was about 20,800 acre-feet (Table 10).
Yields of Irrigated Wells
Irrigation wells in Scott County yield from about 300 to 2,900 gallons a minute. Yields of most of the irrigation wells given in Table 19 were reported by the owners or operators, but the yields of 27 wells or approximately 25 percent of the total plants used in Scott County were measured by K. D. McCall, M. H. Davison, and Melvin Scanlan of the Division of Water Resources of the Kansas State Board of Agriculture and Woodrow Wilson of the Federal Geological Survey. The yields of wells determined by pumping tests are given in Tables 11 and 19.
Table 11—Yield, total lift, drawdown, and specific capacity of 27 irrigation wells in Scott County, Kansas.
| Well No. (Pl. 2, Table 19) |
Date of pumping test (1) |
Discharge (gallons a minute) |
Total lift (ft) |
Drawdown (ft) |
Specific capacity (gallons a minute per ft of drawdown) |
|---|---|---|---|---|---|
| 74 | Summer, 1938 | 1,050 | 88.2 | 27.5 | 38.2 |
| 1,085 | 91.4 | 31.4 | 34.6 | ||
| 76 | Summer, 1939 | 1,115 | 86.2 | 23.3 | 47.8 |
| 1,200 | 84.9 | 22 | 54.5 | ||
| 91 | December 8, 1941 | 666 | 58.9 | 24.9 | 26.8 |
| 92 | July 26, 1940 | 1,210 | 62.5 | 19 | 63.7 |
| 97 | July 18, 1940 | 904 | 45 | 18 | 50 |
| 109 | Summer, 1938 | 1,335 | 69.2 | 14.4 | 92.7 |
| 123 | Summer, 1938 | 1,380 | 103.1 | 26.5 | 52 |
| 125 | Summer, 1939 | 1,055 | 85 | 50 | 21.1 |
| 129 | Summer, 1939 | 1,150 | 64.8 | 18.5 | 62.1 |
| 136 | August 27, 1941 | 499 | 65.4 | 47.4 | 10.5 |
| 137 | May 19, 1940 | 580 | 57.1 | 38 | 15.2 |
| 139 | May 22, 1942 | 729 | 54.8 | 36.2 | 20.1 |
| 148 | July 8, 1940 | 452 | |||
| 149 | September 3, 1941 | 1,108 | 110 (2) | 19 ± | 58 (3) |
| 172 | December 9, 1941 | 567 | 63.8 | 34.8 | 16.3 |
| 177 | July 18, 1940 | 404 | |||
| September 6, 1940 | 340 | ||||
| 178 | July 18, 1940 | 394 | |||
| September 6, 1940 | 308 | ||||
| 185 | Summer, 1938 | 845 | 93.4 | 20.5 | 41.2 |
| 189 | Summer, 1938 | 1,300 | 87.0 | 24.5 | 53 |
| 200 | Summer, 1938 | 1,850 (4) | 84.0 | 21.2 | 87.3 |
| 2,900 (5) | 93.5 | 30.7 | 94.5 | ||
| 201 | Summer, 1938 | 690 | 94.2 | 25 | 27.6 |
| 205 | Summer, 1938 | 1,040 | 88.8 | 13 | 80 |
| July 23, 1940 | 1,025 | 95.8 | 17 | 60.3 | |
| 215 | July 25, 1940 | 1,210 | 92.6 (2) | 18 (3) | 67 (3) |
| 241 | July 12, 1940 | 1,720 | 71.7 | 21 | 82 |
| 243 | Summer, 1939 | 1,320 | 62.8 | 15 (3) | 88 (3) |
| 247 | Summer, 1939 | 1,000 | 111.1 | 48.3 | 20.7 |
| 249 | July 25, 1940 | 1,346 | 80 (2) | 18 (3) | 74.8 (3) |
1. Pumping tests made by the Division of Water Resources of the Kansas State Board of Agriculture. Wells 74, 76, 109, 123, 125, 129, 185, 189, 200, 201, 205, 243, and 247 were tested by K. D. McCall and M. H. Davison; wells 92, 97, 148, 177, 178, 205, 215
2. Not accurate.
3. Estimated.
4. Plant running at normal operating speed.
5. Plant running at maximum speed.
All wells tested were equipped with deep-well turbine pumps operated either by electric motors or by natural gas engines. Measurements of the discharge were made with a Collins flow gage. Drawdowns in pumping wells were measured by an electrical contact device, and a steel tape was used for measuring the water levels when the pumps were not running.
According to K. D. McCall (personal communication), well 200 (Pl. 3A), about 24 miles west of Shallow Water in the NW sec. 28, T. 19 S., R. 33 W., had a measured yield in 1938 of 2,900 gallons a minute with a drawdown of 30.7 feet or a total operating lift of 93.5 feet. On this test the plant was operated at maximum speed. When this plant was tested under normal operating conditions, it had a measured yield of 1,850 gallons a minute with a drawdown of 21.2 feet. This well had the largest capacity of all wells tested.
Plate 3A—View of discharge of well 200. Well is discharging about 1,850 gallons a minute, but when tested yielded 2,900 gallons a minute with a drawdown of 30.7 feet (photo by S.W. Lohman).
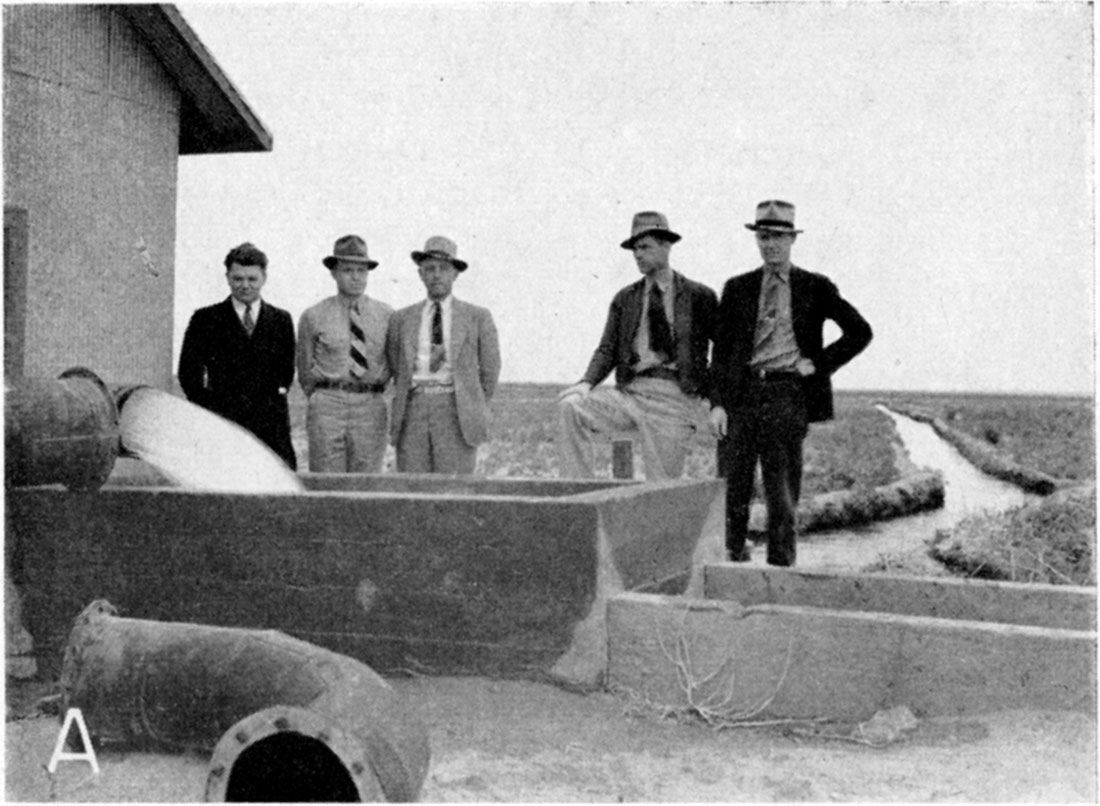
The pumping tests emphasized the fact that the irrigation wells in Scott County differ greatly in yield and over-all efficiency. The yields of the wells range from 308 to 2,900 gallons a minute and the specific capacities range from 10.5 to 94.5. The drawdown in most wells ranges from 13 to 50 feet. There are many factors that determine the yields of wells, including the methods of construction, the character and thickness of the water-bearing formation, the diameter of the casing, the material used for casing, the type of perforations, the quality of the water (whether harmless or corrosive or whether likely to form incrusting material readily), the type and placing of the screen, the development and finishing of the well (whether gravel-packed or not), the age of the well, and the space between pumping wells to prevent, mutual interference. The relative importance of these factors varies for different wells and under different conditions.
Depth and Diameter of Irrigation Wells
The depth and diameter of irrigation wells are given in Tables 12 and 13. Most of the irrigation wells in Scott County are less than 150 feet deep. About 70 of them are between 100 and 150 feet deep and only a few exceed 150 feet in depth.
Table 12—Irrigation wells in Scott County classified according to depth.
| Depth, feet | Number of wells |
|---|---|
| 50-60 | 1 |
| 61-70 | 5 |
| 71-80 | 11 |
| 81-90 | 12 |
| 91-100 | 10 |
| 101-125 | 39 |
| 126-150 | 31 |
| 151-175 | 8 |
| 176-200 | 3 |
| 201-225 | 2 |
| Not known | 9 |
Table 13—Irrigation wells in Scott County classified according to diameter.
| Diameter, inches | Number of wells |
|---|---|
| 12 | 1 |
| 12.5 | 1 |
| 16 | 49 |
| 18 | 47 |
| 19 | 9 |
| 20 | 1 |
| 21 | 3 |
| 24 | 19 |
| 26 | 1 |
The diameter of the irrigation wells ranges from 12 inches to 26 inches and of the 129 irrigation wells visited in the county, 96 are between 16 and 18 inches in diameter.
Types of Pumps on Irrigation Wells
All the irrigation wells in Scott County are equipped with deep-well turbine pumps. The number of stages, or bowls, in each well ranges from two to five. The turbine pumps range in size from 6 to 10 inches, but 6- and 8-inch pumps are the most common sizes.
The turbine pump is best adapted for pumping water from deep irrigation wells. The advantages of this type of pump are several—they are constructed so as to operate in relatively small diameter wells, no priming is necessary because the pump bowls are submerged, and the power unit is at the surface, thereby eliminating the need for a pump pit.
Type of Power Used for Pumping Irrigation Wells
The types of power used to pump irrigation wells in Scott County are given in Table 14. The table shows that 60 wells are equipped with electric motors and 41 wells are equipped with power units powered by natural gas. Seventeen wells are operated by gasoline engines, six wells are equipped with diesel engines, and five wells in the county are operated with farm tractors.
Table 14—Type of power used for pumping irrigation wells in Scott County, Kansas.
| Type of power | Number of wells |
|---|---|
| Electric motor | 60 |
| Natural-gas engine | 41 |
| Gasoline engine | 17 |
| Diesel engine | 6 |
| Tractor | 5 |
| None | 2 |
| Total | 131 |
Possibilities of Further Development of Irrigation Supplies
The amount of water that can be pumped from an underground reservoir without causing excessive permanent lowering of the water table depends on the amount of annual recharge to the reservoir. If water is withdrawn from an underground reservoir by pumping faster than water enters it, the water levels in wells will decline and the supply eventually will be depleted. The amount of water that can be withdrawn annually from the ground-water reservoir over a long period of years without causing depletion of the available supply is termed the safe yield of the reservoir. The feasibility of developing additional water supplies from wells for irrigation in Scott County is dependent upon the safe yield of the underground reservoir, which is governed by geologic and hydrologic factors.
The question of whether further irrigation is possible or practical in a specific area is of extreme importance, not only to the present irrigators but also to those persons who may contemplate investing money in an irrigation well. Overdevelopment in an irrigation area will cause lowering of the water table, thereby increasing the total pumping lift. This is important to those who own irrigation wells for the cost of lifting water to the surface increases in proportion to the total pumping lift. The most important question to the farmer who is contemplating the construction of an irrigation well is whether or not the ground water can be developed and pumped to the surface at a cost low enough to permit a profit from the crops produced. The depth to water level determines in part the original cost of the well and the cost of the operation. The height a given quantity of water must be lifted is a prime factor in determining the cost of operating a well. It is generally not possible to state the limit of economical pumping lift in a given locality, for it depends on such factors as the cost of fuel for operating the pump, efficiency of the pump, kind and price of the crops being irrigated, and the skill and management of the individual.
The amount of water available for irrigation in the Scott Basin depends on the saturated thickness of the water-bearing materials and the specific yield of the material. The amount of water that can be pumped perennially depends also on the periodic ground-water replenishment from precipitation, by percolation from streams, and movement of ground water into the area from the sides.
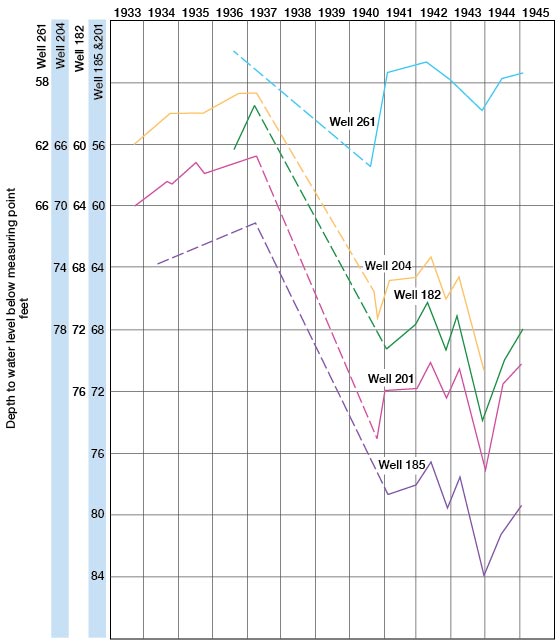
Periodic measurements of the depth to the water levels in many of the irrigation wells are being made. Measurements were started on some of the wells in 1933 and on others at later intervals. The hydrographs of five of these wells are shown in Figure 11. No measurements of the water levels of these five wells were made between the spring of 1937 and the fall of 1940 but the hydrographs show that the water levels declined on an average of about 15 feet during that time. From the fall of 1940 to the present time, the water levels have fluctuated annually in response to pumpage and recharge. In 1945 the water levels in some of these wells were higher than they were in 1940, while the water levels in others were somewhat lower in 1945 than they were in 1940. Much of the rise in 1944 probably was caused by a reduction of pumpage for irrigation. The pumpage for irrigation in 1943 amounted to 24,700 acre-feet (Table 10), but in 1944 it was only 9,400 acre-feet and in 1945 it was 18,400 acre-feet.
Figure 11—Fluctuations of the water levels in five irrigation wells in Scott County.
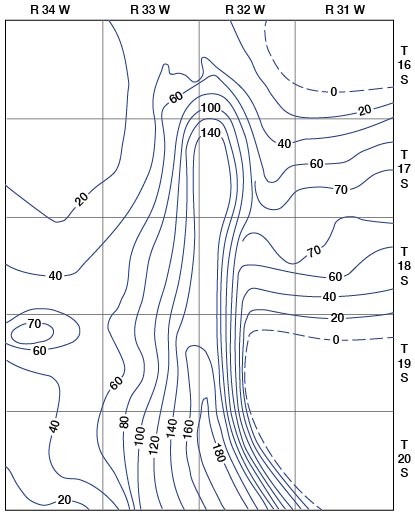
The saturated thickness of the Pliocene and Pleistocene deposits in Scott County is shown in Figure 12 (see also Fig. 5). The contours showing saturated thickness were prepared by superimposing the water-table contour map (Pl. 1) on the map showing the configuration of the pre-Tertiary surface (Fig. 2) and drawing the contours through points of equal thickness. As shown by the contours a narrow tongue of thick deposits extends into the middle of Scott County from the Arkansas Valley in Finney County. The extension of this tongue in Finney County is known as the Finney Basin (Latta, 1944, pp. 21, 119). The water-bearing materials have a saturated thickness of more than 180 feet in the deepest part of the basin. In an area 4 to 8 miles wide and about 25 miles long comprising about 100,000 acres, the saturated thickness is more than 100 feet. Irrigation wells having large yields have been developed in this part of Scott County.
Figure 12—Saturated thickness of the Tertiary and Quaternary deposits in Scott County.
A part of the Scott Basin may be approaching overdevelopment but in other parts of the basin the water table has not yet been affected by pumping. An attempt to determine the status of development was made by preparing periodic maps of the area showing the change in water level in comparison with the water level in 1936. Water-table contour maps for the years 1936 and 1945 are shown in Figures 13 and 14. The change in water level between map periods was determined by superimposing one water-table contour map over the other and connecting the points of equal change of water level. A change in water level map for the period from the summer of 1936 to December 1945, is shown in Figure 15. As shown on Figure 15, the maximum amount of lowering of the water table between the summer of 1936 and December 1945, was in a heavily pumped area and amounted to about 24 feet.
Figure 13—Water-table contours of the Scott Basin as of the summer of 1936.
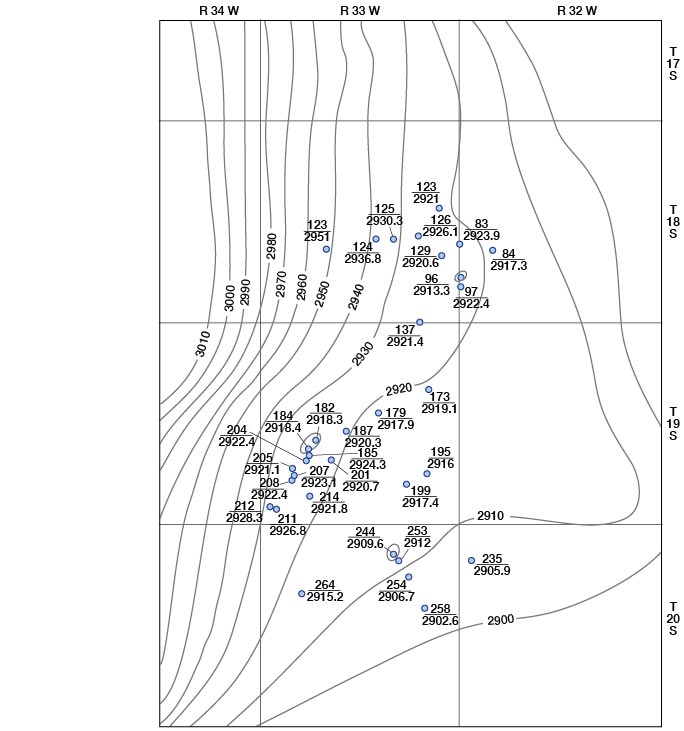
Figure 14—Water-table contours of the Scott Basin as of the summer of 1945.
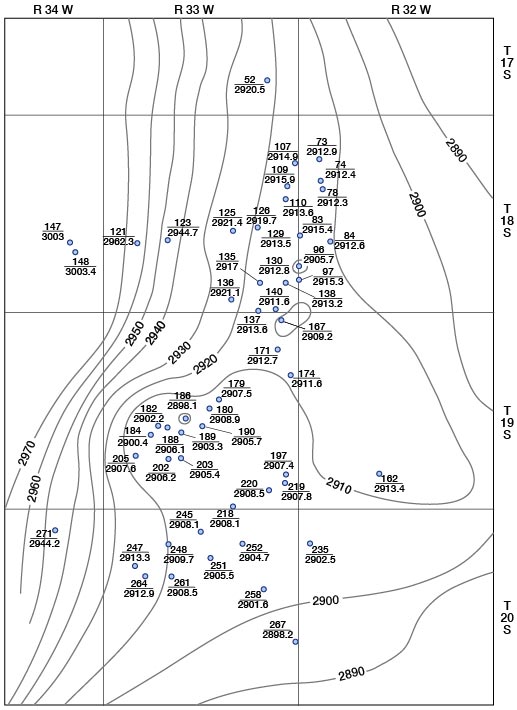
Figure 15—Change in the water table of the Scott Basin from the summer of 1936 to December 1945.
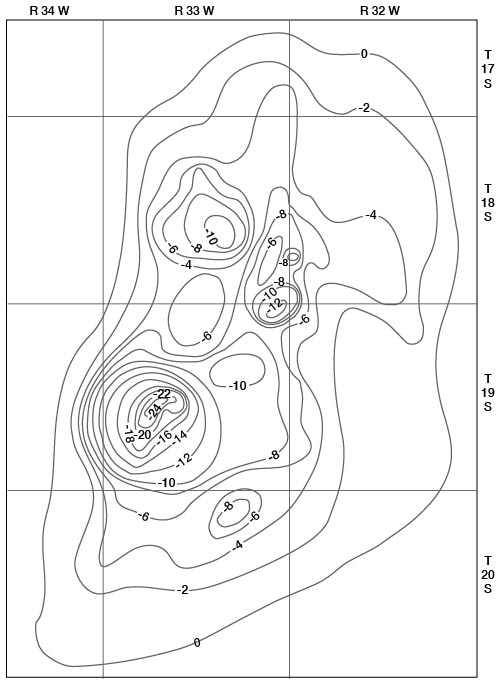
From the summer of 1936 to December 1945, the reduction in volume of the saturated water-bearing materials was about 550,000 acre-feet. The area affected by the reduction at this time is approximately 100,000 acres. Assuming a specific yield of 17 percent, the amount of water pumped from storage would be about 93,500 acre-feet. The pumpage for irrigation from 1936 through 1945 amounted to approximately 145,900 acre-feet. Thus, approximately 93,500 acre-feet came from storage and approximately 52,400 acre-feet came from recharge.
On the basis of this analysis, the average quantity that could be pumped annually without progressive lowering of the water table is about 5,520 acre-feet. Any amounts withdrawn in excess of this are taken from storage. If the present rate of pumping continues, the water table in time will be lowered beyond the economic limit of use. If the rate of pumping is increased, that point will be reached sooner than if use is stabilized at present production.
Under this 100,000-acre area there is at this time a total volume of approximately 11,500,000 acre-feet of saturated deposits overlying the Cretaceous rocks. Assuming a specific yield of 17 percent, this reservoir would contain 1,900,000 acre-feet of water. If the specific yield is less, there is, of course, less water available in storage. Likewise, the amount of water being withdrawn from storage is also less and the amount coming from recharge is more.
A further lowering of the water table and extension of the area of the resulting cone of depression may be expected to produce some slight increase in recharge to the extent that the slope of portions of the water table is changed and the movement of recharge, which formerly was away from the area, will then be toward it. An increase in recharge gained in that manner will be at the expense of higher construction and operation costs for pumping plants, and of smaller yields of water from wells, all due to the lower water table.
The actual specific yield is at this time the most important unknown factor needed to determine more precisely the relationship between recharge, storage, and discharge. Studies and investigations of the area directed toward determining the value of specific yield more accurately should be continued for a few years, after which computations made herein should be reviewed.
Prev Page—Recovery || Next Page—Chemical Character
Kansas Geological Survey, Geology
Comments to webadmin@kgs.ku.edu
Web version March 2003. Original publication date July 1947.
URL=http://www.kgs.ku.edu/General/Geology/Scott/05_gw5.html