![]()
Prev Page--Hydrology || Next Page--Well Records
Chemical Quality of Water
Water in its natural state is never completely pure. The following discussion will deal with the common types of dissolved solids in water and how they can be removed. Part of the discussion is adapted from Standard Methods (1955). The water samples were analyzed by Howard Stoltenberg, chemist, Sanitary Engineering Laboratory, Division of Sanitation, Kansas State Board of Health, in Topeka. The water samples were not tested bacteriologically.
Dissolved Solids
Hardness--Hardness is caused by calcium and magnesium, but dissolved iron, manganese, aluminum, and other metals add to water hardness. Dissolved calcium and magnesium react with soap to form a sticky curd. The soap that combines with calcium and magnesium is thus wasted. Metallic cations unite with anions to form a hard scale in pipes. Hardness is decreased in water-treatment plants by the addition of lime (Ca(OH)2) and soda ash (Na2CO3) or, on a domestic or small commercial scale, by other chemical water softeners. If the hardness is greater than the alkalinity, that amount of hardness equivalent to the alkalinity is called carbonate hardness or temporary hardness; any amount of hardness in excess of this is called noncarbonate hardness or permanent hardness. Temporary hardness can be considerably reduced by boiling.
Iron and manganese--One of the most troublesome of the dissolved solids in water is iron. Dissolved manganese is just as objectionable but not as common. Both cause staining of laundry and plumbing if concentrations of both cations together exceed about 0.3 ppm. Under reducing conditions, iron exists in natural water in the ferrous state, which is relatively soluble. Ferrous iron is oxidized to ferric iron upon exposure to the air. Ferric oxide is the rust that precipitates upon settling. Ferric oxide may also be precipitated by Crenothrix bacteria. Iron and manganese may be removed by aeration, chemical precipitation, superchlorination, and use of special ion-exchange materials.
Silica--Most natural water contains some soluble or colloidal silica, which is not physiologically harmful. Colloidal silica may be removed by coagulation and filtration, but soluble silica is not easily removed.
Alkalinity--Carbonate, bicarbonate, and hydroxide impart alkalinity to natural water. Carbonate is rarely found in ground water. Alkalinity is decreased by precipitating the bicarbonate with lime or by increasing the acidity.
Sulfate--Sulfate is a common constituent of natural water. Solution of the gypsum (CaSO4·2H2O), anhydrite (CaSO4), and small quantities of barite (BaSO4) in the rocks is an abundant source of sulfate in water. Dissolved sulfate in quantities much greater than 250 ppm is likely to have a cathartic effect on the human body. Sulfate is not ordinarily removed from water supplies in treatment.
Chloride--Chloride, derived from solution of mineral matter, is one of the most common anions in water. Water having a chloride concentration in excess of 250 ppm is not recommended for human consumption, but many waters containing more can and are being used. Ordinarily, chloride is not removed from water supplies in treatment.
Nitrate--Nitrogen in water may be derived from many sources. Usually, nitrogen is reported as an equivalent of nitrate, which is the most stable phase of biological oxidation in the nitrogen cycle. Nitrite is an intermediate stage of oxidation or reduction in the nitrogen cycle. Surface waters generally contain negligible quantities of nitrate but ground water may contain enough to constitute a health hazard. Small amounts of nitrite in surface water usually indicate pollution. Nitrite is seldom found in ground water. Organic nitrogen, supplied to water by proteins, amino acids, and polypeptides, which are all products of biological processes, usually indicates some degree of pollution. Ammonia nitrogen is a product of microbiological activity and may be regarded as chemical evidence of pollution in raw surface water. In ground water, ammonia nitrogen is probably a result of a simple reduction process. Generally speaking, any form of nitrogen in water would imply that some biological process has introduced it, although some nitrate could be dissolved from inorganic minerals. Water containing more than 90 ppm of nitrate (as NO3) may cause infant cyanosis (methemoglobinemia) or "blue babies" if it is used in the preparation of formula (Metzler and Stoltenberg, 1950). Nitrate cannot be removed by boiling.
Fluoride--Most natural water contains a small amount of dissolved fluoride. If the fluoride concentration is greater than 1.5 ppm, it may cause "mottled enamel" in children's teeth. Water containing much less than 1.0 ppm does not give optimum protection from dental cavities. Fluoride is added to many water supplies in order to increase the concentration to about 1.0 ppm.
Specific Conductance
Specific conductance is a measure of the capacity of a fluid to conduct an electric current. Conductance, the reciprocal of resistance, is often expressed in micromhos per centimeter. As the specific conductance is closely related to the sum of dissolved anions and cations, it is a convenient method for quickly determining the approximate amount of dissolved solids. Conductance in micromhos is multiplied by a factor ranging from about 0.55 to 0.75 to give parts per million of dissolved solids. The proper factor is determined by chemically analyzing water similar to that to be tested and comparing the dissolved-solids content with the specific conductance. The average factor for Ottawa County is 0.6.
Specific conductance can be used as an aid in determining recharge from a body of surface water to a pumped well if there is a marked difference in conductances between surface and ground waters.
Dissolved Solids in Ground Water
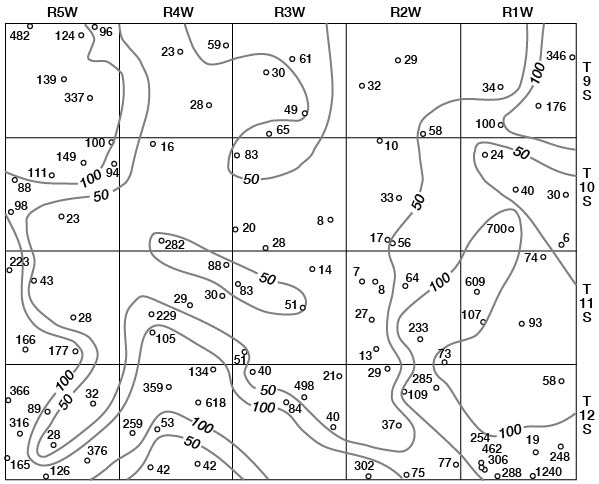
Concentrations of dissolved solids in ground water in Ottawa County fall in a general areal pattern, except for local anomalies. Concentrations of calcium (Fig. 29), magnesium (Fig. 30), bicarbonate (Fig. 31), and sulfate (Fig. 32) show that water in the middle part of the Dakota Formation and in the terraces is generally good. The major exception is water of poor quality in the silty terrace deposit at the confluence of Salt Creek and Solomon River. Wells that penetrate a terrace deposit or the Dakota Formation but also reach or approach the Wellington Formation are likely to yield water of poor quality. Water from wells in the upper part of the Dakota is generally not as good as that in the middle part of the Dakota.
Figure 29--Map of Ottawa County showing location of wells and test holes, and calcium concentration in parts per million in water samples. No adjustment is made for local anomalies.
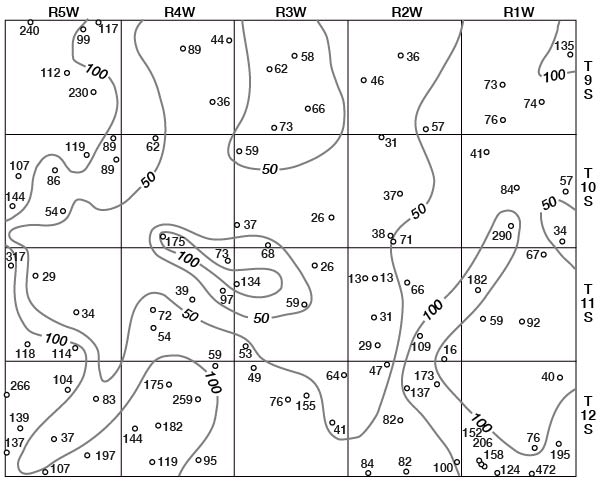
Figure 30--Map of Ottawa County showing location of wells and test holes, and magnesium concentration in parts per million in water samples. No adjustment is made for local anomalies.
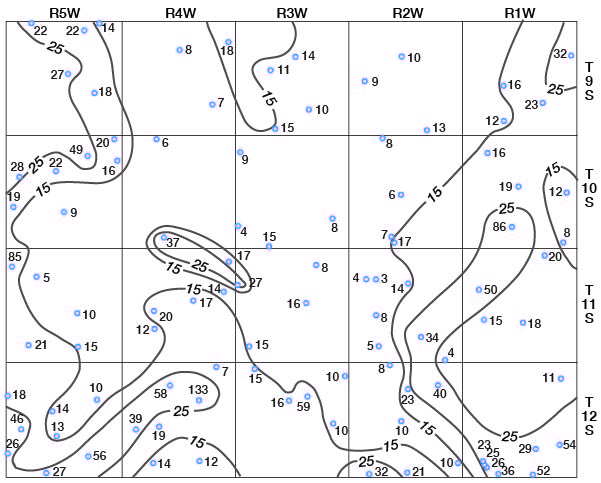
Figure 31--Map of Ottawa County showing location of wells and test holes, and bicarbonate concentration in parts per million in water samples. No adjustment is made for local anomalies.
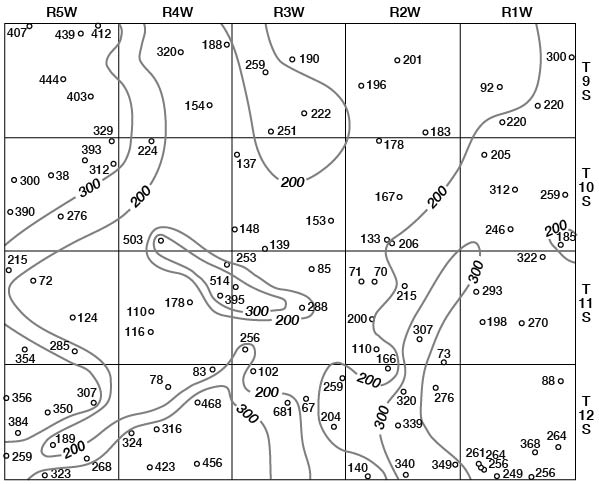
Figure 32--Map of Ottawa County showing location of wells and test holes, and sulfate concentration in parts per million in water samples. No adjustment is made for local anomalies.
The chloride concentration shows a distribution pattern similar to those plotted. Nitrate and fluoride concentrations do not seem to fit any logical pattern. Dissolved iron is very irregular in distribution and believed subject to local control; almost all water from wells contains appreciable amounts of dissolved iron. The distribution of dissolved silica is almost uniform throughout the county. Chemical analyses of water from wells in Ottawa County are given in Table 11.
Table 11--Analyses of water from typical wells in Ottawa County. Analyzed by Howard A. Stoltenberg. Dissolved constituents given in parts per million. One part per million is equivalent to one pound of substance per million pounds of water or 8.33 pounds per million gallons of water. Concentration in equivalents per million is calculated by dividing the concentration in parts per million by the chemical combining weight of the substance or ion.
| Well | Depth (feet) |
Geologic source |
Date of collection |
Temp. (°F) |
Dissolved solids |
Silica (SiO2) |
Iron (Fe) |
Calcium (Ca) |
Magnesium (Mg) |
Sodium and Potassium (Na+K) |
Bicarbonate (HCO3) |
Sulfate (SO4) |
Chloride (Cl) |
Fluoride (F) |
Nitrate (NO3) |
Hardness as CaCO3 | ||
|---|---|---|---|---|---|---|---|---|---|---|---|---|---|---|---|---|---|---|
| Total | Carbonate | Non- carbonate |
||||||||||||||||
| 9-1-12ddb | 107.5 | Dakota Formation |
11-13-1957 | 56 | 756 | 7.5 | 1.6 | 135 | 32 | 73 | 300 | 346 | 12 | 0.8 | 1.7 | 468 | 246 | 222 |
| 9-1-21bcc | 56.0 | Dakota Formation |
11-13-1957 | 57 | 455 | 8.5 | 14 | 73 | 16 | 48 | 92 | 34 | 93 | 0.2 | 137 | 248 | 76 | 172 |
| 9-1-26bcb | 91.5 | Dakota Formation |
11-13-1957 | 56 | 472 | 9.0 | 7.0 | 74 | 23 | 56 | 220 | 176 | 24 | 0.5 | 1.8 | 279 | 180 | 99 |
| 9-1-33bcb | 29.3 | Dakota Formation |
11-13-1957 | 56 | 571 | 12 | 0.93 | 76 | 12 | 112 | 220 | 100 | 126 | 0.6 | 24 | 239 | 180 | 59 |
| 9-2-9dcd | 99.6 | Dakota Formation |
12-11-1957 | 56 | 243 | 25 | 8.7 | 36 | 10 | 35 | 201 | 29 | 8.0 | 0.2 | 1.0 | 131 | 131 | 0.0 |
| 9-2-19aad | 64.3 | Dakota Formation |
6-5-1958 | 58 | 238 | 21 | 17 | 46 | 9.0 | 25 | 196 | 32 | 7.0 | 0.6 | 0.7 | 152 | 152 | 0.0 |
| 9-2-35cbc | 87.0 | Dakota Formation |
12-10-1957 | 56.5 | 316 | 12 | 0.69 | 57 | 13 | 35 | 183 | 58 | 34 | 0.2 | 17 | 196 | 150 | 46 |
| 9-3-10ccd | 87.1 | Dakota Formation |
12-11-1957 | 58 | 290 | 14 | 12 | 58 | 14 | 22 | 190 | 61 | 15 | 0.4 | 12 | 202 | 156 | 46 |
| 9-3-17daa | 166.6 | Dakota Formation |
12-11-1957 | 56 | 285 | 13 | 9.3 | 62 | 11 | 28 | 259 | 30 | 12 | 0.2 | 0.8 | 200 | 200 | 0.0 |
| 9-3-27dad | 65.6 | Dakota Formation |
12-11-1957 | 57 | 319 | 25 | 12 | 66 | 9.6 | 32 | 222 | 49 | 27 | 0.1 | 1.0 | 204 | 182 | 22 |
| 9-3-33cbb | 126.7 | Dakota Formation |
6-5-1958 | 58 | 334 | 18 | 3.1 | 73 | 15 | 23 | 251 | 65 | 10 | 0.4 | 5.8 | 244 | 206 | 38 |
| 9-4-10bcd | 56.0 | Illinoisan terrace |
5-31-1958 | 59 | 379 | 36 | 0.02 | 89 | 8.3 | 32 | 320 | 23 | 19 | 0.1 | 15 | 256 | 256 | 0.0 |
| 9-4-12aba | 42.0 | Dakota Formation |
12-10-1957 | 57 | 270 | 16 | 47 | 44 | 18 | 24 | 188 | 59 | 14 | 0.3 | 1.5 | 184 | 154 | 30 |
| 9-4-26aad | 55.4 | Dakota Formation |
6-5-1958 | 57 | 251 | 21 | 0.5 | 36 | 7.3 | 38 | 154 | 28 | 20 | 0.4 | 24 | 120 | 120 | 0.0 |
| 9-5-2aaa | 13.4 | Wisconsinan terrace |
5-22-1958 | 57 | 566 | 25 | 3.0 | 117 | 14 | 68 | 412 | 96 | 42 | 0.2 | 1.0 | 350 | 338 | 12 |
| 9-5-2bcc | 77.0 | Dakota Formation |
12-17-1957 | 56 | 590 | 12 | 11 | 99 | 22 | 88 | 439 | 124 | 27 | 0.4 | 1.5 | 338 | 338 | 0.0 |
| 9-5-5baa | 77.0 | Dakota Formation |
5-21-1958 | 55 | 1,130 | 16 | 4.7 | 240 | 22 | 105 | 407 | 482 | 50 | 0.7 | 13 | 690 | 334 | 356 |
| 9-5-15cdc | 99.4 | Dakota Formation |
12-18-1957 | 57 | 591 | 13 | 4.5 | 112 | 27 | 64 | 444 | 139 | 9.0 | 0.4 | 8.4 | 390 | 364 | 26 |
| 9-5-23ddc | 11.4 | Alluvium | 5-21-1958 | 52 | 884 | 16 | 0.38 | 230 | 18 | 40 | 403 | 337 | 26 | 0.4 | 19 | 648 | 330 | 318 |
| 10-1-5ccd | 78.3 | Dakota Formation |
11-13-1957 | 56 | 295 | 9.0 | 32 | 41 | 16 | 45 | 205 | 24 | 41 | 0.8 | 17 | 168 | 168 | 0.0 |
| 10-1-16ddd | 98.0 | Dakota Formation |
11-13-1957 | 56 | 400 | 18 | 0.04 | 84 | 19 | 35 | 312 | 40 | 43 | 0.3 | 6.6 | 288 | 256 | 32 |
| 10-1-24baa | 66.4 | Dakota Formation |
11-13-1957 | 57 | 305 | 19 | 0.57 | 57 | 12 | 36 | 259 | 30 | 12 | 0.3 | 11 | 192 | 192 | 0.0 |
| 10-1-28dcc | 42.2 | Dakota Formation |
11-13-1957 | 57 | 2,430 | 16 | 0.18 | 290 | 86 | 347 | 246 | 700 | 328 | 0.3 | 544 | 1,077 | 202 | 875 |
| 10-1-36cbb | 42.4 | Dakota Formation |
11-14-1957 | 57 | 207 | 13 | 4.0 | 34 | 8.5 | 30 | 185 | 5.8 | 12 | 0.7 | 12 | 120 | 120 | 0.0 |
| 10-2-5aba | 100.5 | Dakota Formation |
12-10-1957 | 56 | 213 | 23 | 1.9 | 31 | 7.9 | 34 | 178 | 9.5 | 17 | 0.2 | 2.9 | 110 | 110 | 0.0 |
| 10-2-21aab | 82.3 | Dakota Formation |
12-10-1957 | 56 | 245 | 14 | 1.2 | 37 | 5.7 | 43 | 167 | 33 | 22 | 0.4 | 8.0 | 116 | 116 | 0.0 |
| 10-2-33bca | 19.6 | Dakota Formation |
11-26-1957 | 59 | 177 | 12 | 11 | 38 | 7.1 | 13 | 133 | 17 | 10 | 0.4 | 14 | 124 | 109 | 15 |
| 10-2-33cab | 19.7 | Dakota Formation |
11-26-1957 | 58 | 392 | 12 | 0.12 | 71 | 17 | 39 | 206 | 56 | 46 | 0.1 | 49 | 247 | 169 | 78 |
| 10-3-6ccc | 69.0 | Dakota Formation |
6-5-1958 | 54.5 | 396 | 25 | 8.6 | 59 | 9.0 | 60 | 137 | 83 | 67 | 0.4 | 25 | 184 | 112 | 72 |
| 10-3-25bca | 58.8 | Dakota Formation |
12-11-1957 | 56 | 161 | 7.5 | 19 | 26 | 8.5 | 23 | 153 | 8.2 | 11 | 0.2 | 0.9 | 100 | 100 | 0.0 |
| 10-3-30cbc | 27.2 | Wisconsinan terrace |
6-5-1958 | 56.5 | 200 | 17 | 0.67 | 37 | 4.3 | 28 | 148 | 20 | 17 | 0.4 | 3.1 | 110 | 110 | 0.0 |
| 10-3-32ddc | 28.4 | Wisconsinan terrace |
6-5-1958 | 57 | 394 | 32 | 0.20 | 68 | 15 | 34 | 139 | 28 | 68 | 0.2 | 80 | 231 | 114 | 117 |
| 10-4-5aad | 35.4 | Dakota Formation |
12-11-1957 | 59 | 264 | 25 | 0.26 | 62 | 6.2 | 22 | 224 | 16 | 13 | 0.1 | 10 | 180 | 180 | 0.0 |
| 10-4-33bdd | 16.8 | Illinoisan terrace |
12-13-1957 | 57 | 2,560 | 25 | 3.1 | 175 | 37 | 739 | 503 | 282 | 1,055 | 0.2 | 1.8 | 588 | 412 | 176 |
| 10-5-1aab | 73.0 | Dakota Formation |
5-22-1958 | 57 | 507 | 11 | 8.1 | 89 | 20 | 64 | 329 | 100 | 33 | 0.6 | 27 | 304 | 270 | 34 |
| 10-5-9dcd | 162.0 | Dakota Formation |
5-27-1958 | 58 | 544 | 10 | 20 | 86 | 22 | 84 | 381 | 111 | 40 | 0.5 | 2.6 | 305 | 305 | 0.0 |
| 10-5-11bab | 57.4 | Dakota Formation |
12-17-1957 | 57 | 813 | 13 | 0.40 | 119 | 49 | 99 | 393 | 149 | 137 | 0.4 | 53 | 498 | 322 | 176 |
| 10-5-12aad | 92.0 | Dakota Formation |
5-22-1958 | 57 | 438 | 13 | 1.4 | 89 | 16 | 46 | 312 | 94 | 20 | 0.4 | 6.2 | 288 | 256 | 32 |
| 10-5-18aba | 96.0 | Dakota Formation |
12-18-1957 | 56 | 506 | 22 | 59 | 107 | 28 | 35 | 400 | 88 | 26 | 0.4 | 2.2 | 382 | 328 | 54 |
| 10-5-19cda | 34.6 | Dakota Formation |
12-18-1957 | 57 | 667 | 25 | 0.23 | 144 | 19 | 59 | 390 | 98 | 64 | 0.2 | 66 | 437 | 320 | 117 |
| 10-5-27bbb | 49.2 | Dakota Formation |
5-27-1958 | 56 | 327 | 17 | 1.5 | 54 | 9.1 | 55 | 276 | 23 | 23 | 0.3 | 9.7 | 172 | 172 | 0.0 |
| 11-1-2bad | 7.8 | Wisconsinan terrace |
11-13-1957 | 57 | 415 | 15 | 0.06 | 67 | 20 | 67 | 322 | 74 | 20 | 0.6 | 2.4 | 249 | 249 | 0.0 |
| 11-1-18aaa | 40.2 | Dakota Formation |
11-14-1957 | 56 | 1,140 | 25 | 9.2 | 182 | 50 | 111 | 293 | 609 | 18 | 0.6 | 1.4 | 660 | 240 | 420 |
| 11-1-20ccc | 24.7 | Wisconsinan terrace and Dakota Formation |
11-14-1957 | 57 | 388 | 28 | 0.11 | 59 | 15 | 45 | 198 | 107 | 6.0 | 0.4 | 30 | 208 | 162 | 46 |
| 11-1-22ccc | 20.2 | Wisconsinan terrace and Dakota Formation |
11-14-1957 | 57 | 720 | 40 | 0.78 | 92 | 18 | 113 | 270 | 93 | 72 | 0.4 | 159 | 304 | 222 | 82 |
| 11-2-7add | 75.7 | Dakota Formation |
11-26-1957 | 57 | 98 | 13 | 0.78 | 13 | 3.8 | 14 | 71 | 6.6 | 5.0 | 0.1 | 7.1 | 48 | 48 | 0.0 |
| 11-2-8dbb | 48.2 | Dakota Formation |
11-26-1957 | 58.5 | 90 | 9 | 10 | 13 | 3.3 | 14 | 70 | 7.8 | 5.0 | 0.2 | 3.1 | 46 | 46 | 0.0 |
| 11-2-10cbc | 94.3 | Dakota Formation |
11-26-1957 | 58 | 467 | 14 | 1.0 | 66 | 14 | 75 | 215 | 64 | 62 | 0.3 | 66 | 222 | 176 | 46 |
| 11-2-20bdc | 15.7 | Dakota Formation |
11-26-1957 | 60 | 251 | 19 | 0.38 | 31 | 8.4 | 48 | 200 | 27 | 10 | 0.3 | 2.6 | 112 | 112 | 0.0 |
| 11-2-27ada | 55.8 | Dakota Formation |
11-26-1957 | 58 | 713 | 7.5 | 8.4 | 109 | 34 | 88 | 307 | 283 | 39 | 0.6 | 1.0 | 412 | 252 | 160 |
| 11-2-32abb | 70.7 | Dakota Formation |
11-26-1957 | 58 | 179 | 17 | 8.5 | 29 | 4.8 | 23 | 110 | 13 | 14 | 0.2 | 24 | 92 | 90 | 2 |
| 11-2-36ccc | 19.2 | Dakota Formation |
11-26-1957 | 59 | 123 | 16 | 0.22 | 16 | 3.9 | 17 | 73 | 9.5 | 5.5 | 0.2 | 19 | 56 | 56 | 0.0 |
| 11-3-2cdc | 58.1 | Dakota Formation |
11-27-1957 | 57.5 | 190 | 5.5 | 50 | 26 | 7.6 | 28 | 85 | 14 | 32 | 0.4 | 34 | 96 | 70 | 26 |
| 11-3-7ccc | 46.8 | Wisconsinan terrace |
12-10-1957 | 56 | 754 | 25 | 4.7 | 134 | 27 | 108 | 514 | 83 | 122 | 0.1 | 1.8 | 446 | 422 | 24 |
| 11-3-15ddc | 47.2 | Dakota Formation |
11-27-1957 | 57 | 381 | 12 | 1.2 | 59 | 16 | 58 | 288 | 51 | 22 | 0.3 | 21 | 213 | 213 | 0.0 |
| 11-3-31aba | 41.0 | Dakota Formation |
6-3-1958 | 56 | 374 | 16 | 0.54 | 53 | 15 | 61 | 256 | 51 | 34 | 0.3 | 18 | 194 | 194 | 0.0 |
| 11-4-1dbd2 | 152.4 | Dakota Formation |
10-8-1958 | 478 | 21 | 1.4 | 73 | 17 | 73 | 253 | 88 | 76 | 0.3 | 5.3 | 252 | 207 | 45 | |
| 11-4-13bad | 43.7 | Wisconsinan terrace |
6-13-1958 | 57 | 408 | 25 | 4.3 | 97 | 14 | 34 | 395 | 30 | 12 | 0.3 | 1.2 | 300 | 300 | 0.0 |
| 11-4-15daa | 47.0 | Dakota Formation |
6-3-1958 | 57 | 263 | 27 | 0.64 | 39 | 17 | 22 | 178 | 29 | 11 | 0.1 | 30 | 168 | 146 | 22 |
| 11-4-20aad | 75.0 | Dakota Formation |
6-3-1958 | 56 | 469 | 16 | 18 | 72 | 20 | 49 | 110 | 229 | 26 | 0.3 | 2.8 | 262 | 90 | 172 |
| 11-4-29aaa | 91.0 | Dakota Formation |
6-3-1958 | 58 | 285 | 12 | 3.5 | 54 | 12 | 23 | 116 | 105 | 20 | 0.3 | 1.5 | 184 | 95 | 89 |
| 11-5-6ccd | 49.7 | Dakota Formation |
12-18-1957 | 59 | 1,860 | 13 | 1.4 | 317 | 85 | 101 | 215 | 223 | 231 | 0.0 | 779 | 1,140 | 176 | 964 |
| 11-5-8adc | 100.0 | Dakota Formation |
6-4-1958 | 58 | 156 | 18 | 1.1 | 29 | 4.8 | 13 | 72 | 43 | 10 | 0.3 | 2.2 | 92 | 59 | 33 |
| 11-5-22ada | 95.6 | Dakota Formation |
6-4-1958 | 58 | 195 | 25 | 3.0 | 34 | 9.5 | 15 | 124 | 28 | 13 | 0.2 | 8.9 | 124 | 102 | 22 |
| 11-5-32baa | 19.6 | Dakota Formation |
6-4-1958 | 55 | 704 | 15 | 0.12 | 118 | 21 | 97 | 354 | 166 | 63 | 0.6 | 49 | 381 | 290 | 91 |
| 11-5-34aad | 172.2 | Dakota Formation |
12-19-1957 | 57 | 641 | 17 | 3.5 | 114 | 15 | 88 | 285 | 177 | 78 | 0.3 | 12 | 346 | 234 | 112 |
| 12-1-1ccd | 11.2 | Wisconsinan terrace |
11-14-1957 | 57 | 235 | 9.5 | 1.8 | 40 | 11 | 22 | 88 | 58 | 32 | 0.2 | 19 | 145 | 72 | 73 |
| 12-1-25bcb | 52.0 | Undifferentiated Pleistocene |
11-14-1957 | 57 | 934 | 34 | 0.06 | 195 | 54 | 32 | 264 | 258 | 179 | 0.2 | 62 | 708 | 216 | 492 |
| 12-1-27add | 48.8 | Undifferentiated Pleistocene |
11-15-1957 | 57 | 386 | 27 | 0.04 | 76 | 29 | 23 | 368 | 19 | 19 | 0.2 | 12 | 308 | 302 | 6.0 |
| 12-1-32bbc1 | 39.7 | Wisconsinan terrace |
11-15-1957 | 57 | 920 | 21 | 0.18 | 206 | 35 | 34 | 264 | 462 | 15 | 0.2 | 17 | 658 | 216 | 442 |
| 12-1-32bbc2 | 56.0 | Wisconsinan terrace |
11-25-1957 | 57 | 709 | 21 | 0.38 | 158 | 26 | 32 | 256 | 306 | 16 | 0.2 | 24 | 501 | 210 | 291 |
| 12-1-32bbd | 40.1 | Wisconsinan terrace |
11-15-1957 | 56 | 690 | 22 | 0.09 | 152 | 23 | 36 | 261 | 254 | 22 | 0.1 | 53 | 474 | 214 | 260 |
| 12-1-32ddd | 73.8 | Undifferentiated Pleistocene |
11-15-1957 | 56 | 636 | 16 | 5.1 | 124 | 36 | 32 | 249 | 288 | 16 | 0.2 | 1.2 | 458 | 204 | 254 |
| 12-1-34dcd | 43.5 | Undifferentiated Pleistocene |
11-14-1957 | 57 | 2,000 | 19 | 2.7 | 472 | 52 | 67 | 256 | 1,240 | 25 | 0.6 | 1.1 | 1,391 | 210 | 1,181 |
| 12-2-4bba | 13.7 | Dakota Formation |
11-25-1957 | 59 | 276 | 22 | 0.11 | 47 | 7.6 | 34 | 166 | 29 | 17 | 0.6 | 37 | 148 | 136 | 12 |
| 12-2-10bcc | 38.0 | Dakota Formation |
11-25-1957 | 57 | 826 | 24 | 0.38 | 137 | 23 | 98 | 320 | 109 | 82 | 0.1 | 195 | 436 | 262 | 174 |
| 12-2-11abb | 16.6 | Dakota Formation |
11-26-1957 | 55 | 1,300 | 19 | 0.50 | 173 | 40 | 185 | 276 | 285 | 164 | 0.8 | 301 | 596 | 226 | 370 |
| 12-2-21aba | 26.7 | Wisconsinan terrace |
11-25-1957 | 57 | 370 | 28 | 2.2 | 82 | 9.6 | 38 | 339 | 37 | 7.0 | 0.2 | 0.9 | 244 | 244 | 0.0 |
| 12-2-32ccc | 75.7 | Dakota Formation |
11-25-1957 | 58 | 620 | 23 | 7.5 | 84 | 32 | 65 | 140 | 302 | 26 | 0.4 | 19 | 341 | 115 | 226 |
| 12-2-34ccb | 44.4 | Illinoisan terrace |
11-25-1957 | 58 | 546 | 25 | 1.4 | 82 | 21 | 85 | 350 | 75 | 75 | 0.2 | 16 | 291 | 279 | 12 |
| 12-2-36aac | 45.8 | Wisconsinan terrace |
11-25-1957 | 57 | 433 | 21 | 4.8 | 100 | 10 | 42 | 349 | 77 | 10 | 0.1 | 0.7 | 290 | 286 | 4.0 |
| 12-3-1dba | 47.0 | Dakota Formation |
5-17-1958 | 292 | 22 | 0.06 | 64 | 10 | 27 | 259 | 21 | 13 | 0.2 | 7.1 | 200 | 200 | 0.0 | |
| 12-3-5bca | 53.2 | Dakota Formation |
5-20-1958 | 58 | 315 | 25 | 0.17 | 49 | 15 | 26 | 102 | 40 | 44 | 0.1 | 66 | 184 | 84 | 100 |
| 12-3-9ddd | 61.8 | Dakota Formation |
5-24-1958 | 57 | 783 | 17 | 23 | 76 | 16 | 209 | 681 | 84 | 42 | 0.5 | 3.1 | 256 | 256 | 0.0 |
| 12-3-10dad | 69.3 | Dakota Formation |
11-27-1957 | 57 | 1,540 | 6.5 | 65 | 155 | 59 | 294 | 67 | 498 | 491 | 0.5 | 1.5 | 629 | 65 | 574 |
| 12-3-24bad | 30.0 | Dakota Formation |
5-26-1958 | 58 | 268 | 13 | 5.4 | 41 | 9.6 | 43 | 204 | 40 | 16 | 0.3 | 5.3 | 142 | 142 | 0.0 |
| 12-4-1bbc | 100.0 | Dakota Formation |
6-3-1958 | 58 | 330 | 17 | 38 | 59 | 6.6 | 36 | 83 | 134 | 24 | 0.2 | 12 | 174 | 68 | 106 |
| 12-4-9abd | 92.8 | Dakota Formation |
5-26-1958 | 58 | 1,330 | 13 | 8.4 | 175 | 58 | 152 | 78 | 359 | 225 | 0.2 | 310 | 675 | 64 | 611 |
| 12-4-11cdd | 105.5 | Dakota Formation |
12-19-1957 | 57 | 1,840 | 13 | 4.9 | 259 | 133 | 159 | 468 | 618 | 271 | 0.4 | 159 | 1,192 | 384 | 808 |
| 12-4-19daa | 24.5 | Dakota Formation |
12-19-1957 | 58 | 772 | 19 | 0.69 | 144 | 39 | 58 | 324 | 259 | 56 | 0.1 | 37 | 520 | 266 | 254 |
| 12-4-21bbc | 38.0 | Dakota Formation |
6-3-1958 | 57.5 | 825 | 16 | 0.06 | 182 | 19 | 52 | 316 | 53 | 86 | 0.4 | 261 | 532 | 259 | 273 |
| 12-4-32ada | 22.2 | Wisconsinan terrace |
6-3-1958 | 57 | 448 | 29 | 3.8 | 119 | 14 | 24 | 423 | 42 | 11 | 0.1 | 1.2 | 354 | 347 | 7.0 |
| 12-4-35bab | 34.0 | Illinoisan terrace |
6-3-1958 | 57 | 513 | 32 | 1.1 | 95 | 12 | 79 | 456 | 42 | 27 | 1.0 | 1.3 | 286 | 286 | 0.0 |
| 12-5-7cbc | 34.6 | Wisconsinan terrace |
6-4-1958 | 56 | 1,120 | 23 | 3.9 | 266 | 18 | 83 | 356 | 366 | 151 | 0.4 | 40 | 738 | 292 | 446 |
| 12-5-11dcd | 59.0 | Dakota Formation |
6-4-1958 | 58 | 398 | 22 | 9.3 | 83 | 10 | 45 | 307 | 32 | 26 | 0.2 | 29 | 248 | 248 | 0.0 |
| 12-5-16bdd | 49.5 | Illinoisan terrace |
4-15-1958 | 495 | 26 | 0.03 | 104 | 14 | 49 | 350 | 89 | 18 | 0.1 | 23 | 317 | 287 | 30 | |
| 12-5-19ada | 41.5 | Dakota Formation |
5-20-1958 | 58 | 972 | 13 | 0.45 | 139 | 46 | 133 | 384 | 316 | 118 | 0.6 | 17 | 536 | 315 | 221 |
| 12-5-26dcd | 23.0 | Wisconsinan terrace |
5-20-1958 | 57 | 1,360 | 20 | 9.4 | 197 | 56 | 165 | 268 | 376 | 223 | 0.4 | 190 | 722 | 220 | 502 |
| 12-5-28aba | 42.0 | Dakota Formation |
5-20-1958 | 58 | 235 | 22 | 0.17 | 37 | 13 | 27 | 189 | 28 | 14 | 0.4 | 0.4 | 146 | 146 | 0.0 |
| 12-5-30cbc | 85.0 | Dakota Formation |
5-2-1958 | 57 | 746 | 25 | 3.7 | 137 | 26 | 74 | 259 | 165 | 116 | 0.7 | 75 | 449 | 212 | 237 |
| 12-5-33cca | 64.0 | Dakota Formation |
5-2-1958 | 57.5 | 522 | 16 | 0.18 | 107 | 27 | 38 | 323 | 126 | 40 | 0.3 | 8.8 | 378 | 265 | 113 |
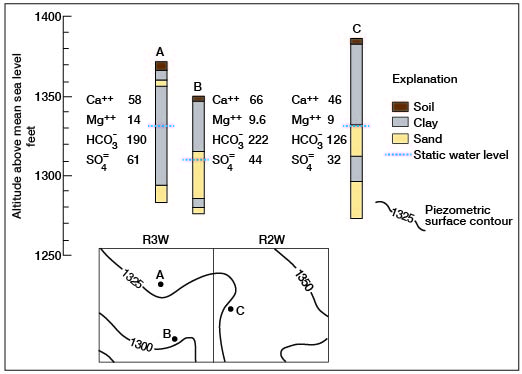
Generally, the fact that a well may be in either an artesian or nonartesian aquifer of the Dakota has no bearing on the quality of water. Figure 33 shows three typical wells in northern Ottawa County. Well A is an artesian well, B is nonartesian, and C may be either artesian or nonartesian. The wells are a few miles apart, yet there is close agreement in the quantities of dissolved solids. This situation seems prevalent throughout the county.
Figure 33--Graphic logs and locations of artesian and nonartesian wells showing minor variations in ionic concentrations in water.
Dissolved Solids in Surface Water
The quantity of dissolved solids in surface water is given in Tables 12 and 13 for Solomon and Saline Rivers, respectively. The sampling station on Solomon River is at Beloit, in Mitchell County, about 20 miles northwest of Ottawa County. The records at this station, the only data available, are presented to give some indication of the quality of water farther downstream. The sampling station on Saline River is at the gaging station half a mile south of Tescott. These data were compiled and published by the Division of Sanitation, Kansas State Board of Health (1958).
Table 12--Analyses of water from Solomon River at waterworks intake at Beloit. Analyzed by Division of Sanitation, Kansas State Board of Health (from Chemical Quality of Surface Waters in Kansas, 1957). Dissolved constituents given in parts per million. One part per million is equivalent to 1 pound of substance per million pounds of water or 8.33 pounds per million gallons of water.
| Date | Discharge (cfs) |
Turbidity | Dissolved solids (TS) |
Silica (SiO2) |
Iron (Fe) |
Calcium (Ca) |
Magnesium (Mg) |
Sodium and Potassium (Na+K) |
Bicarbonate (HCO3) |
Sulfate (SO4) |
Chloride (Cl) |
Nitrate (NO3) |
Fluoride (F) |
Hardness as CaCO3 | ||
|---|---|---|---|---|---|---|---|---|---|---|---|---|---|---|---|---|
| Total | Carbonate | Non- carbonate |
||||||||||||||
| 11-14-1956 | 0 | 60 | 2,679 | 9.0 | 0.37 | 144 | 51 | 781 | 410 | 471 | 1,020 | 0.8 | 0.5 | 568 | 336 | 232 |
| 12-10-1956 | 0.2 | 5 | 1,779 | 16 | 0.54 | 155 | 38 | 449 | 488 | 329 | 550 | 1.2 | 0.4 | 542 | 400 | 142 |
| 1-22-1957 | 6.6 | 20 | 2,037 | 8.0 | 0.22 | 158 | 46 | 533 | 486 | 382 | 670 | 1.3 | 0.3 | 583 | 398 | 185 |
| 2-19-1957 | 9.7 | 70 | 1,242 | 5.0 | 0.43 | 94 | 29 | 325 | 307 | 246 | 390 | 2.2 | 0.3 | 353 | 252 | 101 |
| 3-19-1957 | 9.3 | 40 | 1,300 | 3.0 | 0.43 | 101 | 32 | 334 | 307 | 268 | 410 | 1.0 | 0.3 | 383 | 252 | 131 |
| 4-17-1957 | 22 | 90 | 553 | 7.0 | 0.39 | 91 | 18 | 81 | 249 | 150 | 80 | 2.8 | 0.4 | 301 | 204 | 97 |
| 5-15-1957 | 1,910 | 8,000 | 130 | 9.0 | 29 | 5.7 | 9.0 | 112 | 16 | 3.0 | 2.7 | 0.3 | 96 | 92 | 4.0 | |
| 6-19-1957 | 2,150 | 4,500 | 127 | 11 | 29 | 4.8 | 8.5 | 110 | 14 | 2.0 | 3.1 | 0.2 | 92 | 90 | 2.0 | |
| 7-16-1957 | 1,420 | 800 | 215 | 16 | 43 | 8.4 | 19 | 146 | 40 | 14 | 2.2 | 0.2 | 142 | 120 | 22 | |
| 8-20-1957 | 154 | 200 | 385 | 9.0 | 0.85 | 62 | 9.1 | 65 | 193 | 72 | 70 | 2.8 | 0.2 | 192 | 158 | 34 |
| 9-18-1957 | 126 | 200 | 580 | 11 | 0.64 | 99 | 17 | 85 | 273 | 134 | 94 | 5.8 | 0.2 | 317 | 224 | 93 |
| 10-22-1957 | 120 | 729 | 16 | 0.41 | 120 | 19 | 115 | 333 | 164 | 127 | 4.2 | 0.2 | 278 | 273 | 105 | |
| 11-25-1957 | 15 | 759 | 15 | 0.29 | 124 | 20 | 120 | 351 | 176 | 125 | 6.2 | 0.3 | 392 | 288 | 104 | |
| 12-10-1957 | 20 | 764 | 7.5 | 0.33 | 114 | 26 | 125 | 334 | 187 | 135 | 4.9 | 0.3 | 392 | 274 | 118 | |
Table 13--Analyses of water from Saline River at gaging station south of Tescott Analyzed by Division of Sanitation, Kansas State Board of Health (from Chemical Quality of Surface Waters in Kansas, 1957). Dissolved constituents given in parts per million. One part per million is equivalent to 1 pound of substance per million pounds of water or 8.33 pounds per million gallons of water.
| Date | Discharge (cfs) |
Turbidity | Dissolved solids (TS) |
Silica (SiO2) |
Iron (Fe) |
Calcium (Ca) |
Magnesium (Mg) |
Sodium and Potassium (Na+K) |
Bicarbonate (HCO3) |
Sulfate (SO4) |
Chloride (Cl) |
Nitrate (NO3) |
Fluoride (F) |
Hardness as CaCO3 | ||
|---|---|---|---|---|---|---|---|---|---|---|---|---|---|---|---|---|
| Total | Carbonate | Non- carbonate |
||||||||||||||
| 10-9-1956 | 5.8 | 70 | 4,424 | 10 | 0.55 | 179 | 81 | 1,358 | 342 | 685 | 1,940 | 2.1 | 0.5 | 780 | 280 | 500 |
| 11-17-1956 | 8.6 | 60 | 2,463 | 6.5 | 0.35 | 113 | 42 | 749 | 281 | 382 | 1,030 | 1.8 | 0.5 | 454 | 230 | 224 |
| 12-14-1956 | 9.2 | 5 | 5,065 | 11 | 0.26 | 193 | 93 | 1,574 | 449 | 741 | 2,230 | 1.3 | 0.5 | 864 | 368 | 496 |
| 1-23-1957 | 8.6 | 20 | 5,613 | 4.5 | 0.26 | 184 | 108 | 1,767 | 442 | 849 | 2,480 | 1.5 | 0.6 | 903 | 362 | 541 |
| 2-18-1957 | 20 | 20 | 3,969 | 4.0 | 0.18 | 141 | 74 | 1,242 | 332 | 597 | 1,745 | 2.6 | 0.5 | 656 | 272 | 384 |
| 3-20-1957 | 16 | 70 | 4,117 | 5.0 | 0.53 | 155 | 80 | 1,270 | 342 | 652 | 1,785 | 0.8 | 0.5 | 716 | 280 | 436 |
| 4-24-1957 | 71 | 250 | 2,215 | 5.0 | 1.2 | 140 | 44 | 615 | 257 | 413 | 870 | 0.8 | 0.3 | 531 | 211 | 320 |
| 5-16-1957 | 2,400 | 6,000 | 219 | 7.5 | 39 | 5.5 | 34 | 139 | 29 | 33 | 2.4 | 0.2 | 120 | 114 | 6.0 | |
| 6-21-1957 | 5,440 | 3,000 | 162 | 11 | 34 | 5.6 | 15 | 120 | 23 | 10 | 4.0 | 0.2 | 108 | 98 | 10 | |
| 7-23-1957 | 871 | 6,000 | 772 | 11 | 80 | 14 | 180 | 171 | 156 | 242 | 4.2 | 0.4 | 257 | 140 | 117 | |
| 8-20-1957 | 326 | 500 | 2,116 | 10 | 2.7 | 148 | 43 | 568 | 268 | 412 | 800 | 2.9 | 0.4 | 546 | 220 | 326 |
| 10-25-1957 | 3,600 | 1,060 | 7.5 | 99 | 19 | 263 | 202 | 195 | 372 | 4.0 | 0.5 | 325 | 166 | 159 | ||
| 11-26-1957 | 20 | 1,954 | 13 | 0.41 | 162 | 43 | 494 | 366 | 376 | 680 | 5.3 | 0.4 | 580 | 300 | 280 | |
| 12-13-1957 | 25 | 2,090 | 10 | 0.38 | 167 | 44 | 540 | 377 | 398 | 740 | 5.3 | 0.4 | 598 | 309 | 289 | |
Turbidity increases with an increase in discharge because of greater sediment-carrying capacity of the river. Increased discharge proportionately decreases the percentage of dissolved solids per unit volume. Flood water (precipitation) is relatively free of dissolved solids, and the discharge of ground water containing more dissolved solids is diminished by a rise in river level. Where a river is hydraulically connected to ground water under artesian pressure, the discharge of ground water to the river will be decreased because of a decrease in slope of the piezometric surface. Where the river is hydraulically connected to ground water under nonartesian conditions, the river will discharge to ground water. Flood water or discharge in appreciable excess of base flow is of very good chemical quality except for turbidity or suspended solids.
Water for Irrigation Use
The following discussion is adapted from Soil, the Agriculture Yearbook of 1957 (Bower and Fireman, 1957), Agriculture Handbook 60 (U. S. Salinity Laboratory Staff, 1954), U. S. Department of Agriculture, and ground-water reports of the State Geological Survey of Kansas.
Crops require a certain amount of water and mineral matter for growth. If dissolved solids in irrigation water are excessive, they cause dehydration of vegetation, and sodium disperses clay particles, reducing aeration and percolation of water in the soil, which will eventually cause the soil to become unproductive. Saline soils contain excessive amounts of soluble salts, which consist mainly of sodium, calcium, magnesium, chloride, and sulfate, and secondarily of potassium, bicarbonate, carbonate, nitrate, and boron. Alkali soils contain an excessive amount of absorbed sodium; in soils, sodium ion is exchangeable with calcium and magnesium and will persist after most soluble salts are removed. Soluble salts can be removed from soil by leaching, and absorbed sodium can be removed by replacing it by three types of chemical amendments. These are soluble calcium salts (calcium chloride and calcium sulfate or gypsum), calcium salts of low solubility (calcium carbonate or limestone), and acids or acid formers (sulfuric acid, sulfur, and iron and aluminum sulfate). The choice of chemical amendments depends on their solubility in available water and on the salinity and pH of the soil.
Irrigation water may be classified from data on the total concentration of soluble salts and the sodium-adsorption ratio (SAR). The most convenient measure of the amount of dissolved salts is the electrical (specific) conductance. The SAR may be determined by the formula
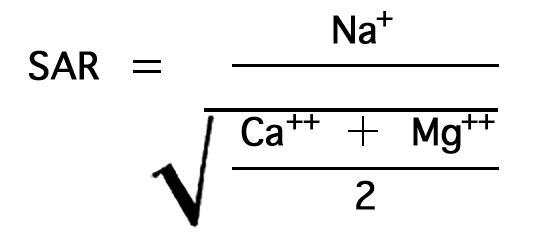
in which the concentrations are expressed in equivalents per million. The nomogram (Fig. 34) will readily solve this equation for the SAR if the sodium, in milliequivalents per liter, is plotted on scale A, and the sum of calcium and magnesium, in milliequivalents per liter, is plotted on scale B. A line connecting these points will pass through the SAR scale and give the SAR value at the intersection. The suitability of water for irrigation may then be determined by plotting the SAR value (sodium hazard) and the conductivity value (salinity hazard) on the diagram in Figure 35.
Figure 34--Nomogram for sodium-adsorption ratio of water.
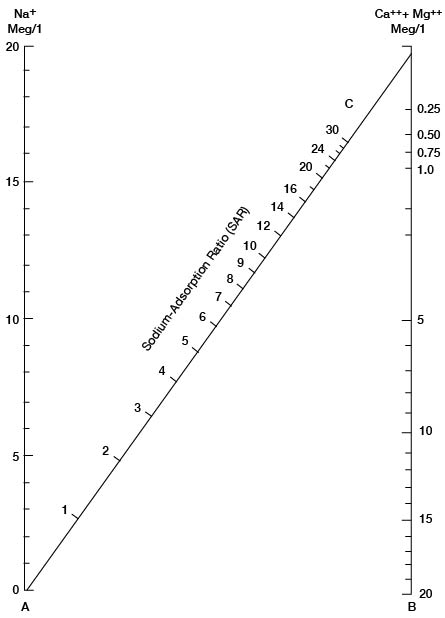
Figure 35--Classification of irrigation waters. (After U. S. Salinity Laboratory Staff, 1954.)
Low-sodium water (S1) can be used for irrigation on almost all soils with little danger of developing harmful levels of exchangeable sodium. Medium-sodium water (S2) can be used safely on coarse-textured or organic soils having good permeability, but it will present an appreciable sodium hazard in certain fine-textured soils, especially those not leached thoroughly. High-sodium water (S3) may produce harmful levels of exchangeable sodium in most soils and will require special soil management such as good drainage, thorough leaching, and addition of organic matter. Very high sodium water (S4) is generally unsatisfactory for irrigation unless special action is taken, such as the addition of gypsum to the soil.
Low-salinity water (C1) can be used for irrigation of most crops on most soils with little likelihood that soil salinity will develop. Medium-salinity water (C2) can be used if a moderate amount of leaching occurs. Crops of moderate salt tolerance, such as potatoes, corn, wheat, oats, and alfalfa, can be irrigated with C2 water without special practices. High-salinity water (C3) cannot be used on soils with restricted drainage. Very high salinity water (C4) can be used only on certain crops and then only if special practices are followed. Thus, it is clear that good drainage, careful soil management, proper irrigation techniques, and good water are necessary for prolonged satisfactory irrigation.
Water quality is sufficiently variable in Ottawa County to warrant careful examination prior to extensive irrigation. The water from the few irrigation wells in Ottawa County was not analyzed.
Summary of Kansas Water Law
The following information is summarized from the Report on the Laws of Kansas Pertaining to the Beneficial Use of Water (Kansas Water Resources Board, 1956) and The Kansas Law of Water Rights (Hutchins, 1957).
From the time Kansas was originated, as a territory in 1854 and as a state in 1861, until 1945, water litigation was based on two separate doctrines. The first to be applied was the common-law riparian doctrine. Basically, it stated that water rights were attached to the land contiguous to stream banks and were real property rights. At first this was interpreted to mean that the riparian owner was entitled to have the water course flow through his lands undiminished in quantity and unaltered in quality. In time, this was altered to mean that upper riparian owners were permitted to use stream water on their land and for domestic purposes as long as they were not wasteful of water and used it with reasonable regard to the effect on other riparian owners of the same stream.
Ground-water law was more perplexing. Different sets of rules covered different situations without particular regard to physical principles of ground-water flow.
The common-law riparian doctrine is modified by the American, or reasonable-use, doctrine which follows the philosophy that a man must use his property in such a manner as not to injure that of another. Directly applied to water, the appropriation doctrine states that all unused water belongs to all the people of the state. The first person to divert water from a surface or ground source and use it for beneficial purposes has a better right to continue using the same amount than a person who starts, at a later date, to use water from the same source. Simply stated, the first in time is first in right. Virtually everywhere that the appropriation doctrine is followed, it is verified that the use must be a beneficial one.
In 1945, the Kansas legislature provided an effective means of acquiring appropriation rights by creating a water-appropriation act. A brief summary of the procedure for acquiring an appropriation right is given in Kansas Water Resources Board, Bulletin 3, 1957, pages 8 and 9:
To obtain the right to appropriate' and use a certain amount of water, a person must apply in writing to the Chief Engineer of the Division of Water Resources of the Kansas State Board of Agriculture for a certain amount of water from a named source. If the Chief Engineer finds that the appropriation would be in the public interest, he approves the application and tells the person to proceed with the diversion and application of water to a beneficial use within reasonable limitations and within a reasonable time. When the applicant constructs his diversion works and starts using the water, he is required to notify the Chief Engineer. If after an inspection, the Chief Engineer finds that the applicant has completed the appropriation as authorized, he issues a certificate of appropriation in duplicate. The applicant is supposed to record one copy with the register of deeds of the county where the point of diversion is located. The duplicate of the record stays in the Chief Engineer's office. The applicant then has an appropriation right.
The Water Appropriation Act of 1945 and amendments of 1957 (primarily concerning definition of terms, duties and procedures of personnel involved, appropriation priorities, and the mechanics of appropriation) provide an adequate framework for blending equity by law with physical principles of water behavior.
Prev Page--Hydrology || Next Page--Well Records
Kansas Geological Survey, Geology
Placed on web March 23, 2009; originally published January, 1962.
Comments to webadmin@kgs.ku.edu
The URL for this page is http://www.kgs.ku.edu/General/Geology/Ottawa/08_qual.html