![]()
Prev Page--Aquifer Tests || Next Page--Utilization
Ground Water, continued
Movement of Ground Water
Shape and Slope of the Water Table
Plate 1 was compiled from measurements of depth to water made in the summer of 1954 in wells and test holes whose surface altitudes were later determined by plane table and alidade. Table 7 contains the water-level measurements and altitudes of the wells and test holes. The water-table contours connect points of equal altitude of water level in wells and show the configuration of the water table just as topographic maps show the shape of the land surface.
Ground water moves in a direction at right angles to the contours. The gradient may be determined by inspection of the spacing of the contours. Ground water is moving through Logan County in a generally eastward direction at an average gradient of 10 feet per mile. The gradient is controlled in part by the slope of the surface of the Cretaceous rocks, which also is shown on Plate 1. Comparison of the two sets of contours shows that local irregularities in the (shale and chalk) floor are not reflected in the water table. The local configuration of the water table is caused mainly by local differences in recharge or discharge. These local influences include undrained depressions, pumping wells, streams, and areas differing in porosity, permeability, or thickness of the water-bearing materials.
Local differences in permeability and thickness of the water-bearing beds probably cause the principal irregularities in the water table. In general, the slope of the water table is least in areas underlain by thick, permeable rocks and is steepest in areas underlain by thin, relatively impermeable rocks. Thus, the gradient of the water table steepens in rocks of low transmissibility and flattens in rocks of relatively high transmissibility.
The depth to water, based on measurements made in 1954, is shown in Plate 2. The deepest water level measured in Logan County is in well 13-33-6bb, where the depth to water in the Dakota formation was 695 feet. The maximum depth to water in the Pleistocene deposits and Ogallala formation is 173 feet below the land surface, along the northern edge of the area. The depth to water is least in the alluvium in the stream valleys.
Fluctuations of the Water Table
The factors tending to raise the water table in Logan County are precipitation that penetrates the ground and reaches the zone of saturation, seepage from streams and undrained depressions, and ground water that enters the area by underground movement from the west and north. The factors tending to lower the water table are pumping from wells, discharge from springs, ground-water discharge into streams, evaporation and transpiration, and movement of ground water eastward and southward out of the area.
Five wells in Logan County were selected as observation wells from which to obtain information concerning fluctuations of the water table. Periodic measurement of the water level in these wells has been made chiefly by Howard Corrigan of the Division of Water Resources of the Kansas State Board of Agriculture. These water-level measurements (Table 7) have been published in U. S. Geological Survey Water-Supply Papers 946 (1944, pt. 3, p. 137-138), 988 (1946, pt. 3, p. 126-127), 1018 (1947, pt. 3, p. 103-104), 1025 (1948, pt. 3, p. 105-106), 1073 (1949, pt. 3, p. 99), 1098 (1951, pt. 3, p. 110), 1128 (1951a, pt. 3, p. 101), 1158 (1952, pt. 3, p. 101), 1167 (1952a, pt. 3, p. 68), 1193 (1954, pt. 3, p. 75), 1223 (1954a, pt. 3, p. 41), 1267 (1955, pt. 3, p. 50), 1323 (1956, pt. 3, p. 39), and 1406 (1957, pt. 3, p. 37).
A graph showing the changes of water level during the period 1945 to 1955 in well 11-32-2cc, which is near the city limits of Oakley, is shown in Figure 10. A progressive 30-month average was plotted to smooth out minor variations in individual measurements. The curve indicates that the changes in water level in the Ogallala formation are very small. The water level had a downward trend until 1948, an upward trend until mid-1954, and then a downward trend after 1954.
Fig. 10--Graph showing progressive 30-month average water level in 11-32-2cc.
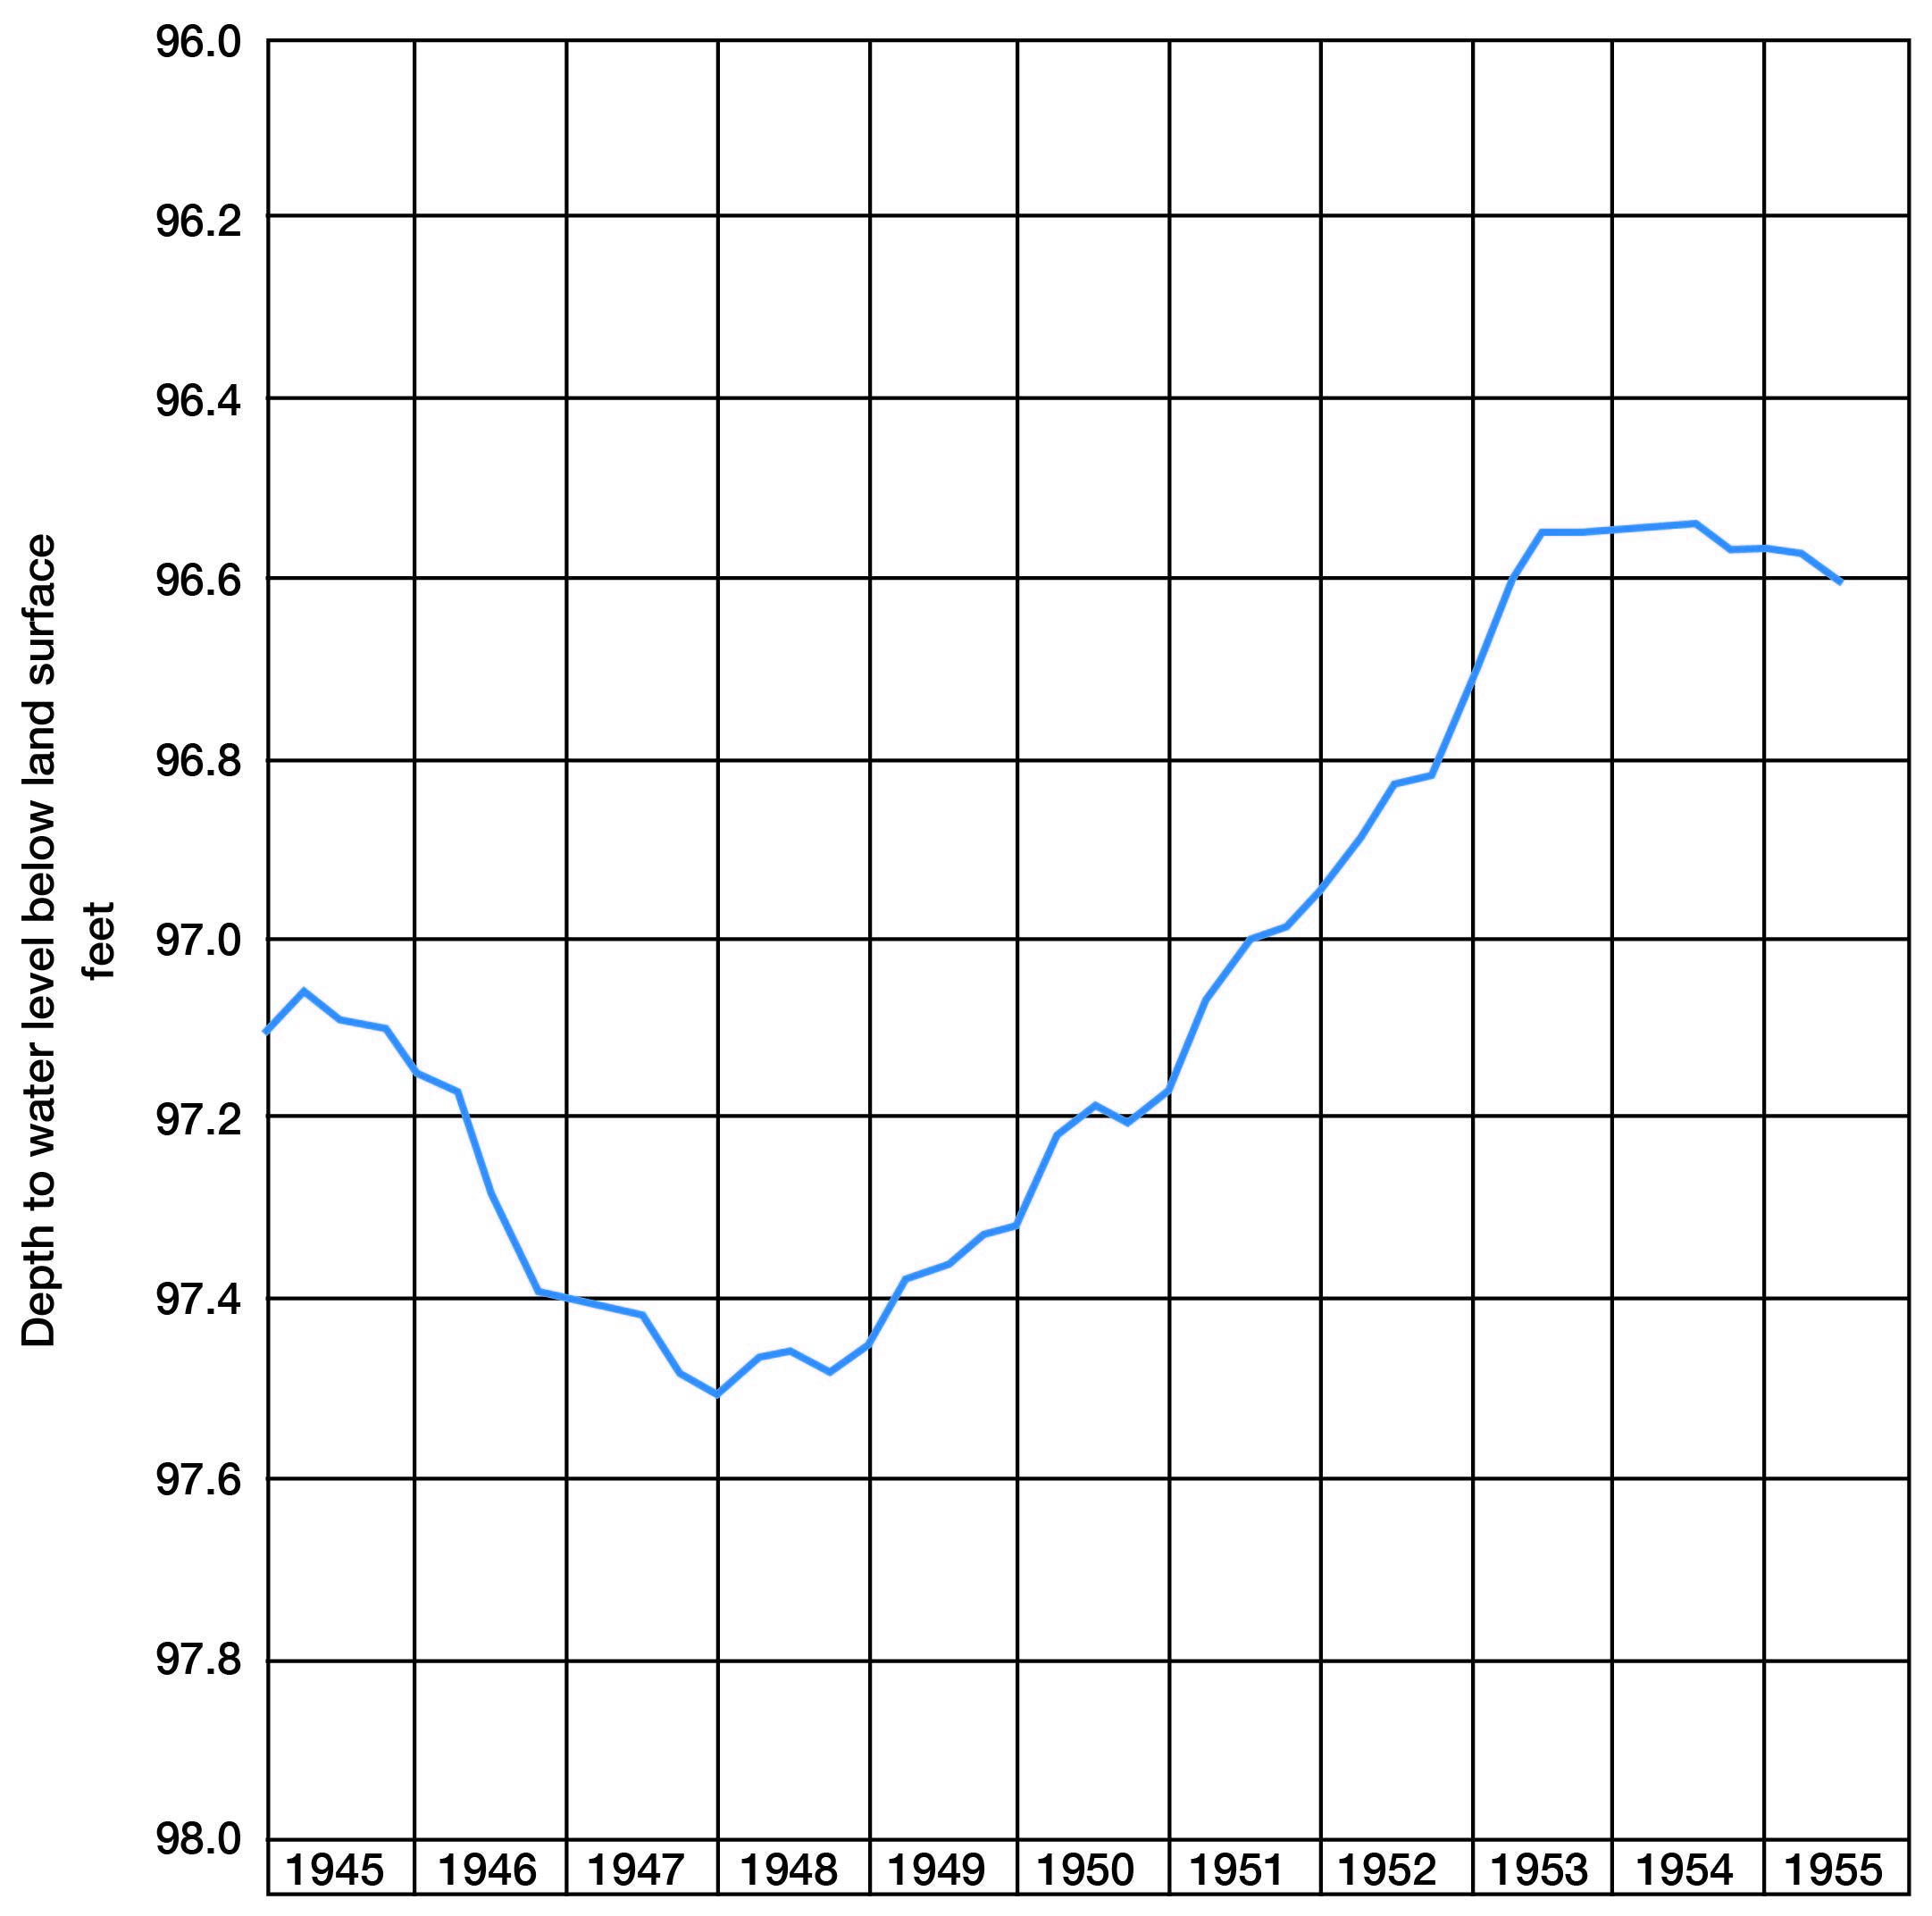
The observations made in well 11-32-2cc show that the water responds to precipitation only after a considerable lapse of time. The lowest point of the hydrograph is near the end of 1947 (Fig. 4). The significant rise of the water level ends in mid-1953. The length of record of well measurements is too short, however, to confirm what seems to be a cyclic trend in water-level fluctuations lagging more than 2 years behind that of precipitation.
Table 7--Records of water levels in selected wells.
| Date | Depth to water level feet |
|---|---|
| Well 11-32-2cc | |
| Sept. 17, 1942 | 97.62 |
| Oct. 7 | 97.58 |
| Nov. 27 | 97.46 |
| Dec. 14 | 97.0-0 |
| Jan. 11, 1943 | 97.08 |
| Feb. 11 | 97.07 |
| Mar. 19 | 97.06 |
| Apr. 12 | 96.56 |
| May 5 | 96.69 |
| June 8 | 96.98 |
| July 3 | 97.11 |
| Aug. 6 | 97.25 |
| Sept. 16 | 97.41 |
| Oct. 21 | 97.43 |
| Nov. 11 | 97.38 |
| Nov. 23 | 97.29 |
| Jan. 22, 1944 | 96.42 |
| Feb. 27 | 97.23 |
| Mar. 18 | 97.08 |
| Apr. 24 | 96.98 |
| May 24 | 97.09 |
| June 12 | 97.10 |
| July 20 | 97.15 |
| Aug. 10 | 97.24 |
| Sept. 5 | 96.93 |
| Oct. 19 | 97.43 |
| Nov. 28 | 97.36 |
| Dec. 18 | 97.37 |
| Jan. 16, 1945 | 97.23 |
| Apr. 24 | 97.22 |
| July 10 | 97.42 |
| Oct. 23 | 97.67 |
| Jan. 16, 1946 | 97.61 |
| Apr. 25 | 97.64 |
| July 8 | 97.69 |
| Oct. 4 | 97.93 |
| Jan. 6, 1947 | 99.29 |
| Apr. 4 | 97.49 |
| July 9 | 97.33 |
| Oct. 14 | 97.91 |
| Jan. 14, 1948 | 97.66 |
| Apr. 13 | 97.28 |
| July 13 | -97.50 |
| Oct. 13 | 97.79 |
| Jan. 5, 1949 | 97.41 |
| Apr. 14 | 97-12 |
| July 19 | 97.10 |
| Oct. 10 | 97.17 |
| Jan. 24, 1950 | 97.21 |
| Apr. 25 | 96.92 |
| July 25 | 97.34 |
| Oct. 9 | 97.40 |
| Jan. 8, 1951 | 97.20 |
| Apr. 23 | 96.85 |
| July 18 | 96.77 |
| Oct. 17 | 96.95 |
| Jan. 16, 1952 | 96.72 |
| Apr. 9 | 96.65 |
| July 14 | 96.52 |
| Oct. 14 | 96.75 |
| Jan. 21, 1953 | 96.49 |
| Apr. 21 | 96.25 |
| July 8 | 96.50 |
| Oct. 13 | 96.86 |
| Apr. 28, 1954 | 96.71 |
| July 20 | 96.93 |
| July 28 | 96.71 |
| Oct. 25 | 97.01 |
| Jan. 24, 1955 | 96.65 |
| Apr. 13 | 96.66 |
| July 1.3 | 97.05 |
| Sept. 23 | 97.38 |
| Oct. 11 | 96.86 |
| Well 11-32-24dd | |
| Sept. 17, 1942 | 60.77 |
| Oct. 7 | 60.74 |
| Nov. 27 | 60.79 |
| Dec. 14 | 60.82 |
| Jan. 11, 1943 | 59.89 |
| Feb. 11 | 59.86 |
| Mar. 19 | 59.66 |
| Apr. 12 | 69.88 |
| May 5 | 59.85 |
| June 8 | 59.92 |
| July 3 | 59.98 |
| Aug. 6 | Pumping |
| Sept. 16 | 66.11 |
| Oct. 21 | 60.10 |
| Nov. 11 | 60.14 |
| Nov. 23 | Pumping |
| Jan. 22, 1944 | 60.17 |
| Feb. 27 | 65.21 |
| Apr. 24 | 60.26 |
| May 24 | 59.94 |
| July 20 | 59.87 |
| Aug. 10 | 59.87 |
| Sept. 5 | 59.88 |
| Oct. 19 | 59.96 |
| Nov. 28 | 60.02 |
| Dec. 18 | 60.04 |
| Jan. 16, 1945 | 60.39 |
| Apr. 24 | 60.19 |
| July 10 | 60.22 |
| Jan. 16, 1946 | 60.25 |
| Apr. 25 | 60.32 |
| July 8 | 60.16 |
| Oct. 4 | 60.21 |
| Jan. 6, 1947 | 60.03 |
| Apr. 4 | 59.86 |
| July 9 | 59.80 |
| Oct. 14 | 0-9.88 |
| Jan. 14, 1948 | 59.97 |
| Apr. 13 | 59.98 |
| July 13 | 59.89 |
| Oct. 13 | 59.59 |
| Jan. 5, 1949 | 59.85 |
| Apr. 14 | 59.80 |
| Oct. 12 | 59.67 |
| Apr. 25, 1950 | 62.49 |
| Discontinued | |
| Well 11-34-16cc | |
| Aug. 11, 1952 | 126.21 |
| Jan. 6, 1953 | 126.63 |
| May 12 | 126.51 |
| Aug. 18 | 126.46 |
| Nov. 24 | 126.42 |
| Feb. 9, 1954 | 126.19 |
| Mar. 4 | 126.16 |
| July 1 | 126.15 |
| July 28 | 126.20 |
| Aug. 10 | 126.24 |
| Nov. 23 | 126.45 |
| Feb. 22, 1955 | 126.19 |
| May 4 | 126.21 |
| Aug. 30 | 126.08 |
| Sept. 23 | 126.18 |
| Well 12-32-27ba | |
| Oct. 7, 1942 | 80.75 |
| Nov. 27 | 80.61 |
| Dec. 14 | 80.66 |
| Jan. 11, 1943 | 80.65 |
| Feb. 11 | 80.63 |
| Mar. 19 | 80.58 |
| Apr. 12 | 80.54 |
| May 5 | 80.49 |
| June 8 | 80.55 |
| June 23, 1954 | 79.03 |
| Well 12-37-27aa | |
| Aug. 11, 1952 | 43.56 |
| Jan. 6, 1953 | 43.53 |
| May 12 | 43.61 |
| Aug. 18 | 43.76 |
| Nov. 24 | 43.83 |
| Feb. 9, 1954 | 43.89 |
| Mar. 4 | 43.95 |
| July 9 | 43.95 |
| July 28 | 43.99 |
| Aug. 10 | 44.60 |
| Nov. 23 | 44.34 |
| Feb. 22, 1955. | 44.00 |
| May 4 | 43.94 |
| Aug. 30 | 43.77 |
| Sept. 27 | 43.73 |
| Well 13-32-10dd | |
| Oct. 7, 1942 | 33.59 |
| Nov. 27 | 33.56 |
| Dec. 14 | 33.64 |
| Jan. 11, 1943 | 33.65 |
| Feb. 11 | 33.64 |
| Mar. 19 | 33.63 |
| Apr. 12 | 33.62 |
| May 5 | 33.59 |
| June 8 | 33.57 |
| July 3 | 33.58 |
| Aug. 6 | 34.85 |
| Sept. 16 | 33.68 |
| Oct. 21 | 33.61 |
| Nov. 11 | 33.59 |
| Nov. 23 | 33.48 |
| Jan. 22, 1944 | 33.64 |
| Feb. 27 | 33.62 |
| Mar. 18 | 33.63 |
| Apr. 24 | 11.93 |
| June 12 | 33.60 |
| July 19 | 33.58 |
| Aug. 18 | 33.71 |
| Sept. 5 | 33.47 |
| Oct. 19 | 33.48 |
| Nov. 28 | 33.45 |
| Dec. 18 | 33.45 |
| Jan. 16, 1945 | 33.41 |
| Apr. 24 | 33.47 |
| July 10 | 33.50 |
| Oct. 23 | 33.45 |
| Jan. 16 | 33.50 |
| Apr. 25 | 33.50 |
| July 8 | 33.51 |
| Oct. 3 | 33.43 |
| Jan. 6, 1947 | 33.23 |
| Apr. 4 | 33.23 |
| July 9 | 33.25 |
| Oct. 14 | 33.27 |
| Jan. 14, 1948 | 33.39 |
| Apr. 13 | 33.30 |
| July 13 | 33.28 |
| Oct. 13 | 32.32 |
| Destroyed in 1949 | |
Recharge of Ground Water
Recharge from Precipitation
Very little of the 18 to 19 inches of annual precipitation in Logan County reaches the water table in an average year. This recharge limits the amount of ground water that can be pumped without steadily lowering the water table. For this reason, an estimate is made of the probable recharge that can be utilized by wells in the northern upland area in Logan County, which may be extensively developed for irrigation.
The ground water that accumulates from recharge of the aquifer by precipitation moves eastward (Pl. 1) at a slope of approximately 10 feet per mile--in other words, at a hydraulic gradient of 0.0019--and flows through the aquifer shown on the geologic section A-A' (Pl. 3). The movement through each square foot of the cross section is estimated by assuming a coefficient of permeability of 440 gpd per foot, as determined from the aquifer tests. The total area of saturated material in the cross section is about 2,750,000 square feet. Thus, the ground-water movement through this section is:
(440) (0.0019) (2,750,000) = 2,300,000 gpd,
or 2,600 acre-feet per year.
On Plate 1 it can be seen that contours on the water table are generally at right angles to the north county line, hence no appreciable amount of ground water moves across the northern border of this upland. Therefore, the water moving through materials illustrated by geologic cross section A-A' (Pl. 3) must be derived from recharge from precipitation over this northern upland area.
The total amount of precipitation falling on the 300 square miles of the northern upland area is approximately 19 inches per year and amounts to a total of 304,000 acre-feet per year. Calculations show that only 0.85 percent of the precipitation, approximately, 1/6 inch, becomes ground-water recharge. This computation was checked by using geologic cross sections B-B', C-C', and D-D' and computing the recharge in these smaller parts of the area. It should be emphasized that this 1/6 inch of recharge does not represent the actual total recharge to the ground-water reservoir from precipitation in the area, but represents only that amount of recharge that moves as ground water across the area illustrated by section A-A'. All additional quantity of recharge from precipitation is discharged from springs and seeps at the contact of the Tertiary rock and the underlying Cretaceous rock floor where this contact crops out at the southern boundary of the upland area; some of the ground water that sinks into crevices in the Cretaceous rocks may leave the county underground; and some ground water is discharged by wells. The ground-water movement through A-A' represents the additional amount that could be pumped by wells instead of discharging from the area by ground-water movement into Gove County. The total recharge to the northern upland area cannot be determined accurately because of the difficulty of estimating the discharge of ground water at the exposed contact of the Ogallala formation and the underlying Cretaceous rocks.
Recharge from Streams and Lakes
In the upland areas, during periods of flow in streams such as Hackberry, Chalk, and Twin Butte creeks, some water leaves the channels and percolates into the underlying Ogallala formation. This percolation contributes recharge to the aquifers. Most of the water from such streams represents water that fell as precipitation within the county.
Shallow depressions or "lagoons" are common in Logan County and are shown on Plate 1 as intermittent ponds. The fact that these depressions, some of which may be 150 feet above the water table, are occupied by shallow ponds for weeks after a heavy rain indicates that most of the water evaporates. Latta (1944, p. 73-74) presented evidence that rapid recharge from storm water took place in a similar depression in Finney County, however. Even though the water level in a well in the depression was 112 feet below the surface, a rapid response to precipitation was noted, and a temporary mound on the water table developed. Latta concluded from this evidence that other depressions in the uplands probably act as catchment areas for recharge and that the water table beneath them fluctuates similarly. In Logan County probably a small part of the water in the depressions recharges the water table, but certainly most of the water evaporates.
Recharge from Irrigated Lands
In the Safford Basin in Arizona (Turner and others, 1941), recharge from irrigation is estimated to approach 25 percent of the applied water. In that locality the irrigation water is distributed in relatively long ditches over alluvial soils that are very permeable. The upland plain in Logan County is heavily mantled by loess, has a dense soil, and is irrigated from water-distribution systems that lose less water; hence, the recharge probably does not exceed 10 percent of the water applied. On the irrigated lands on the flood plain, where the soils are sandy and flooding of hay crops is practiced, the percentage of applied water that recharges the groundwater reservoir is probably somewhat greater.Recharge by Ground-Water Movement from Adjacent Areas
Plate 1 indicates movement of ground water from Wallace County eastward into the southern upland-plain area of Logan County. The saturated thickness is small, and the recharge probably amounts to less than 25 acre-feet per year.
In the northern uplands of Logan County the ground-water contours are approximately normal to the Thomas County line, indicating that movement across this boundary is negligible. Some ground water moves from Thomas and Wallace counties into Logan County through the alluvial fill of Smoky Hill River and Turtle Creek. The cross-sectional area of the saturated valley fill is small, and the quantity of water moving through these materials probably is negligible.
Discharge of Ground Water
Ground water is discharged from the zone of saturation in Logan County in the following ways: evaporation from the water table where it is close to the land surface, transpiration by vegetation, discharge by springs, discharge into surface streams, withdrawal from wells, and movement underground to adjacent areas. The measurements of water level in observation wells (Table 7) show that the water table in the upland area has not fluctuated significantly in recent years; thus, the ground-water discharge is in approximate equilibrium with recharge to the ground-water reservoir.
Discharge by Evaporation and Transpiration
Where the water table is within a few feet of the land surface, ground water may evaporate directly from the capillary fringe overlying the ground-water reservoir. If the water table is within a few inches of the land surface, evaporation may occur directly from the zone of saturation. Much of Logan County is an upland area in which the depth to the water table exceeds 40 feet, so that the total amount of ground water discharged by this means probably is not large. In the stream valleys, where the water table is approximately at the level of the stream bed, some ground water is discharged in this manner.
Water may be taken into the roots of plants directly from the zone of saturation and discharged from the plants by transpiration. The depth to which the roots of plants go for water varies with different kinds of plants and types of soil. Plants and grasses commonly do not draw water from depths of more than a few feet, but certain plants, such as alfalfa and cottonwood, may obtain water 20 to 30 feet below the surface. In most of Logan County the water level is considerably below the root tips of plants. In certain areas in the main river valleys and even in upland draws, however, the water table is not far below the land surface, and alfalfa, cottonwood, and hackberry transpire water directly from the water table.
Discharge by Springs
The amount of ground water discharged from springs in Logan County probably is large. There are many springs in the area, most of which discharge at the contact of the Cretaceous formations and the overlying more permeable Pliocene or Pleistocene rocks. Springs at the contact of the Ogallala formation and the underlying Pierre shale or Niobrara formation provide much of the recharge to the ground-water reservoirs in the alluvial fill along the draws in the rolling grassland area intermediate between the upland plain and the flood plain of the main valleys. Springs at the contact of these formations are used as sources of ground-water supplies in the southeastern part of the county.
Springs at the base of the Sanborn Group, of Pleistocene age, generally are larger than those issuing from other formations and are those most commonly developed for livestock and domestic use. The largest spring in the county is believed to be the Hinshaw spring in the NW sec. 23, T. 13 S., R. 37 W., which discharges 60 to 65 gpm at the base of gravel of the Sanborn Group overlying the Niobrara formation. Springs near Russell Springs supply ground water to residents in that vicinity. In the NE sec. 10, T. 13 S., R 36 W., the surface flow derived from springs at the base of Pleistocene sand and gravel is impounded by a small dam and used to water livestock.
The contact of the Ogallala formation and the underlying Cretaceous rocks represents a hydrologic boundary of the upland-plain areas along which the ground water is discharged by springs in areas where the contact crops out. Because the surface of the underlying Cretaceous rocks slopes toward points of outcrop, the flow cannot be stopped unless the ground-water reservoir is drained entirely; thus, the flow is not greatly affected by lowering of the water table in areas miles from the outcrop. For this reason, in computing the quantity of water in such upland areas that can be utilized, the quantity of ground water discharged by these contact springs was ignored.
Discharge by Wells
Most rural residents obtain water for domestic and livestock supplies from small drilled wells equipped with cylinder pumps powered by windmills. The yields of most of these wells are not more than 5 gpm, and they probably average only about 1 gpm. Because of their great number and relatively long pumping periods, however, such wells represent an important withdrawal from the ground-water reservoir. Pumpage for these purposes over the entire area probably is in the magnitude of 1,000 acre-feet per year. A total of approximately 100 acre-feet per year is pumped from public-supply wells at Oakley and Winona. A total of about 1,000 acre-feet per year is pumped from irrigation wells on the upland and the flood plain.
In 1955 the total discharge from wells in the area was estimated to be in excess of 2,000 acre-feet. If the county follows the trend of others in western Kansas toward putting increased acreages under deep-well irrigation, the annual pumpage of ground water in Logan County will show a marked increase in future years.
Discharge to Adjacent Areas
Some ground water is discharged from Logan County by underground movement to adjacent areas. In the northern upland area the discharge eastward into Gove County is estimated to be about 2,600 acre-feet per year. In the southern upland area some ground water moves southeastward into Wichita County, but because the surface of the relatively impermeable Cretaceous rocks slopes to the southeast away from the Pliocene-Cretaceous contact, the amount is believed to be relatively small. Some water, but probably a negligible amount, leaves the county in the Cretaceous rocks; it may be balanced by similar inflow in those rocks.
The movement of ground water out of the county through the alluvial fill of the Smoky Hill River valley is negligible because of the small cross-sectional area of the fill.
Prev Page--Aquifer Tests || Next Page--Utilization
Kansas Geological Survey, Geology
Placed on web Dec. 14, 2007; originally published May, 1958.
Comments to webadmin@kgs.ku.edu
The URL for this page is http://www.kgs.ku.edu/General/Geology/Logan/06_gw2.html