![]()
Prev Page--Formations || Next Page--Movement of Ground Water
Ground Water
A general discussion of the principles of ground-water occurrence with special reference to Kansas has been presented by Moore and others (1940) and the reader is referred to that report for a more detailed discussion.
Ground water in Logan County is derived from precipitation that falls locally or on adjacent areas to the west. Part of the water that falls as rain or snow runs off directly over the land surface to streams; most of it percolates downward into the soil where it is stored and whence it is later transpired by plants or evaporated. A small amount of water that escapes surface runoff, transpiration, and evaporation percolates downward through the soil and underlying strata until it reaches the water table, where it joins the body of ground water in the zone of saturation.
The water table is the upper surface of the zone of saturation in ordinary porous rock. The water table is not a plane surface, but slopes from areas of recharge to areas of discharge. The water table does not remain stationary, but fluctuates in response to additions to or withdrawals from water in storage.
The specific yield of a rock or soil, with respect to water, is the ratio of (1) the volume of water it will yield by gravity after being saturated to (2) its own volume. This ratio may be stated as either a percentage or a decimal fraction. The specific retention of a rock is the ratio of (1) the volume of water the rock will retain against the pull of gravity after being saturated to (2) its own volume. Specific retention and specific yield together equal porosity.
The permeability of a rock is its capacity for transmitting water under pressure and is measured by the rate at which the rock will transmit water through a given cross section under a given difference of head per unit of distance. The permeability of the water-bearing materials in Logan County was determined by aquifer tests.
Aquifer Tests
The permeability of water-bearing materials can be determined by laboratory methods (summarized by V. C. Fishel in Wenzel, 1942, p. 56-58) or in the field by discharging-well methods (Wenzel, 1942, p. 94-96).
The transmissibility of the Ogallala formation was determined by aquifer tests using the following recovery formula developed by Theis (1935, p. 522):
T = (264 Q log10 t/t') / s
in which T is the coefficient of transmissibility, in gallons per day through a section of aquifer 1 foot wide having a height equal to the saturated thickness under a unit hydraulic gradient, at the prevailing temperature of the water; Q is the pumping rate, in gallons per minute; t is the time since pumping began, in minutes; t' is the time since pumping stopped, in minutes; and s is the residual drawdown at the pumped well, in feet, at time t'.
From the Theis equation, Cooper and Jacob (1946) developed the following formula:
T = (264 Q / Δs) log10 t2/t1)
in which T is the coefficient of transmissibility in gallons per day per foot; Q is the discharge of the well, in gallons per minute; Δs is the change in drawdown or recovery, in feet, from time t1 to t2, expressed in minutes since pumping began. The coefficient of transmissibility, T, is equal to the field coefficient of permeability, Pf (at the prevailing water temperature) multiplied by the saturated thickness, m, in feet. The laboratory coefficient of permeability is the rate of flow, in gallons a day, through a cross-sectional area of 1 square foot under a hydraulic gradient of 1 foot per foot at a temperature of 60° F. The solution of the formula for T is facilitated by plotting on semilogarithmic paper the drawdown measurements collected from the observation well. The time of measurement is plotted on the logarithmic coordinate and the drawdown on the linear coordinate. The curve theoretically should plot as a straight line for all except extremely small values of t. If
log10 t1/t2)
is taken over one log cycle of t, the value of the logarithm becomes unity and the value of Δs will be the difference in drawdown over one log cycle of t. In determining P from T, adjustment for temperature was unnecessary, as the temperature of the ground water was only slightly less than 60° F. The type-curve solution devised by Theis (Wenzel, 1942, p. 88-89), the Theis recovery formula (1935), and the Cooper-Jacob formula (1946) were used to check the results obtained by the above method, but only the values of T determined by the recovery method are summarized in Table 6.
In the five aquifer tests described below, water levels were measured by an electrical device or a chalked steel tape, and discharge was measured by Collins flow meter. All the wells pumped for the aquifer tests obtain water from the Ogallala formation.
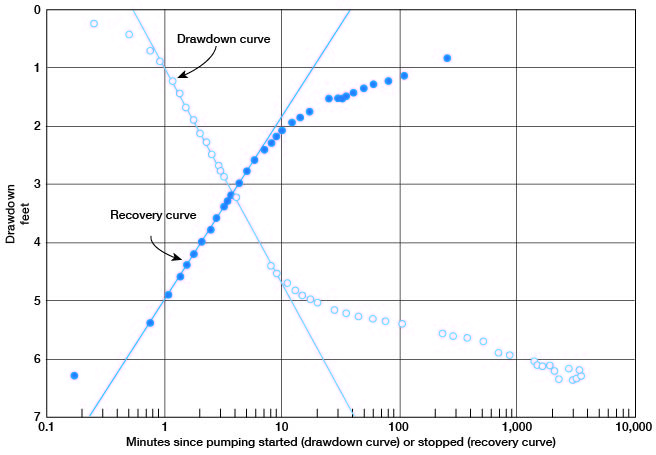
Well 11-32-3bd1, a public-supply well owned by the city of Oakley, was pumped for 41 hours beginning on August 27, 1954. Drawdown and recovery were measured in observation well 11-32-3bd2 installed 180 feet west of the pumped well (Table 2). The specific capacity of the well was about 33 gpm per foot of drawdown. An average pumping rate of 595 gpm was used to compute the coefficients of transmissibility and permeability from the drawdown and recovery graph (Fig. 6).
From the drawdown curve:
T = (264 x 595) / (4.70-1.00) = 42,500 gpd/ft
P = 42,500 / 142 = 300 gpd/sq. ft
From the recovery curve:
T = (264 x 595) / (5.00-1.83) = 49,500 gpd/ft
P = 49,500 / 142 = 350 gpd/sq. ft
In this and other tests, the value for T computed from the drawdown was used as a check of the result obtained from the recovery curve, which is believed to be a closer approximation of T and which is tabulated in Table 6.
Table 2--Data on aquifer test using well 11-32-3bd1, Aug. 27-30, 1954
| Time since pumping started (minutes) |
Time since pumping stopped (minutes) |
Depth to water in observation well (feet) |
Drawdown in observation well (feet) |
Yield of pumped well (gpm) |
|---|---|---|---|---|
| 0 | 103.24 | 0 | ||
| 0.42 | 103.48 | 0.24 | ||
| 0.58 | 103.68 | 0.44 | ||
| 0.75 | 103.95 | 0.71 | ||
| 0.92 | 104.13 | 0.89 | ||
| 1.17 | 104.48 | 1.24 | ||
| 1.33 | 104.68 | 1.44 | ||
| 1.5 | 104.93 | 1.69 | ||
| 1.75 | 105.13 | 1.89 | ||
| 2 | 105.37 | 2.13 | ||
| 2.25 | 105.52 | 2.28 | ||
| 2.5 | 105.72 | 2.48 | ||
| 2.83 | 105.92 | 2.68 | ||
| 3.17 | 106.10 | 2.86 | ||
| 3.5 | 106.27 | 3.02 | ||
| 4 | 106.46 | 3.22 | ||
| 4.5 | 106.63 | 3.39 | ||
| 5.25 | 106.83 | 3.59 | ||
| 6.5 | 107.62 | 4.38 | ||
| 8 | 107.64 | 4.40 | ||
| 9 | 107.76 | 4.52 | ||
| 11 | 107.93 | 4.69 | ||
| 13 | 108.05 | 4.81 | ||
| 15 | 108.14 | 4.90 | 631 | |
| 17 | 108.20 | 4.96 | ||
| 20 | 108.26 | 5.02 | ||
| 28 | 108.39 | 5.15 | ||
| 35 | 108.45 | 5.21 | ||
| 45 | 108.51 | 5.27 | 622 | |
| 60 | 108.55 | 5.31 | ||
| 75 | 108.59 | 5.35 | ||
| 80 | 612 | |||
| 105 | 108.62 | 5.38 | ||
| 233 | 108.79 | 5.55 | 612 | |
| 285 | 108.85 | 5.61 | 607 | |
| 375 | 108.87 | 5.63 | 600 | |
| 510 | 108.94 | 5.70 | 612 | |
| 699 | 109.14 | 5.90 | 603 | |
| 855 | 109.11 | 5.87 | 594 | |
| 1,102 | 108.94 | 5.60 | 563 | |
| 1,335 | 109.13 | 5.89 | ||
| 1,395 | 109.29 | 6.05 | 594 | |
| 1,468 | 109.34 | 6.10 | ||
| 1,515 | 109.31 | 6.07 | ||
| 1,584 | 109.35 | 6.11 | 603 | |
| 1,877 | 109.34 | 6.10 | 578 | |
| 2,057 | 109.44 | 6.20 | 589 | |
| 2,222 | 109.58 | 6.34 | ||
| 2,475 | 109.25 | 6.01 | 580 | |
| 2,768 | 109.40 | 6.16 | 574 | |
| 2,895 | 109.60 | 6.36 | ||
| 2,945 | 596 | |||
| 3,191 | 109.57 | 6.33 | ||
| 3,282 | 109.48 | 6.24 | ||
| 3,402 | 109.44 | 6.20 | 580 | |
| 3,520 | 585 | |||
| 3,524 | 109.53 | 6.29 | ||
| 3,525 | (Pumping stopped) | |||
| 3,525 | 0.17 | 109.53 | 6.29 | 0 |
| 3,525 | 0.75 | 108.62 | 5.38 | |
| 3,526 | 1.08 | 108.12 | 4.88 | |
| 3,526 | 1.33 | 107.82 | 4.58 | |
| 3,526 | 1.53 | 107.62 | 4.38 | |
| 3,526 | 1.75 | 107.42 | 4.18 | |
| 3,527 | 2.08 | 107.22 | 3.98 | |
| 3,527 | 2.42 | 107.02 | 3.78 | |
| 3,527 | 2.75 | 106.82 | 3.58 | |
| 3,528 | 3.17 | 106.62 | 3.38 | |
| 3,528 | 3.42 | 106.52 | 3.28 | |
| 3,528 | 3.67 | 106.42 | 3.18 | |
| 3,529 | 4.25 | 106.22 | 2.98 | |
| 3,530 | 5.00 | 106.02 | 2.78 | |
| 3,530 | 5.83 | 105.82 | 2.58 | |
| 3,532 | 7 | 105.65 | 2.41 | |
| 3,533 | 8 | 105.53 | 2.29 | |
| 3,534 | 9 | 105.42 | 2.18 | |
| 3,535 | 10 | 105.32 | 2.08 | |
| 3,537 | 12 | 105.20 | 1.96 | |
| 3,539 | 14 | 105.11 | 1.87 | |
| 3,542 | 17 | 105.01 | 1.77 | |
| 3,550 | 25 | 104.78 | 1.54 | |
| 3,555 | 30 | 104.78 | 1.54 | |
| 3,557 | 32 | 104.76 | 1.52 | |
| 3,560 | 35 | 104.74 | 1.50 | |
| 3,565 | 40 | 104.68 | 1.44 | |
| 3,575 | 50 | 104.60 | 1.36 | |
| 3,585 | 60 | 104.54 | 1.30 | |
| 3,605 | 80 | 104.48 | 1.24 | |
| 3,635 | 110 | 104.40 | 1.16 | |
| 3,778 | 253 | 104.10 | .86 | |
Fig. 6--Drawdown and recovery of water level in observation well 11-32-3bd2 during aquifer test using public-supply well 11-32-3bd1.
Well 11-33-14bc1, an irrigation well on the James Ahrens farm, was pumped for 89 hours beginning on August 25, 1954. Drawdown was measured in observation well 11-33-14bc2 installed 178 feet south of the pumped well. Recovery was measured in this well for 24 hours after pumping ceased (Table 3). The specific capacity was about 11 gpm per foot of drawdown. An average pumping rate of 440 gpm was used to compute the coefficients of transmissibility and permeability from the drawdown and recovery graph (Fig. 7).
Table 3--Data on aquifer test using well 11-33-14bc1, Aug. 25-29, 1954
| Time since pumping started (minutes) |
Time since pumping stopped (minutes) |
Depth to water in observation well (feet) |
Drawdown in observation well (feet) |
Yield of pumped well (gpm) |
|---|---|---|---|---|
| 0 | 134.54 | 0 | 0 | |
| 1 | 134.54 | 0 | ||
| 2 | 134.54 | 0 | ||
| 3 | 134.56 | 0.02 | ||
| 4 | 134.59 | 0.05 | ||
| 5 | 134.63 | 0.09 | ||
| 6 | 134.68 | 0.14 | ||
| 7 | 134.74 | 0.20 | ||
| 8 | 134.80 | 0.26 | ||
| 9 | 134.86 | 0.32 | ||
| 10 | 134.93 | 0.39 | ||
| 12 | 135.05 | 0.51 | ||
| 14 | 135.16 | 0.62 | ||
| 16 | 135.28 | 0.74 | ||
| 18 | 135.42 | 0.88 | ||
| 20 | 135.53 | 0.99 | ||
| 23 | 135.70 | 1.16 | ||
| 26 | 135.86 | 1.32 | ||
| 32 | 136.12 | 1.58 | ||
| 36 | 136.28 | 1.74 | ||
| 40 | 136.44 | 1.90 | ||
| 45 | 136.65 | 2.11 | ||
| 51 | 136.81 | 2.27 | ||
| 57 | 136.98 | 2.44 | ||
| 63 | 137.13 | 2.59 | ||
| 71 | 137.34 | 2.80 | ||
| 80 | 137.54 | 3.00 | ||
| 190 | 137.73 | 3.19 | ||
| 98 | 137.83 | 3.29 | ||
| 116 | 138.13 | 3.59 | ||
| 120 | 472 | |||
| 136 | 138.44 | 3.90 | 467 | |
| 150 | 4.03 | 472 | ||
| 180 | 138.84 | 4.30 | ||
| 210 | 139.03 | 4.49 | ||
| 230 | 451 | |||
| 270 | 139.30 | 4.76 | ||
| 277 | 139.35 | 4.81 | 452 | |
| 280 | 139.35 | 4.81 | ||
| 300 | 139.40 | 4.86 | ||
| 330 | 139.49 | 4.95 | ||
| 347 | 447 | |||
| 365 | 139.55 | 5.01 | ||
| 390 | 139.60 | 5.06 | ||
| 435 | 421 | |||
| 450 | 139.71 | 5.17 | ||
| 540 | 139.82 | 5.28 | 425 | |
| 610 | 139.90 | 5.36 | 425 | |
| 690 | 139.98 | 5.44 | 425 | |
| 810 | 140.05 | 5.51 | 436 | |
| 930 | 140.09 | 5.55 | 425 | |
| 1,060 | 140.14 | 5.60 | 421 | |
| 1,180 | 140.15 | 5.61 | 425 | |
| 1,253 | 140.18 | 5.64 | 421 | |
| 1,268 | 140.19 | 5.65 | ||
| 1,270 | (Pumping stopped) | |||
| 1,271 | 1 | 140.19 | 5.65 | 0 |
| 1,272 | 2 | 140.19 | 5.65 | |
| 1,273 | 3 | 140.18 | 5.64 | |
| 1,274 | 4 | 140.15 | 5.61 | |
| 1,275 | 5 | 140.12 | 5.58 | |
| 1,276 | 6 | 140.08 | 5.54 | |
| 1,277 | 7 | 140.05 | 5.51 | |
| 1,278 | 8 | 140.02 | 5.48 | |
| 1,279 | 9 | 139.99 | 5.45 | |
| 1,280 | 10 | 139.88 | 5.34 | |
| 1,282 | 12 | 139.88 | 5.34 | |
| 1,284 | 14 | 139.80 | 5.26 | |
| 1,286 | 16 | 139.73 | 5.19 | |
| 1,288 | 18 | 139.64 | 5.10 | |
| 1,290 | 20 | 139.58 | 5.04 | |
| 1,293 | 23 | 139.48 | 4.94 | |
| 1,296 | 26 | 139.40 | 4.86 | |
| 1,300 | 30 | 139.28 | 4.74 | |
| 1,305 | 35 | 139.15 | 4.61 | |
| 1,310 | 40 | 139.05 | 4.51 | |
| 1,316 | 46 | 138.90 | 4.36 | |
| 1,332 | 62 | 138.64 | 4.10 | |
| 1,339 | 69 | 138.53 | 3.99 | |
| 1,348 | 78 | 138.40 | 3.86 | |
| 1,361 | 91 | 138.25 | 3.71 | |
| 1,377 | 107 | 138.07 | 3.53 | |
| 1,392 | 122 | 137.91 | 3.37 | |
| 1,406 | 136 | 137.80 | 3.26 | |
| 1,429 | 159 | 137.62 | 3.08 | |
| 1,471 | 201 | 137.35 | 2.81 | |
| 1,495 | 225 | 137.22 | 2.68 | |
| 1,496 | (Pumping started) | |||
| 3,100 | 140.50 | 5.96 | ||
| 3,520 | 140.38 | 5.84 | ||
| 4,265 | 140.78 | 6.24 | ||
| 4,805 | 140.55 | 6.01 | ||
| 5,334 | 140.78 | 6.24 | ||
Fig. 7--Drawdown and recovery of water level in observation well 11-33-14bc2 during aquifer test using irrigation well 11-33-14bc1.
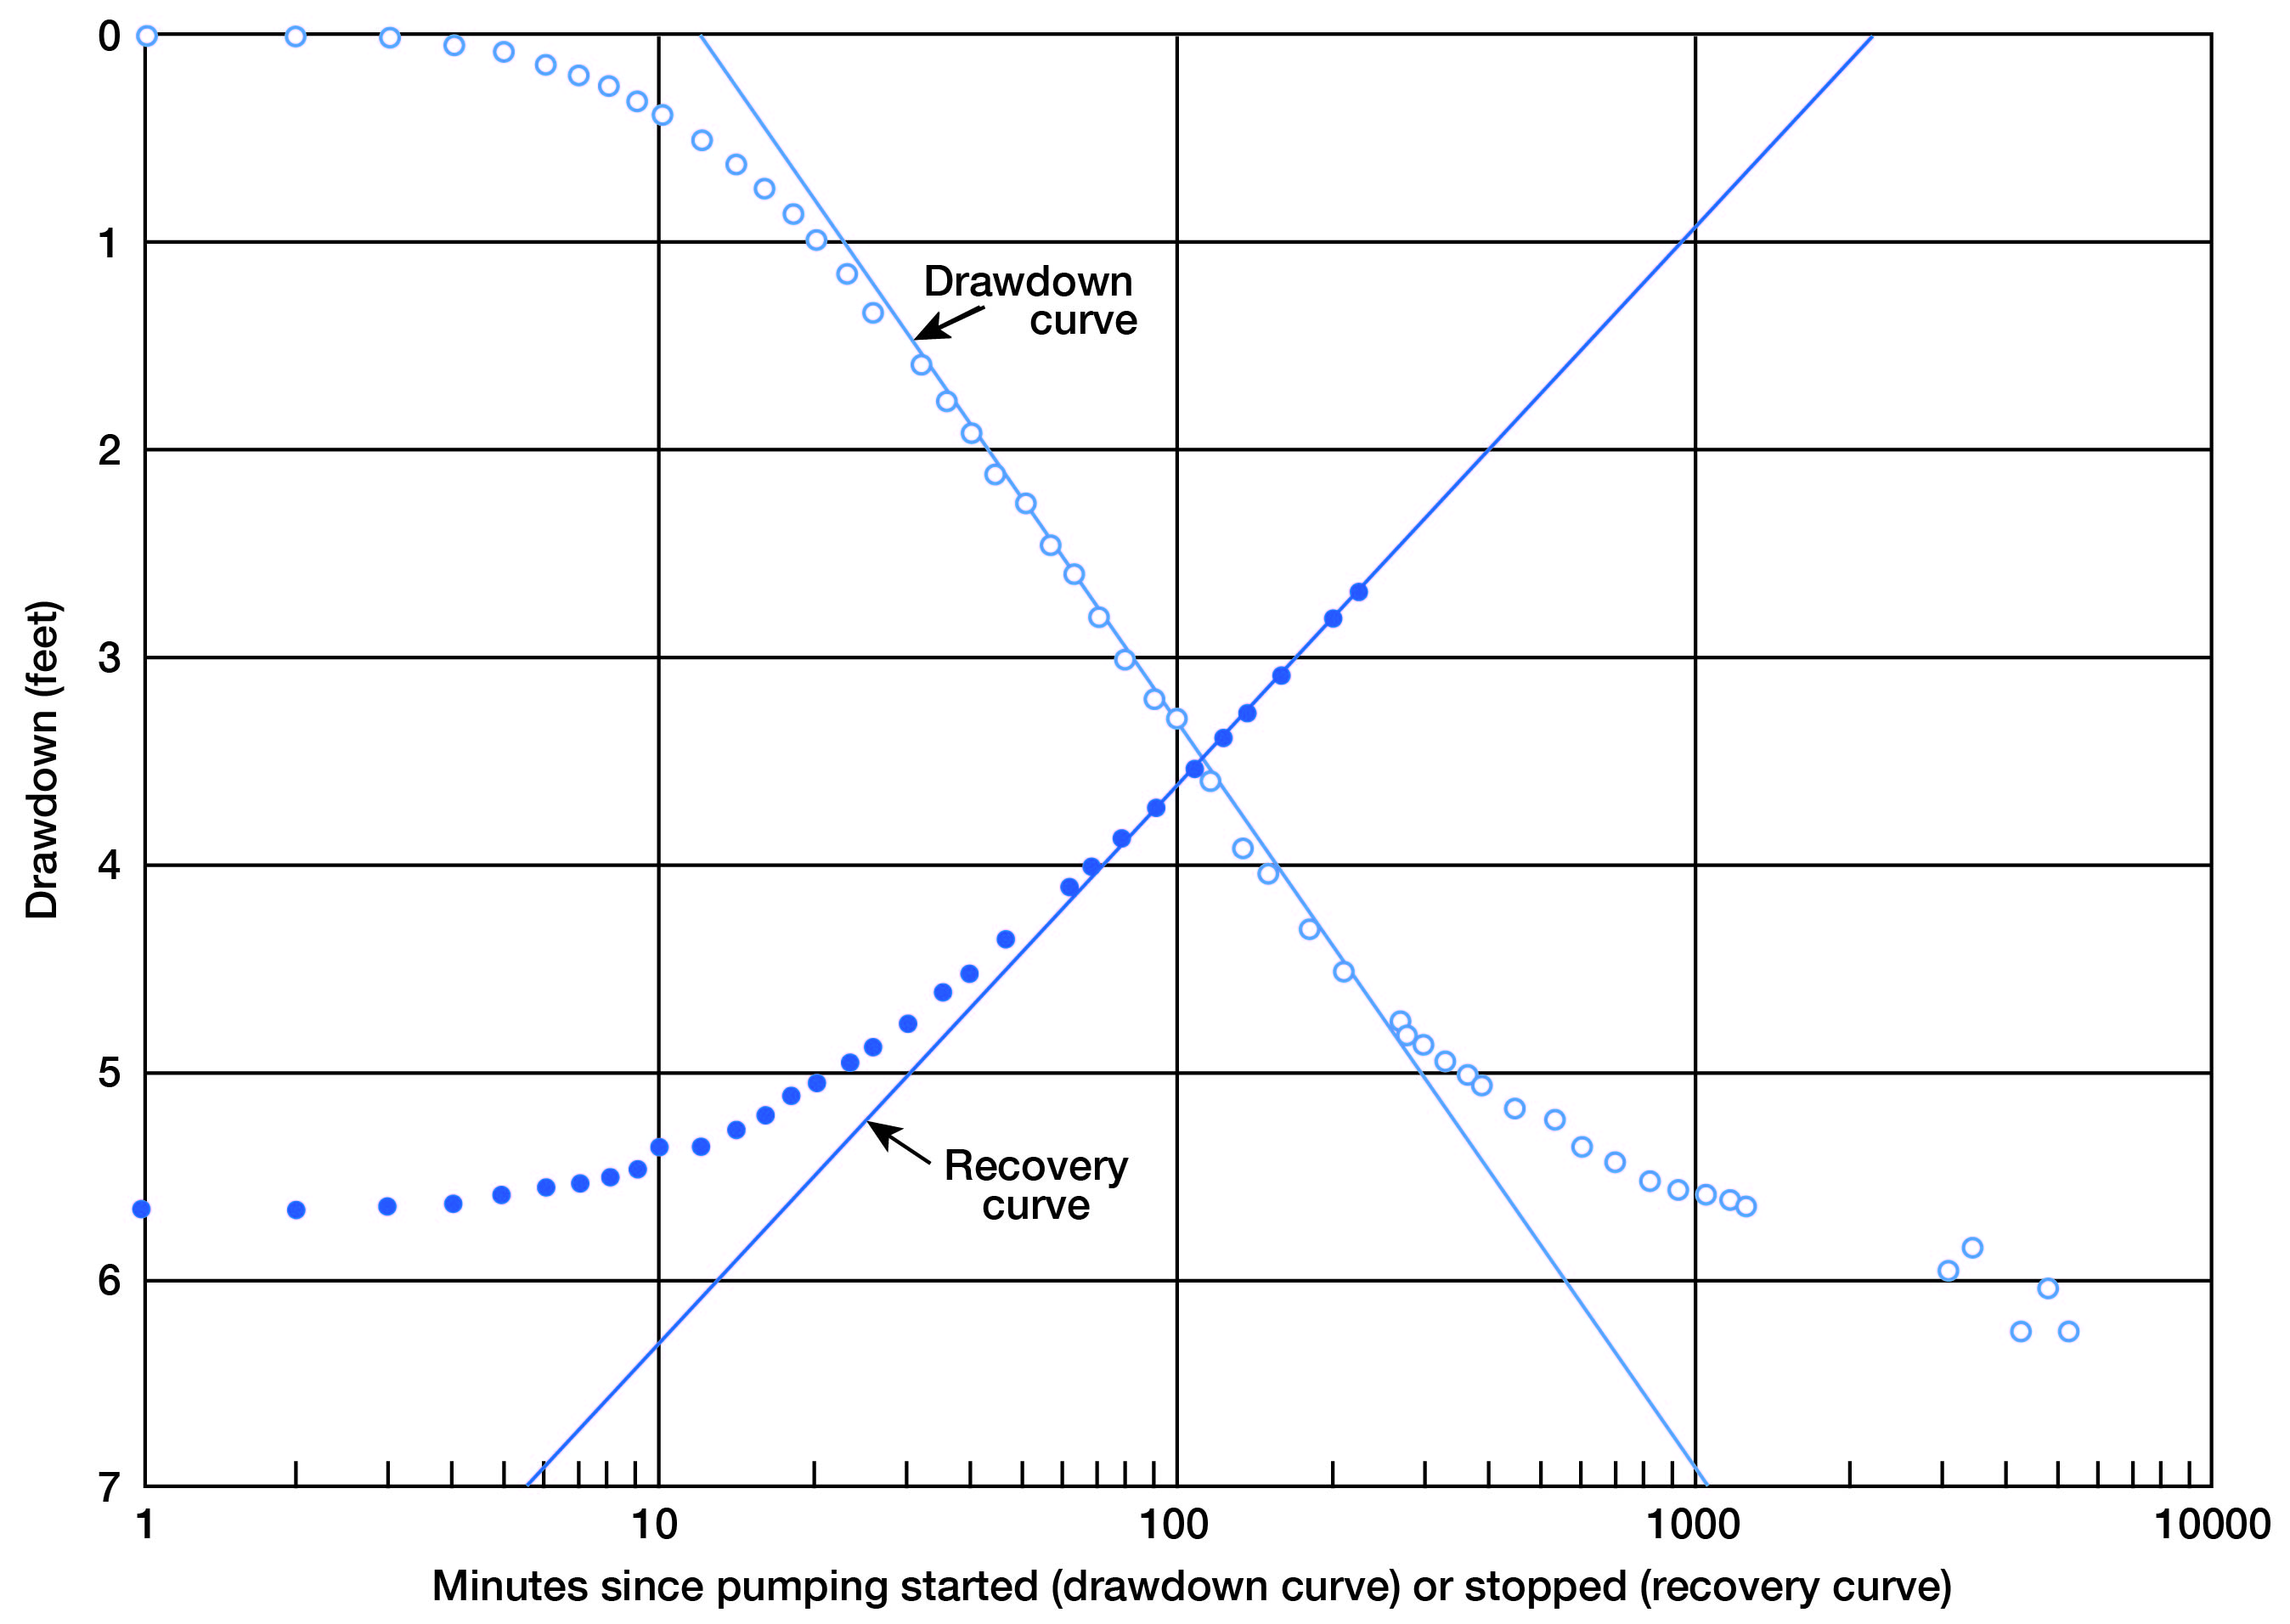
From the drawdown curve:
T = (264 x 440) / (6.90-3.30) = 32,500 gpd/ft
P = 32,500 / 84 = 300 gpd/sq. ft
From the recovery curve:
T = (264 x 440) / (6.30-3.62) = 43,500 gpd/ft
P = 43,500 / 84 = 520 gpd/sq. ft
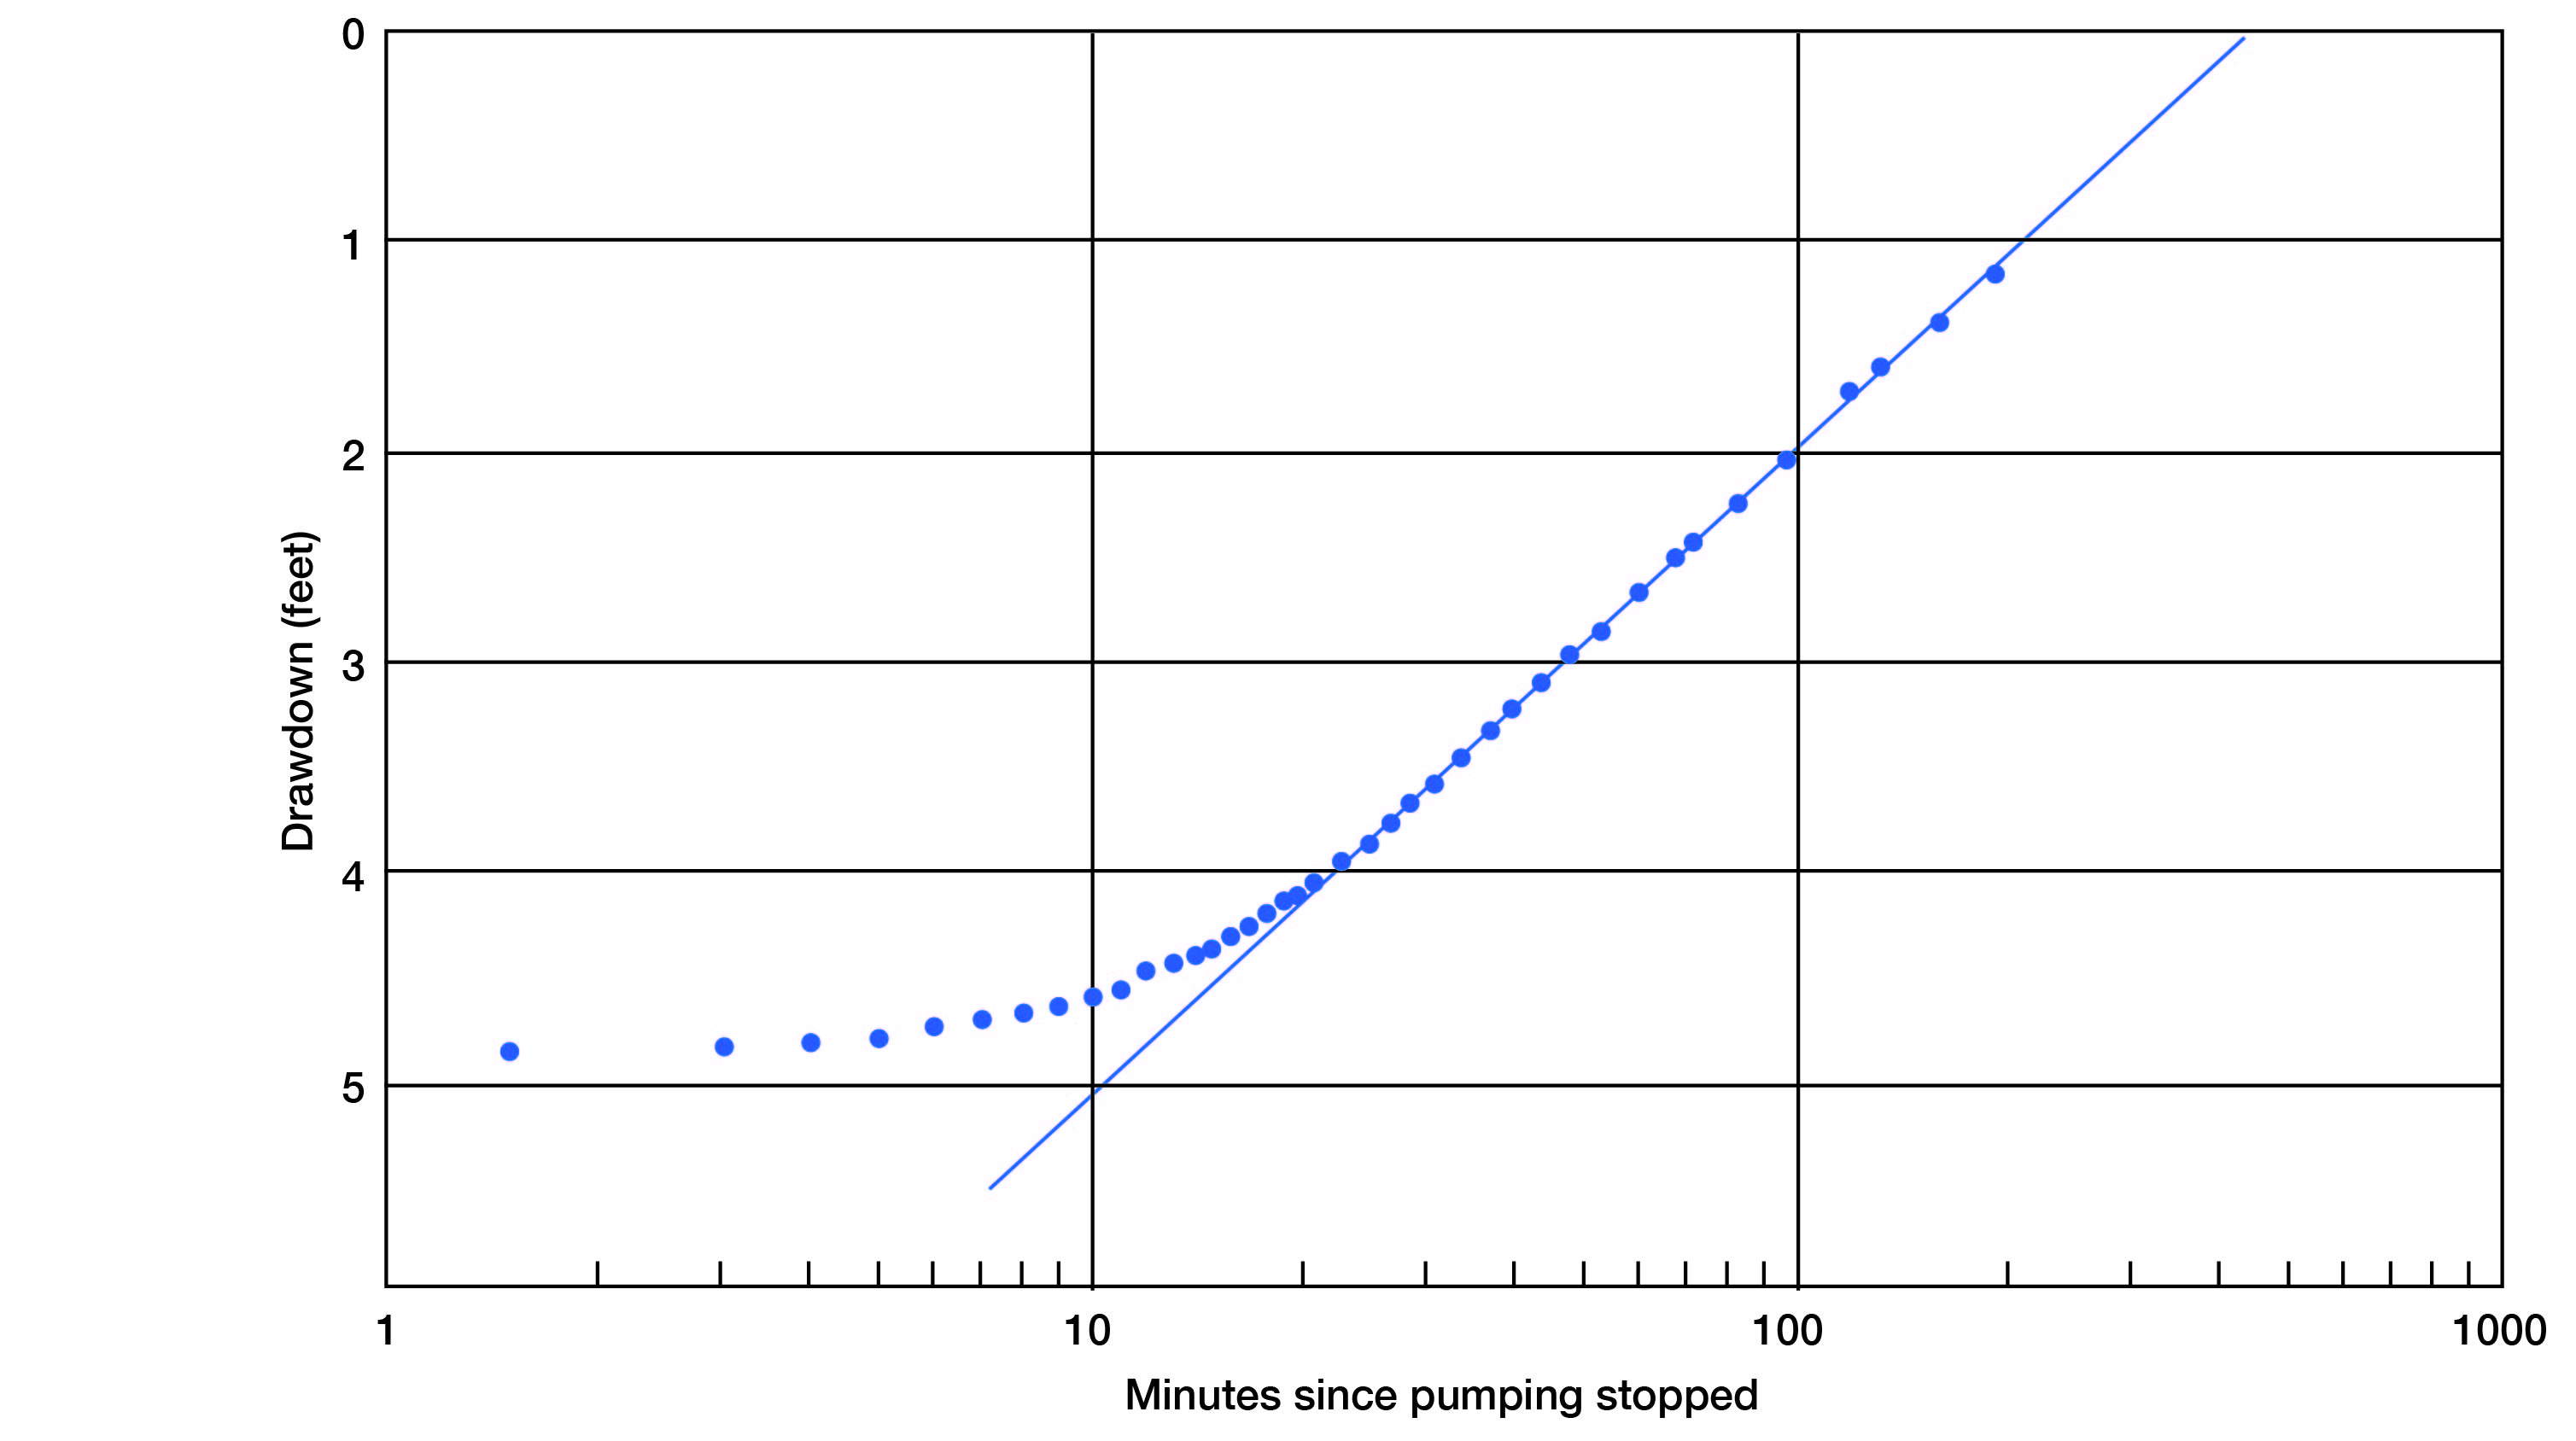
Well 11-34-24ca1, an irrigation well on the farm of Horace Holmes, was pumped 8 hours on August 23, 1954. Drawdown measurements were made in observation well 11-34-24ca2 installed 172 feet north of the pumped well, and recovery measurements were made in this well for 22 hours after pumping ceased (Table 4). The specific capacity was approximately 5 gpm per foot of drawdown, and the pumping rate was 228 gpm.
Table 4--Data on aquifer test using well 11-34-24ca1, Aug. 23-24, 1954
| Time since pumping started (minutes) |
Time since pumping stopped (minutes) |
Depth to water in observation well (feet) |
Drawdown in observation well (feet) |
Yield of pumped well (gpm) |
|---|---|---|---|---|
| 0 | ||||
| 460 | 228 | |||
| 470 | 54.2 | |||
| 475 | 54.21 | |||
| 480 | 54.22 | |||
| 485 | 54.22 | |||
| 493 | 54.23 | |||
| 494.3 | (Pumping stopped) | |||
| 494.8 | 0.5 | 54.24 | 4.83* | 0 |
| 495.8 | 1.5 | 54.24 | 4.83 | |
| 497.3 | 3 | 54.22 | 4.81 | |
| 498.3 | 4 | 54.21 | 4.8 | |
| 499.3 | 5 | 54.18 | 4.77 | |
| 500.3 | 6 | 54.14 | 4.73 | |
| 501.3 | 7 | 54.1 | 4.69 | |
| 502.3 | 8 | 54.06 | 4.65 | |
| 503.3 | 9 | 54.03 | 4.62 | |
| 504.3 | 10 | 53.98 | 4.57 | |
| 505.3 | 11 | 53.94 | 4.53 | |
| 506.3 | 12 | 53.87 | 4.46 | |
| 507.3 | 13 | 53.82 | 4.41 | |
| 508.3 | 14 | 53.78 | 4.37 | |
| 509 | 14.7 | 53.75 | 4.34 | |
| 510 | 15.7 | 53.69 | 4.28 | |
| 511 | 16.7 | 53.64 | 4.23 | |
| 512 | 17.7 | 53.59 | 4.18 | |
| 513 | 18.7 | 53.53 | 4.12 | |
| 514 | 19.7 | 53.49 | 4.08 | |
| 515 | 20.7 | 53.44 | 4.03 | |
| 517 | 22.7 | 53.34 | 3.93 | |
| 519 | 24.7 | 53.25 | 3.84 | |
| 521 | 26.7 | 53.15 | 3.74 | |
| 523 | 28.7 | 53.06 | 3.85 | |
| 525 | 30.7 | 52.97 | 3.56 | |
| 528 | 33.7 | 52.84 | 3.43 | |
| 531 | 36.7 | 52.72 | 3.31 | |
| 534 | 39.7 | 52.62 | 3.21 | |
| 538 | 43.7 | 52.48 | 3.07 | |
| 542 | 47.7 | 52.36 | 2.95 | |
| 547 | 52.7 | 52.24 | 2.83 | |
| 554 | 59.7 | 52.07 | 2.66 | |
| 562 | 67.7 | 51.89 | 2.48 | |
| 566 | 71.7 | 51.82 | 2.41 | |
| 577 | 82.7 | 51.64 | 2.23 | |
| 591 | 96.7 | 51.43 | 2.02 | |
| 615 | 120.7 | 51.1 | 1.69 | |
| 625 | 130.7 | 50.99 | 1.58 | |
| 652 | 157.7 | 50.77 | 1.36 | |
| 685 | 190.7 | 50.55 | 1.14 | |
| 1,794 | 1,299.3 | 49.41 | 0 | |
| *Assumed maximum drawdown. | ||||
The observation well was partly plugged during the pumping period, thus invalidating most of the drawdown measurements, but sufficient valid measurements made prior to the cessation of pumping indicated that the drawdown in the observation well was proceeding at a very low rate.
From the recovery curve of the observation well (Fig. 8):
T = (264 x 228) / (5.07-1.97) = 19,500 gpd/ft
P = 19,500 / 83 = 235 gpd/sq. ft
Fig. 8--Recovery of water level in observation well 11-34-24ca2 during aquifer test using irrigation well 11-34-24ca1.
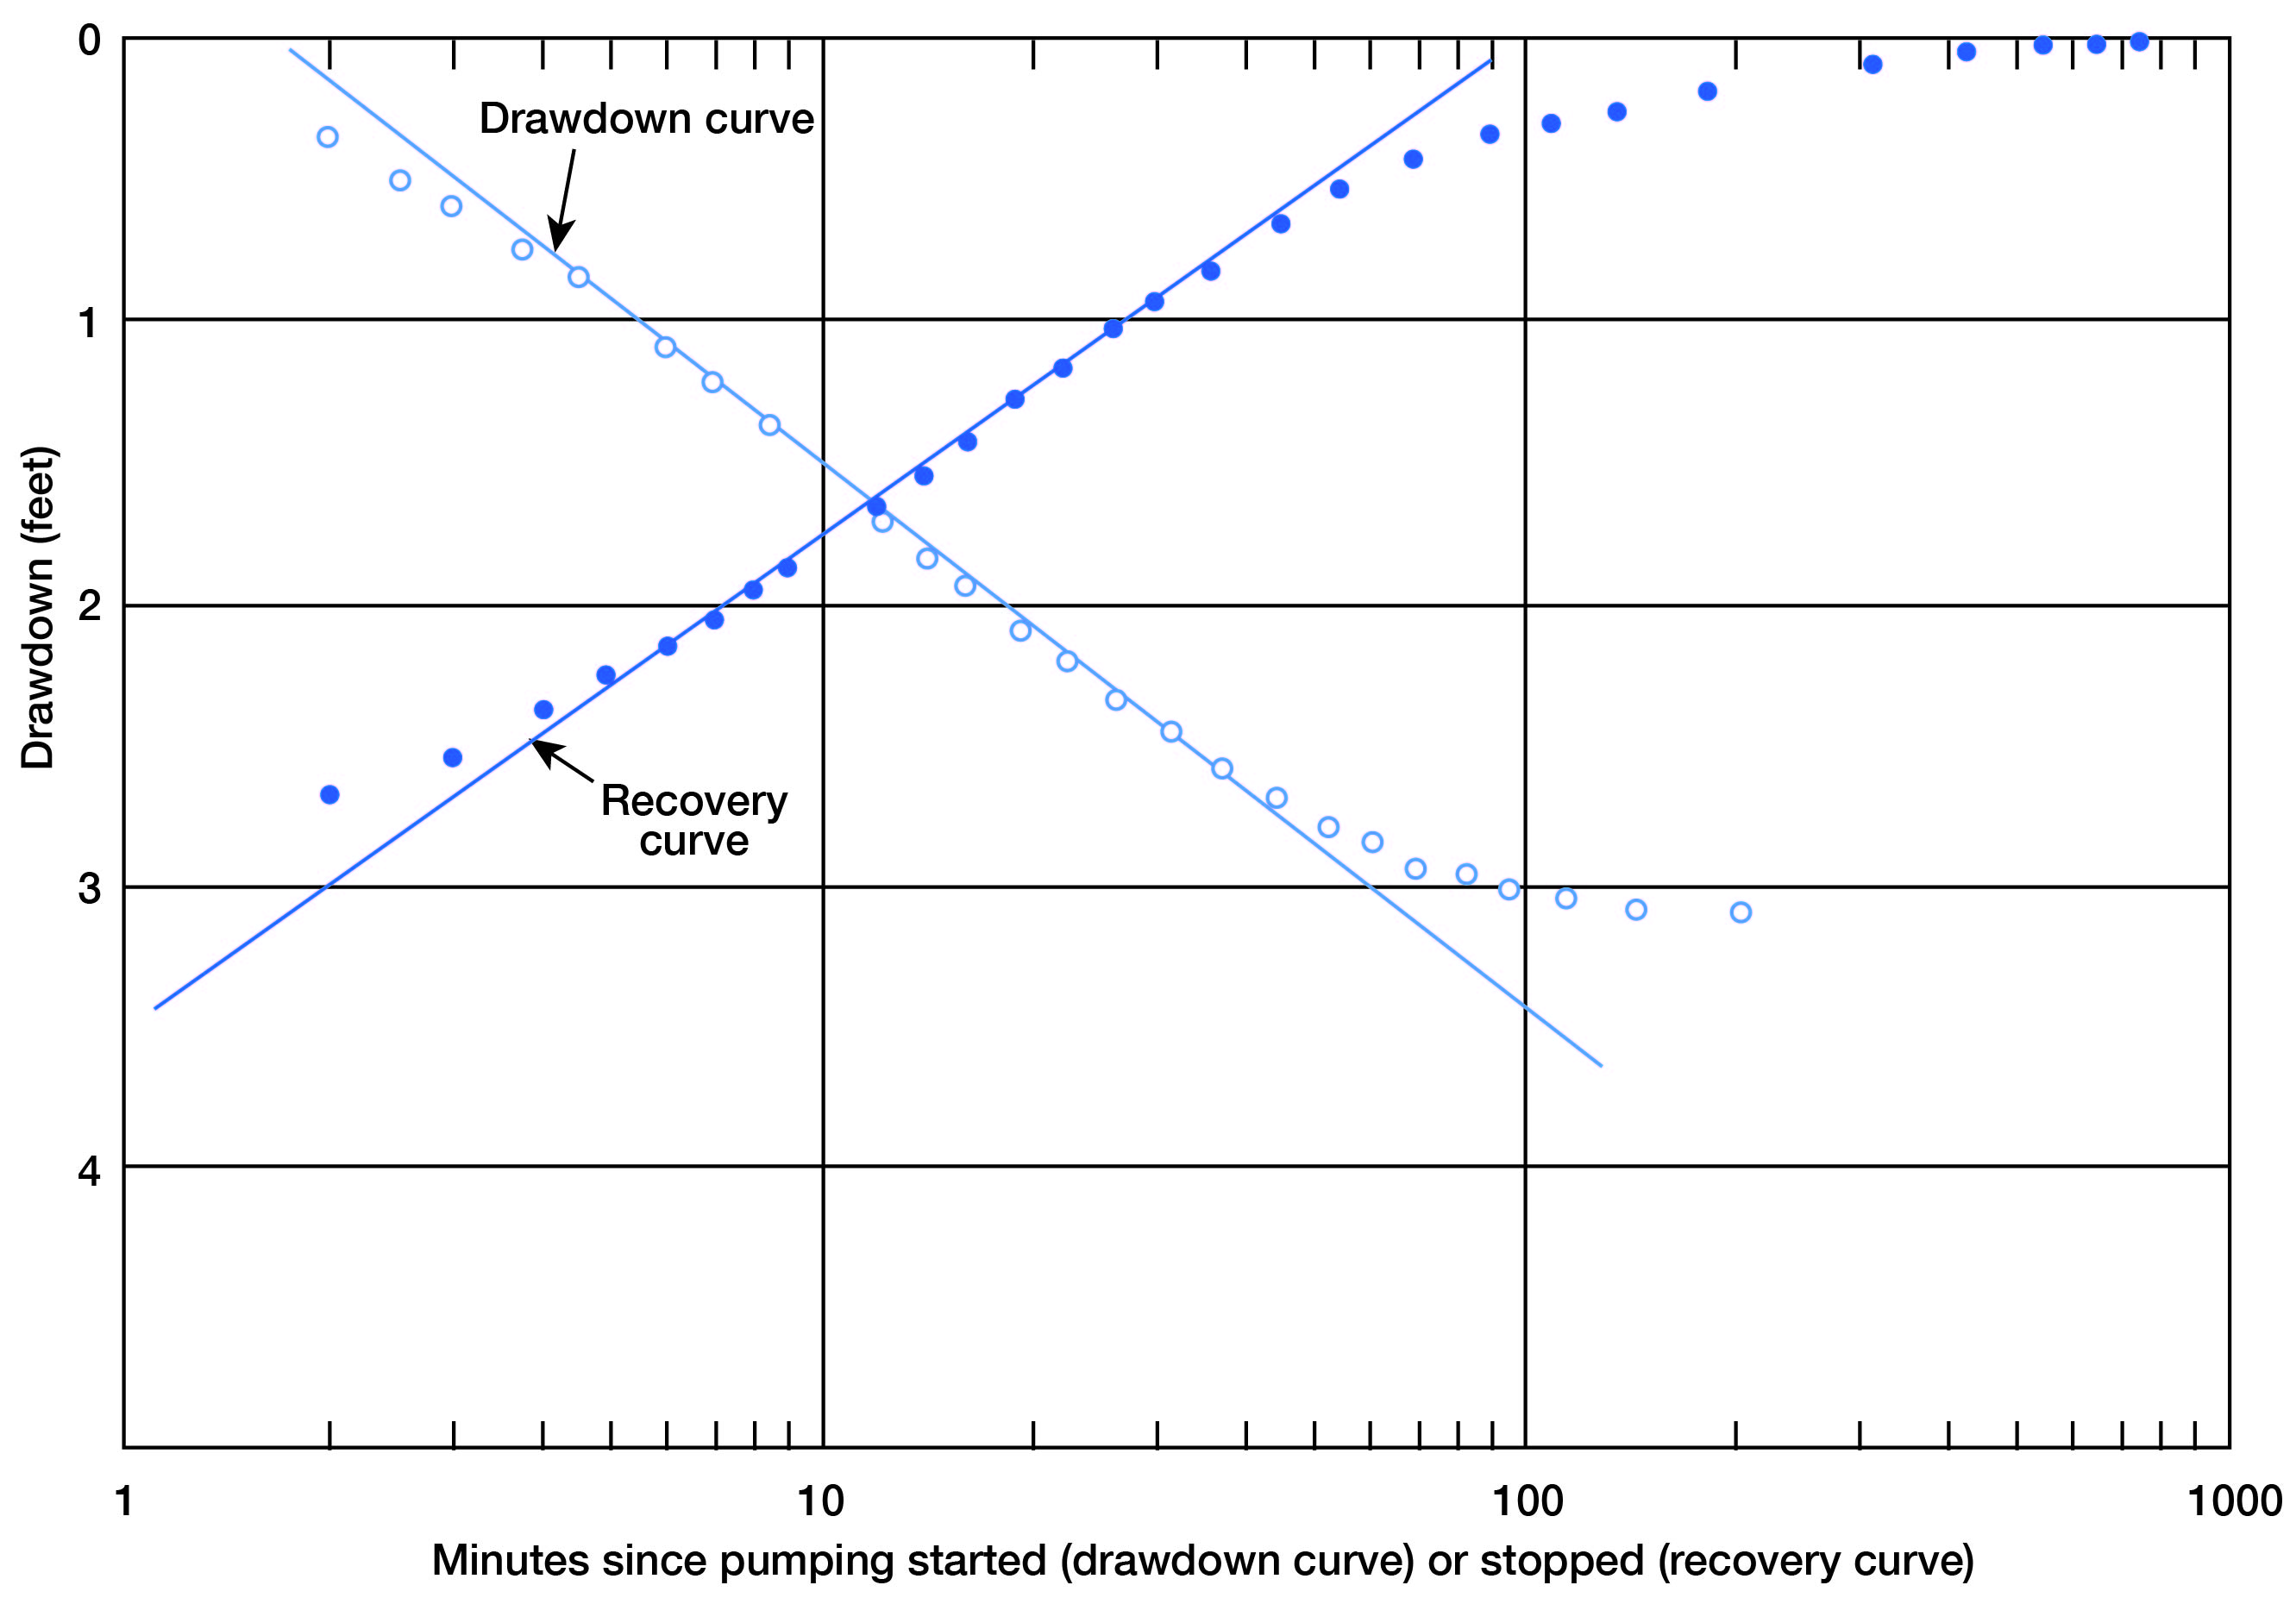
Well 11-35-5bb1, a public-supply well owned by the city of Winona, was pumped for a period of 270 1/2 hours beginning on August 24, 1954. Drawdown and recovery were measured in well 11-35-5bb2, which is 440 feet west of the pumped well (Table 5). The specific capacity was about 22 gpm per foot of drawdown, and the average pumping rate was 310 gpm.
Table 5--Data on aquifer test using well 11-35-5bb1, Aug. 24-Sept. 4, 1954
| Time since pumping started (minutes) |
Time since pumping stopped (minutes) |
Depth to water in observation well (feet) |
Drawdown in observation well (feet) |
Yield of pumped well (gpm) |
|---|---|---|---|---|
| 0 | 173.91 | 0 | ||
| 1 | 174.03 | 0.12 | ||
| 2 | 174.29 | 0.38 | ||
| 2 1/2 | 174.41 | 0.5 | ||
| 3 | 174.51 | 0.6 | ||
| 3 3/4 | 174.65 | 0.74 | ||
| 4 1/2 | 174.78 | 0.87 | ||
| 5 | 174.86 | 0.95 | ||
| 6 | 175.01 | 1.1 | ||
| 7 | 175.13 | 1.22 | ||
| 8 | 175.3 | 1.39 | ||
| 10 | 175.45 | 1.54 | ||
| 12 | 175.61 | 1.7 | ||
| 14 | 175.75 | 1.84 | ||
| 16 | 175.86 | 1.95 | ||
| 19 | 176.01 | 2.1 | ||
| 22 | 176.12 | 2.21 | ||
| 26 | 176.25 | 2.34 | ||
| 31 | 176.38 | 2.47 | 318 | |
| 37 | 176.5 | 2.59 | ||
| 44 | 176.61 | 2.7 | ||
| 52 | 176.71 | 2.8 | ||
| 60 | 176.78 | 2.87 | ||
| 70 | 176.85 | 2.94 | ||
| 82 | 176.9 | 2.99 | 316 | |
| 95 | 176.94 | 3.03 | ||
| 115 | 176.97 | 3.06 | ||
| 145 | 177.01 | 3.1 | 314 | |
| 200 | 177.02 | 3.11 | 312 | |
| 1,430 | 176.65 | 2.74 | ||
| 4,510 | 177.14 | 3.23 | ||
| 5,940 | 177.2 | 3.29 | ||
| 7,335 | 177.16 | 3.25 | ||
| 9,895 | 176.86 | 2.95 | 293 | |
| 9,905 | 176.86 | 2.95 | ||
| 10,305 | 176.94 | 3.03 | 299 | |
| 11,760 | 177.24 | 3.33 | ||
| 13,250 | 177.04 | 3.13 | 311 | |
| 15,980 | 177.2 | 3.29 | 318 | |
| 16,230 | 177.21 | 3.3 | ||
| 16,230 | (Pumping stopped) | |||
| 16,231 | 1 | 176.81 | 2.9 | 0 |
| 16,232 | 2 | 176.59 | 2.68 | |
| 16,233 | 3 | 176.46 | 2.55 | |
| 16,234 | 4 | 176.31 | 2.4 | |
| 16,235 | 5 | 176.18 | 2.27 | |
| 16,236 | 6 | 176.07 | 2.16 | |
| 16,237 | 7 | 175.97 | 2.06 | |
| 16,238 | 8 | 175.86 | 1.95 | |
| 16,239 | 9 | 175.8 | 1.89 | |
| 16,240 | 10 | 175.72 | 1.81 | |
| 16,242 | 12 | 175.58 | 1.67 | |
| 16,244 | 14 | 175.45 | 1.54 | |
| 16,246 | 16 | 175.34 | 1.43 | |
| 16,249 | 19 | 175.2 | 1.29 | |
| 16,252 | 22 | 175.09 | 1.18 | |
| 16,256 | 26 | 174.95 | 1.04 | |
| 16,260 | 30 | 174.85 | 0.94 | |
| 16,266 | 36 | 174.73 | 0.82 | |
| 16,275 | 45 | 174.59 | 0.68 | |
| 16,285 | 55 | 174.48 | 0.57 | |
| 16,300 | 70 | 174.36 | 0.45 | |
| 16,320 | 90 | 174.27 | 0.36 | |
| 16,340 | 110 | 174.23 | 0.32 | |
| 16,365 | 135 | 174.19 | 0.28 | |
| 16,415 | 185 | 174.13 | 0.22 | |
| 16,545 | 315 | 174.04 | 0.13 | |
| 16,655 | 425 | 173.99 | 0.08 | |
| 16,775 | 545 | 173.97 | 0.06 | |
| 16,890 | 660 | 173.96 | 0.05 | |
| 17,010 | 780 | 173.94 | 0.03 | |
| 17,080 | 850 | 173.91 | 0 | |
The drawdown and recovery measurements were plotted against the time (Fig. 9), and the computations for T and P are as follows:
From the drawdown curve:
T = (264 x 310) / (3.45-1.52) = 42,000 gpd/ft
P = 42,000 / 41 = 1,020 gpd/sq. ft
From the recovery curve:
T = (264 x 310) / (3.50-1.77) = 47,000 gpd/ft
P = 47,000 / 41 = 1,150 gpd/sq. ft
Fig. 9--Drawdown and recovery of water level in public-supply well 11-35-5bb2 during aquifer test using public-supply well 11-35-5bb1.
In all the aquifer tests the plotted drawdown approximated the theoretical straight-line plot very soon after pumping started. The water level in the observation wells declined immediately after pumping began, despite the distances of 172 to 440 feet between the observation wells and the pumped wells. This effect suggests that the aquifer is artesian, at least during the early part of the pumping period. A similar artesian effect is shown in the recovery curves during the latter part of the recovery period. After pumping periods ranging from 10 to 200 minutes the slope of the time-drawdown curves decreases and departs from the theoretical straight-line curves. A lessening of the artesian effect present in the early part of the pumping period caused by leakage through the confining bed could have produced this effect. After a long period of pumping, the artesian pressure should disappear and water-table conditions should be established in the vicinity of the well. At this time the time-drawdown curve should again plot as a straight line parallel to the curve representing artesian conditions.
A nearby recharging well or a nearby stream or pond might cause a similar decrease in slope of the time-drawdown curve; however, no such recharging source was near the sites of the aquifer tests. A lateral increase in any direction in the thickness or permeability of the aquifer also could cause such an effect; no specific information on this possibility is available, however.
To predict drawdowns in the aquifer after water-table conditions have been established and to compute the volume of water available from storage, the specific yield of the formation must be known. It was not feasible to pump the wells a sufficient length of time to obtain the data necessary for the computation of the specific yield.
The results of the aquifer tests are given in Table 6. Because under the conditions of these tests the values of T and P computed from the recovery data are likely to be nearer the true value, these will be used in this report in preference to those computed from the drawdown data.
Table 6--Results of aquifer tests.
| Pumped well | 11-32-3bd1 | 11-33-14bc1 | 11-34-24ca1 | 11-35-5bb1 |
|---|---|---|---|---|
| Average discharge, gpm | 595 | 440 | 228 | 310 |
| Drawdown, ft | 18 | 40 | 40 | 14 |
| Duration of pumping, minutes | 2,475 | 5,334 | 494.3 | 16,230 |
| Specific capacity, gpm/ft | 33 | 11 | 5 | 22 |
| Saturated thickness, ft | 142 | 84 | 83 | 41 |
| Observation well | 11-32-3bd2 | 11-33-14bc2 | 11-34-24ca2 | 11-35-5bb2 |
| Drawdown, ft | 6.34 | 6.24 | 4.83 | 3.79 |
| Distance from pumped well, ft | 180 | 178 | 172 | 440 |
| Following are computed from the recovery curve. | ||||
| Coefficient of transmissibility, gpd/ft | 49,500 | 43,500 | 19,500 | 47,000 |
| Coefficient of permeability, gpd/sq. ft | 350 | 520 | 230 | 1,150 |
Prev Page--Formations || Next Page--Movement of Ground Water
Kansas Geological Survey, Geology
Placed on web Dec. 14, 2007; originally published May, 1958.
Comments to webadmin@kgs.ku.edu
The URL for this page is http://www.kgs.ku.edu/General/Geology/Logan/06_gw.html