![]()
Prev Page--Structure || Next Page--Mineral Resources
Ground-water Resources
Principles of Occurrence
The following discussion of the fundamental principles involved in the study of ground water is based mostly on the definitive works of Meinzer (1923a, 1923b). Moore (1940) discussed the general occurrence of ground water in Kansas.
The primary source of water, as far as a land area is concerned, is precipitation. Of the precipitation on a given area, part runs off directly in streams, part evaporates, part is returned to the atmosphere by plants (transpiration), and part sinks through openings in the soil and underlying rocks to become subsurface water. The sediments and rocks making up the outer crust of the earth generally contain many openings called voids or interstices. The property of having voids or interstices is called porosity. The size, shape, and number of voids depend upon the lithologic character of the rocks, and the presence of ground water in any region is determined, in part, by the lithology and structure of the rocks. Rocks having communicating voids that permit fluid to move through them perceptibly under the pressure ordinarily found in subsurface water are said to be permeable.
Water percolating from the surface into the soil and rocks is drawn downward by gravity and capillarity. Some of this water moves downward to the point where all the voids in the soil or rock are filled with water under hydrostatic pressure. It has reached the zone of saturation. Water in the zone of saturation is called ground water, and the upper surface of this zone is the water table. Wells are able to derive water only from the zone of saturation.
The interval between the water table and the land surface is called the zone of aeration and, although not saturated, will contain water held temporarily to the walls of open spaces by molecular attraction or surface tension. The zone of aeration is divided into three parts: the belt of soil water, the intermediate belt, and the capillary fringe. The belt of soil water is that part, directly below the land surface, from which water is discharged into the atmosphere by plants or by direct evaporation. This belt is very important to agriculture as it contains the water available for plant growth. The intermediate belt has open spaces usually filled with air and water and may at times contain appreciable amounts of water moving downward to the water table. The capillary fringe lies directly above the water table and contains water drawn up by capillary action from the zone of saturation and water in transit downward to the water table. In general, the thickness of the capillary fringe varies inversely with the size of the voids, thus being greatest in fine-grained material having small pores. Both the belt of soil water and the capillary fringe are limited in thickness by local conditions, such as the character of vegetation and texture of rock or soil, but the intermediate belt is not thus limited and may be absent or may be several hundred feet thick.
Water in the zone of saturation that is available to wells may be unconfined or confined. Unconfined or free ground water does not have a confining or impermeable layer restricting its upper surface. Ground water is confined when it occurs in permeable zones between relatively impermeable layers that restrict the water under pressure. Confined ground water is necessary for wells to be artesian. Water, entering the water-bearing zone at the intake area, percolates downdip and accumulates. As water continues to accumulate in the aquifer, it is placed under pressure by the weight of the water accumulating farther updip. This pressure is called hydrostatic pressure. When an aquifer under hydrostatic pressure is penetrated by a well, water will rise in the well to a height determined by the magnitude of the hydrostatic pressure. The imaginary surface connecting this level in artesian wells is called the piezometric surface. For an artesian well to flow, the piezometric surface must be at an altitude higher than the land surface at the well site.
The Water Table
The water table is defined as the upper surface of the zone of saturation in a porous rock (Meinzer, 1923b). Where the upper surface of the zone of saturation is intersected by an impermeable rock, the water table is interrupted and artesian conditions exist. If an aquifer lies above an impermeable bed, the water contained in the aquifer may be perched, and the upper surface of the perched aquifer is called a perched water table.
The water table is not a plane surface, but is generally a sloping surface that has irregularities caused by differences in permeability of water-bearing materials, by unequal additions or withdrawals from the aquifer, and by topographic features. The water table is not stationary, but fluctuates in response to additions of water to, or withdrawals of water from, storage. Plate 1 shows the location of wells, springs, and test holes in Ellsworth County in which measurements were made of the depth to water, the altitude of the water surface with respect to sea level, and contours of the water table. Data concerning these wells are given in table 6. On plate 1 the water table is shown in the valleys and upland areas. Locally in the uplands the water may be confined, and water will rise above the aquifer in a drill hole. In these localities the contours represent a piezometric surface of an artesian aquifer rather than a water table. In the upland areas very shallow wells generally were not used in drawing the water-table contours, because in many of these wells the water appears to be perched above the principal aquifer. In southwestern Ellsworth County, in an area of about 36 square miles, water contained in Pleistocene deposits is perched as much as 100 feet above the water table in the Dakota Formation. The base of the perched aquifer and the surface of the Dakota aquifer converge southeastward, and the two aquifers merge into a single water-table aquifer.
The contours on plate 1 show the shape and slope of the water table in Ellsworth County. Each point on the water table on a given contour is at the same altitude, and the water moves downslope in a direction at right angles to the contour at any given point. The rate of ground-water movement is controlled by the geology. The Dakota Formation is composed of much finer-grained materials than the Pleistocene alluvial deposits in the valley and, therefore, has a lower permeability. Movement of water through the finer material is slower than through the coarser material, and steeper slopes or a higher head are required to move the same quantity of water through the finer upland deposits. The water-table contours on plate 1 are generally more closely spaced in the upland areas than in the valley areas because the water table generally reflects the surface topography as well as the permeability of the aquifer. In the valleys of the major streams, the contours are more widely spaced and uniform than in the upland. This is a reflection of the more gentle slopes of the topography in the valley areas as well as an indication of greater permeability. The ground-water divides roughly coincide with the topographic divides in Ellsworth County, although the ground-water divide in the southwestern part of the county appears to be somewhat south of the topographic divide.
Recharge and Discharge
Recharge is the addition of water to the groundwater reservoir and may occur in several ways; however, the original source of all recharge is precipitation. In Ellsworth County the principal source of recharge is by direct infiltration and percolation of precipitation to the zone of saturation. Some recharge occurs through infiltration of water from streams and by subsurface inflow from adjacent areas.
Water upon reaching the zone of saturation, continues moving down the slope of the water table toward a point of discharge. Ground-water movement in most of the county is toward the Smoky Hill River valley, but some water in the southwestern part of the county moves toward the Arkansas River drainage, and in the northern part of the county water moves toward the Saline River. Water may be discharged from an aquifer by evaporation, transpiration, seeps, springs, wells, and subsurface outflow. In Ellsworth County water is discharged by all these methods although some are much more important than others. Over a period of several years in which the average climatic conditions are about equal to long-term normal conditions, recharge is about equal to discharge, unless outside influences such as heavy pumping create an imbalance. In Ellsworth County only minor fluctuations of the water table are known to have occurred in the past, indicating that the quantity of water in storage has remained about the same.
Long-term mean annual precipitation in Ellsworth County is about 26 inches. This amounts to about 1 million acre-feet of precipitation a year in the county. About 2 inches of the precipitation, or 70,000 acre-feet, leaves the county as runoff. Of the remaining 24 inches of precipitation, most of the water is evaporated and transpired from the surface or the zone of soil water, but a part percolates down to the zone of saturation to become recharge. Probably about 10,000 acre-feet of water per year is pumped from storage, and because storage remains nearly constant, this water, about 0.3 inch of the annual precipitation, represents recharge. Seeps and springs, which discharge water from storage throughout the year, probably represent 3 to 4 inches or more of recharge although most of this water is lost by transpiration and evaporation a short distance from the point of discharge.
Subsurface inflow of ground water from the west into Ellsworth County probably is slightly greater than the subsurface outflow to the east, but more water is discharged through springs and seeps in the eastern part of the county.
Quality of Water
Water, as it is precipitated and as it percolates through the sediments and rocks, takes into solution various gases and mineral salts. The amount of these impurities can be very important in the consideration of ground water for a specific use. The kind and amount of impurities in ground water can be determined by quantitative chemical analyses. The chemical character of ground water in Ellsworth County is indicated by analyses of 29 samples of water (table 3). Figure 24 shows the chemical character of the sampled water and the location of the sampled wells. These analyses show only the dissolved-mineral content and do not indicate whether the water meets sanitary requirements.
Figure 24--Bar graphs showing chemical character of ground water. A larger version of this figure is available.
Table 3--Chemical analyses of water from selected wells and one spring.1 [Dissolved constituents and hardness in milligrams per liter.]
| Well number |
Sample number (figs. 25-26) |
Depth, in feet |
Geologic source2 |
Date of collection |
Temp. (°F) |
Dissolved solids (evaporated at 180° C) |
Silica (SiO2) |
Total iron (Fe) |
Manganese (Mn) |
Calcium (Ca) |
Magnesium (Mg) |
Sodium and Potassium (Na+K) |
Bicar- bonate (HCO3) |
Sulfate (SO4) |
Chloride (Cl) |
Fluoride (F) |
Nitrate3 (NO3) |
Hardness as CaCO3 |
Specific conductance (micromhos at 25° C) |
pH | |
|---|---|---|---|---|---|---|---|---|---|---|---|---|---|---|---|---|---|---|---|---|---|
| Total | Noncar- conate |
||||||||||||||||||||
| 14-6W-7aaa | 1 | 18 | Terrace Dep | 11-21-1961 | 53 | 1,350 | 17 | 0.19 | .00 | 318 | 40 | 61 | 388 | 680 | 45 | 0.6 | 1.5 | 958 | 640 | 1,910 | |
| 14-6W-26adc | 2 | 99 | Dakota Fm | 11-21-1961 | 55 | 468 | 7.5 | 2.3 | .03 | 38 | 14 | 112 | 222 | 138 | 46 | 1.4 | 1.5 | 152 | 0 | 840 | |
| 14-7W-26dcc | 3 | 106 | Dakota Fm | 11-17-1961 | 53 | 129 | 16 | .11 | .00 | 29 | 4.3 | 8.1 | 102 | 5.8 | 9.0 | .2 | 6.2 | 90 | 6 | 220 | |
| 14-8W-8cbb | 4 | 21 | Greenhorn Ls | 11-20-1961 | 53 | 983 | 13 | .07 | .00 | 195 | 19 | 109 | 300 | 122 | 204 | .4 | 173 | 564 | 318 | 1,800 | |
| 14-8W-28cbd | 5 | 74 | Dakota Fm | 11-20-1961 | 57 | 363 | 17 | 1.6 | .00 | 106 | 7.7 | 14 | 300 | 37 | 25 | .2 | 8.9 | 296 | 50 | 640 | |
| 14-9W-28ccd | 6 | 51 | Sappa Fm, Grand Island Fm | 11-18-1961 | 56 | 328 | 25 | .17 | .00 | 100 | 5.5 | 12 | 324 | 4.1 | 19 | .1 | 2.7 | 272 | 6 | 600 | |
| 14-9W-34adb | 7 | 63 | Dakota Fm | 11-18-1961 | 57 | 364 | 19 | .56 | .00 | 102 | 8.2 | 18 | 305 | 21 | 29 | .2 | 17 | 288 | 38 | 670 | |
| 14-10W-9ddc | 8 | 88 | Dakota Fm | 11-16-1961 | 57 | 1,590 | 13 | 3.5 | .67 | 389 | 56 | 39 | 356 | 802 | 111 | 1.2 | .4 | 1,200 | 908 | 2,230 | |
| 14-10W-20cda1 | 9 | 25 | Grand Island Fm, Sappa Fm | 10-10-1956 | 775 | 22 | .10 | .00 | 156 | 12 | 90 | 356 | 119 | 96 | .2 | 102 | 438 | 146 | 7.3 | ||
| 15-6W-14cda | 10 | 49 | Kiowa Fm | 11-20-1961 | 57 | 421 | 15 | .14 | .11 | 77 | 23 | 38 | 268 | 116 | 18 | .5 | 1.5 | 286 | 66 | 730 | |
| 15-6W-35aaa | 11 | Spring | Dakota Fm | 11-20-1961 | 55 | 126 | 15 | .01 | .00 | 26 | 3.7 | 11 | 90 | 8.2 | 11 | .2 | 6.2 | 80 | 6 | 230 | |
| 15-7W-22ccd | 12 | 28 | Terrace Dep | 11-20-1961 | 56 | 200 | 25 | .18 | .28 | 35 | 7.9 | 20 | 140 | 30 | 11 | .3 | 1.5 | 120 | 5 | 340 | |
| 15-8W-19bad2 | 13 | 50 | Terrace Dep | 4-9-1956 | 649 | 27 | 1.0 | .35 | 119 | 15 | 91 | 357 | 109 | 102 | .5 | 6.2 | 358 | 65 | 7.2 | ||
| 15-8W-25dca | 14 | 40 | Grand Island Fm | 5-2-1960 | 412 | 16 | .03 | .00 | 101 | 10 | 19 | 195 | 59 | 36 | .2 | 75 | 293 | 138 | 690 | ||
| 15-8W-34caa | 15 | 60 | Dakota Fm | 11-20-1961 | 57 | 297 | 6.0 | 7.3 | .17 | 49 | 10 | 48 | 212 | 54 | 25 | .3 | .4 | 163 | 0 | 540 | |
| 15-9W-24ddd | 16 | 18 | Terrace Dep | 11-21-1961 | 58 | 306 | 5.5 | 22 | .22 | 52 | 15 | 48 | 283 | 1.6 | 44 | .1 | .4 | 191 | 0 | 590 | |
| 15-10W-36ccb | 17 | 152 | Dakota Fm | 11-16-1961 | 56 | 2,450 | 8.0 | 2.6 | .14 | 144 | 55 | 714 | 373 | 171 | 1,170 | .8 | 2.2 | 585 | 279 | 4,840 | |
| 16-8W-10daa | 18 | 90 | Kiowa Fm | 11-18-1961 | 56 | 1,610 | 9.0 | .79 | .08 | 146 | 49 | 376 | 307 | 284 | 590 | 1.0 | 1.9 | 566 | 314 | 3,050 | |
| 16-9W-19ccd | 19 | 57 | Pleistocene Ser | 11-21-1961 | 56 | 648 | 5.5 | 3.0 | .09 | 98 | 16 | 114 | 202 | 140 | 174 | .4 | .4 | 310 | 144 | 1,220 | |
| 16-10W-26ccc1 | 20 | 111 | Dakota Fm | 11-21-1961 | 56 | 362 | 21 | 168 | .34 | 96 | 11 | 22 | 317 | 15 | 40 | .2 | .4 | 284 | 24 | 660 | |
| 17-7W-10cca | 21 | 65 | Dakota Fm | 11-20-1961 | 395 | 14 | .06 | .00 | 69 | 14 | 53 | 244 | 74 | 42 | .5 | 8.9 | 230 | 30 | 720 | ||
| 17-8W-4add | 22 | 59 | Dakota Fm | 11-18-1961 | 57 | 350 | 9.0 | 2.1 | .11 | 70 | 15 | 44 | 310 | 18 | 40 | .6 | .4 | 236 | 0 | 650 | |
| 17-8W-7cba | 23 | 6 | Colluvium | 11-18-1961 | 53 | 272 | 3.0 | .42 | .02 | 75 | 14 | 12 | 288 | 2.1 | 19 | .4 | 4.2 | 244 | 8 | 510 | |
| 17-8W-25ccc1 | 24 | 95 | Dakota Fm | 5-8-1961 | 318 | 16 | .01 | .00 | 73 | 12 | 28 | 264 | 18 | 39 | .4 | 1.8 | 232 | 16 | 580 | 7.4 | |
| 17-9W-13abb | 25 | 112 | Dakota Fm | 11-16-1961 | 51 | 341 | 9.0 | 11 | .21 | 72 | 19 | 33 | 334 | 20 | 22 | .7 | .4 | 258 | 0 | 610 | |
| 17-9W-16dab | 26 | 210 | Dakota Fm | 4-24-1961 | 372 | 23 | .55 | .12 | 84 | 15 | 32 | 322 | 18 | 40 | .4 | 1.1 | 271 | 7 | 680 | 7.6 | |
| 17-10W-10dbd2 | 27 | 190 | Dakota Fm | 3-23-1961 | 419 | 20 | .01 | .00 | 90 | 13 | 47 | 342 | 35 | 42 | .4 | 3.2 | 278 | 0 | 770 | 7.5 | |
| 17-10W-27aac | 28 | 84 | Dakota Fm | 11-16-1961 | 57 | 353 | 14 | .80 | .00 | 73 | 15 | 40 | 310 | 16 | 41 | .4 | 1.5 | 244 | 0 | 650 | |
| 17-10W-33ccd | 29 | 36 | Pleistocene Ser | 11-21-1961 | 55 | 637 | 22 | .48 | .00 | 176 | 11 | 21 | 346 | 22 | 82 | .1 | 133 | 484 | 200 | 1,140 | |
| 1. Samples analyzed by Kansas State Department of Health. 2. Dep, deposits; Fm, Formation; Ls, Limestone; Ser, Series. 3. In areas where the nitrate content of water is known to exceed 45 mg/l, the public should be warned of the potential dangers of using the water for infant feeding (U.S. Public Health Service, 1962, p. 7). |
|||||||||||||||||||||
The chemical analysis of a water may be expressed in milligrams per liter (mg/l) or milliequivalents per liter (me/l). In an analysis expressed in milliequivalents per liter, unit concentrations of all ions are chemically equivalent. To convert milligrams per liter to milliequivalents per liter, the values for concentration of mineral constituents should be multiplied by the factors in table 4 (Hem, 1970).
Table 4--Factors for converting milligrams per liter of mineral constituents to milliequivalents per liter.
| Mineral constituents |
Chemical symbol |
Conversion factor |
|---|---|---|
| Cations | ||
| Calcium | Ca++ | 0.04990 |
| Magnesium | Mg++ | 0.08226 |
| Sodium | Na+ | 0.04350 |
| Potassium | K+ | 0.02557 |
| Anions | ||
| Carbonate | CO3-- | 0.03333 |
| Bicarbonate | HCO3- | 0.01639 |
| Sulfate | SO4-- | 0.02082 |
| Chloride | Cl- | 0.02821 |
| Fluoride | F- | 0.05264 |
| Nitrate | NO3- | 0.01613 |
Chemical analyses presented in graphic form may, in many cases, be more easily interpreted than analyses presented in tabular form. Many graphic methods of presentation and study of water analyses have been used. Graphic methods should not be considered a universal explanation for all problems related to water quality but should be used as tools, along with all other methods related to the interpretation of water quality, in the study of such problems.
Figure 24 shows in graphic form the chemical character of water and the location of the wells listed in table 3. Expressing the analyses in this manner is a convenient way to visually compare the analyses of several different waters. The lower end of the line marking the center of each bar graph is at the point corresponding to the location of the well. Vertical scales of each bar graph are the same, and the constituents are plotted in the order shown in the explanation.
A graphic method of interpreting water analyses suggested by Stiff (1951) utilizes four horizontal axes and one vertical axis. The principal cations are plotted, one along each axis to the left of the vertical axis, and the principal anions are plotted in a similar manner to the right of the vertical axis. Ionic concentrations are expressed in milliequivalents per liter. When the plotted points are connected, a figure or pattern that is characteristic of a given type of water is obtained.
Figure 25 shows the patterns obtained by plotting milliequivalents for analyses of eight samples of water from wells in Ellsworth County using the Stiff method of graphic interpretation. The patterns show the predominant ions, which determine the chemical type of the water. Numbers 1 and 8 are calcium sulfate waters, 17 and 18 are sodium chloride waters, 10 and 5 are calcium bicarbonate waters, and 29 is a calcium bicarbonate water containing an appreciable quantity of nitrate.
Figure 25--Bar graphs showing chemical character of ground water.
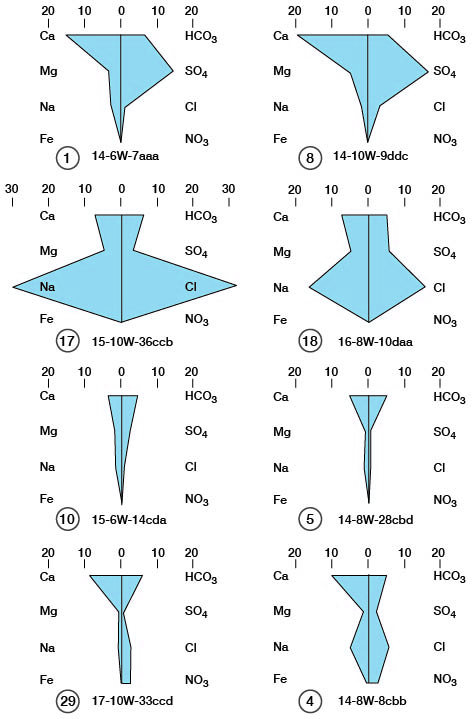
Casual study of the patterns shown by the analyses could lead to erroneous interpretation as to the source of the waters. Although the pairs of analyses shown on figure 25 are similar and one might assume that similar patterns represent waters from the same aquifer, a study of the records of wells and springs in table 6 indicates that, in each case, similar patterns are from different aquifers, and three separate analyses of water from the Dakota Formation, analyses 8, 17, and 5, have different patterns.
If one considers only the major dissolved constituents and groups together certain dissolved ions whose properties are similar, most natural waters can be represented as solutions of the cationic constituents, calcium, magnesium, and the alkali metals, and the anionic constituents, sulfate, chloride, and those contributing to alkalinity. The alkali metals are principally sodium and potassium, and the constituents contributing to alkalinity are principally bicarbonate and carbonate. When the constituents are grouped in this manner, the composition of a water can be represented by trilinear plotting. This method of interpretation of water analysis has been used in a considerable number of publications with some variation in plotting procedure.
Figure 26 is a modification of the trilinear diagram proposed by Piper (1944) in which milliequivalents per liter of cations or anions are plotted as percentages of total milliequivalents per liter of all cations or anions.
Figure 26--Modified Piper diagram showing grouping of analyses of water from wells. Numbers by symbols are sample-identification numbers from table 3.
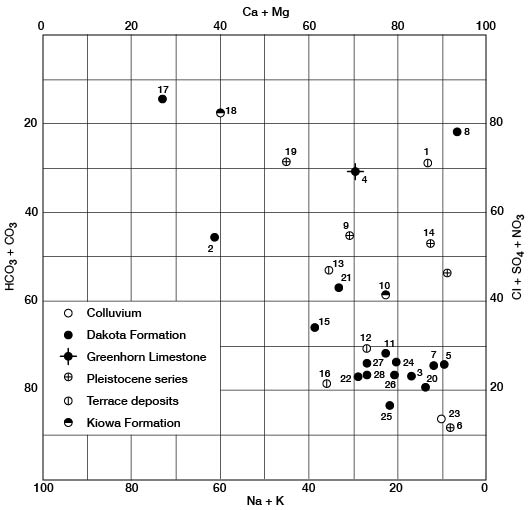
In Ellsworth County a water low in percentage composition of calcium, magnesium, and bicarbonate will generally be a sodium chloride water such as analysis 17, figure 25. However, a water high in percentage composition of calcium or magnesium but low in bicarbonate will be a calcium magnesium sulfate water such as analysis 8, figure 25. A study of the analyses on the Piper diagram (fig. 26) indicates that most of the water from the Dakota aquifer is calcium bicarbonate water and most of the water shows a fair grouping in this part of the diagram, but some of the data are scattered, indicating the need for consideration of factors other than the diagrams in the interpretation of the quality of the water. On figure 26 the number of analyses is too small to establish a pattern or grouping of water from aquifers other than the Dakota Formation.
Chemical Constituents in Relation to Use
The recommended maximum concentrations for the following chemical constituents in water used for domestic supply are from the U.S. Public Health Service (1962).
Dissolved solids--The residue remaining after a natural water is evaporated consists mainly of mineral constituents but may include some organic material and water of crystallization. Water containing less than 500 mg/l of dissolved solids generally is satisfactory for domestic and many industrial uses. Water containing more than 1,000 mg/l of dissolved solids generally has certain constituents in sufficient quantity to produce a noticeable taste or to make the water unsuitable in some other respect. Nine samples from Ellsworth County had dissolved solids in concentrations exceeding 500 mg/l, and in four of these samples the concentrations exceeded 1,000 mg/l.
Hardness--Hardness is commonly recognized by its effect when soap is used with water. Calcium and magnesium are the mineral constituents that cause almost all the hardness of water and are the constituents that form most of the scale in steam boilers and other containers in which water is heated or evaporated. The table of analyses (table 3) gives total (carbonate plus noncarbonate) hardness and noncarbonate hardness. Carbonate hardness is referred to as temporary hardness, and may be almost entirely removed by boiling and by other common treatment methods. Noncarbonate, or permanent, hardness is caused by sulfates and chlorides of calcium and magnesium and cannot be removed by boiling or by common treatment methods. Carbonate and noncarbonate hardness react similarly to the use of soap. Water that has less than 60 mg/l of total hardness is considered soft and is rarely treated to remove hardness. Water with hardness between 61 and 120 mg/1 is considered moderately hard and causes an increase in the consumption of soap but is suitable for many purposes. Water having a hardness between 121 and 180 mg/l is considered hard and may be softened profitably by laundries and industries. Water having more than 180 mg/l hardness is considered very hard and generally is undesirable for household use unless treated by a softening process. None of the samples of water from Ellsworth County had concentrations of hardness in the range that would be considered soft. Three samples were moderately hard, two were hard, and 24 were very hard.
Iron--Next to hardness, iron is generally the most troublesome constituent in natural waters. The recommended maximum concentration for iron for domestic use is 0.3 mg/l. Water containing iron in concentrations in excess of 0.3 mg/l will stain fabrics, cooking utensils, and plumbing fixtures, and may have a disagreeable taste. Iron may be removed from water by aeration and filtration, but most water will require additional treatment. Many of the samples of ground water from Ellsworth County contained iron in excess of the recommended limit. However, the water samples analyzed were unfiltered at the time of collection and the high concentrations reported for iron may have been derived from suspended material in the water.
Manganese--Manganese in ground water originates and generally reacts similarly to iron. Manganese causes a bluish-black stain on clothing and utensils in contrast to the characteristic red stain caused by iron. The recommended maximum concentration for manganese is 0.05 mg/l for domestic use. In Ellsworth County 13 of the samples contained manganese in excess of the recommended limit.
Chloride--Chloride is abundant in nature and many rocks contain small to large amounts of chloride salts that may be dissolved by ground water. Water containing less than 250 mg/l of chloride is satisfactory for domestic use. Cattle can drink water containing as much as 5,000 mg/l of chloride; however, they will lose weight until they become adjusted to the water. Only two samples contained more than 250 mg/l of chloride in Ellsworth County.
Fluoride--Fluoride in concentrations greater than 1.5 mg/l in drinking water used regularly by children during the formation of the permanent teeth may cause mottling of the tooth enamel (Dean, 1936, p. 1270). However, a moderate concentration (1.0 to 1.5 mg/l) of fluoride helps to prevent tooth decay. Only two samples of water had concentrations of fluoride greater than 1.0 mg/l, and no concentration exceeded 1.5 mg/l.
Nitrate--The recommended maximum concentration of nitrate in water for domestic supply is 45 mg/l. The use of water containing an excessive amount of nitrate in the preparation of a baby's formula can cause cyanosis (blue baby), or oxygen starvation. Water containing more than 90 mg/l of nitrate is regarded by the Kansas State Department of Health as likely to cause severe, possibly fatal, cyanosis if used continuously (Metzler and Stoltenberg, 1950). Nitrate poisoning appears to be confined to infants in their first few months of life. Adults drinking the same water are not affected; however, breast-fed babies of mothers drinking such water may be affected. Cows drinking water containing a high concentration of nitrate may produce milk high enough in nitrate to cause cyanosis in infants. Nitrate cannot be removed from water by boiling or other simple treatment.
The source of nitrate in natural water in Ellsworth County is not known. In Kansas, nitrate-bearing rocks sufficiently high in nitrate to contribute the quantities that occur in water are not known to exist. Chemical fertilizers and certain legumes are sources of nitrate in some local areas, and seepage from sewage sources or barnyards may also contribute nitrate. The quantities that have been pumped over a period of several years from wells known to yield water with a high nitrate content would indicate a continuing source of the nitrate. Bacteria, which have the ability to "fix" or convert the nitrogen of the air or of organic material to nitrate, may be the principal source of nitrate in water.
In 1958 the Kansas State Department of Health investigated the water supplies of several cities in Kansas in which the concentration of nitrate was higher than the desirable limits set by the Department of Health. Wilson in Ellsworth County was one of these cities. Conclusive results were not obtained in this investigation; however, certain factors were common to all the water supplies and may be important to the presence of nitrate in these water supplies. In all the cities the supplies were from thin aquifers of low transmissibility. The wells were relatively low-yielding wells having appreciable drawdown when pumped. Nitrate concentrations were higher at or near the water table than in the lower part of the aquifer. Wilson, in a 16-year period, pumped an estimated 370 tons of nitrate in water from the east city well. This quantity of nitrate would indicate that a continuing source of nitrate was necessary.
Wells yielding water with a low nitrate content have been constructed in areas known to contain water with a high nitrate content. In such a well the aquifer must be more than 10 or 15 feet thick. The well should be screened only in the bottom of the aquifer and tightly cased to the surface. The well should be pumped at a low rate to take water out of the bottom of the aquifer with little disturbance of the water having high nitrate content at or near the water table.
In only four samples of water from Ellsworth County (table 3) was the nitrate concentration greater than 45 mg/l. Two of these samples were from municipal supplies (Wilson and Kanopolis). The geologic and hydrologic conditions at Wilson and Kanopolis are similar.
Sulfate--Sulfate in ground water is derived chiefly from the solution of gypsum and the oxidation of sulfide minerals. Sulfate, when derived from magnesium sulfate (Epsom salt) or sodium sulfate (Glauber's salt), and when present in ground water in sufficient quantities, gives a bitter taste and has a laxative effect on persons not accustomed to drinking such water. The maximum concentration of sulfate recommended for municipal supplies is 250 mg/l. Only three samples of water from Ellsworth County exceeded 250 mg/l of sulfate.
Sanitary Conditions
The analyses of water given in table 3 show only the amount of dissolved mineral matter in the water and do not indicate the sanitary quality.
The cities of Ellsworth County that have municipal water supplies use carefully constructed wells that meet the requirements of and are periodically examined by the Environmental Health Services of the Kansas State Department of Health. Many homes, however, have private water supplies, and every precaution should be taken to protect these supplies from pollution. A well should not be located near potential sources of pollution, such as barnyards, privies, or cesspools. Well casings should be sealed tightly down to a level below the water table. Recommended sanitary types of construction and suggestions for locations and pump installations for different types of wells can be obtained from the State Department of Health.
Special procedures are necessary in collecting and analyzing samples of water for bacterial analysis. The Environmental Health Services makes this type of analysis. In some areas the County Health Officer can advise the individual about the proper procedure for collecting and submitting samples for bacterial analysis.
Availability of Ground Water
Fresh ground water is known to occur in Ellsworth County in unconsolidated rocks locally to a depth of about 85 feet and in consolidated rocks locally to a depth of about 300 feet. The consolidated rock aquifers are the chalks, limestones, shales, siltstones, and sandstones constituting the bedrock of Ellsworth County. The sandstones are the most important consolidated rock aquifers. The Pleistocene aquifers are unconsolidated except for uncommon locally cemented zones. The Pleistocene deposits vary greatly in their geologic and hydrologic characteristics and occur on the uplands, on valley walls, and as valley fillings. The deposits show textural variations ranging from clay to gravel in grain size and from well sorted to unsorted.
Ninnescah Shale
Because the Ninnescah Shale in Ellsworth County is generally a massive siltstone, it is a very poor aquifer. No wells in the county are known to obtain water from this formation.
Kiowa Formation
Water is obtained from the Kiowa Formation from both drilled and dug wells in areas along the Smoky Hill River, near the eastern county line, and near Langley in the southeast corner of the county. The Kiowa Formation contains zones of sandy shale and also random lenticular bodies of poorly cemented fine-grained sandstone that serve as aquifers. A persistent sandstone in the uppermost part of the Kiowa yields water to numerous wells in eastern and central Ellsworth County. A well penetrating the thicker part of a sandstone unit will likely provide an adequate supply of water, whereas another well, perhaps nearby, that misses a sandstone body will be essentially dry. Yields of wells in the Kiowa Formation range from a few gallons per hour to as much as 50 gpm (gallons per minute) .
Dakota Formation
The Dakota Formation contains the important aquifers in Ellsworth County and, in fact, in much of western Kansas. The Dakota Formation in Ellsworth County is a clastic unit ranging in grain size from clay to fine pebbles. Almost any degree of particle mixture can be found, from complete heterogeneity of grain size to a uniform size. The fine clastics do not provide appreciable supplies of water. The coarse clastics, especially the well-sorted sandstones, are the principal sources of water for the farms and communities except in the Smoky Hill River valley. The sandstones occur generally as lenses, which may be as much as several miles in lateral extent and as much as 90 feet thick. Locally, if a sandstone body has the proper shape, dip, or relationship to other lithologies, the water it contains may be under a hydrostatic head, and wells tapping the aquifer will be artesian.
The amount and quality of water obtainable from the Dakota Formation varies, sometimes greatly, within a relatively small area. A supply of good-quality water sufficient for stock and domestic use is nearly always possible; however, residents of western Ellsworth County report "salty" water from deep wells in that area. In many areas of Ellsworth County, the amounts pumped for stock and domestic use apparently cause little or no drawdown in the water table, and appreciably greater amounts of water probably could be safely withdrawn at these places. Although very few individual wells are pumped in excess of 10 gpm, yields of as much as 250 gpm probably could be sustained by cyclic pumping in a number of places.
The directions of dip of cross-stratification in sandstone generally are conceded to indicate the directions of flow of currents that deposited the sandstone. The relationship between dip bearings of cross-stratification and the trend of elongation of scour-fill channels at the base of the Shinarump Formation proved a useful tool in locating drill holes in uranium exploration on the Colorado Plateau (Finnell and others, 1963). Cross-stratification studies such as those described above conceivably could be equally useful in establishing locations for water wells in the Kiowa and Dakota Formations in central Kansas. For example, vector resultants of cross-stratification dip bearings are mainly westward and southwestward in the Dakota Formation in Ellsworth County and average S. 71° W. (fig. 12b). Thus, one might infer that the most likely locations for a second productive well tapping a given aquifer in the Dakota Formation would be to the west or southwest of the first well. If the direction of dip of cross-stratification can be determined from outcrop studies of an aquifer, it might be possible to determine more accurately the direction in which the location of a well should lie. However, the length of sandstone-filled channels in both the Kiowa and Dakota Formations would be an important consideration in deciding on exact locations for water wells, and data on the overall dimensions of the sandstone deposits are scarce. Field studies indicate that the dimensions of many thick deposits of sandstone in the Dakota Formation can be measured in miles (fig. 15), and the same appears to be true for thick lenticular deposits of sandstone in the Kiowa Formation. It seems likely, however, that the direction of elongation of deposits of Kiowa sandstone commonly is southward and southwestward in Ellsworth County (fig. 12).
Graneros Shale
The Graneros Shale is generally not an aquifer in Ellsworth County. However, in a few locations wells obtain small yields of water from a sandy zone within the unit.
Greenhorn Limestone
The Greenhorn is not an important aquifer. However, a small amount of ground water moves through the unit and upon encountering one of the several bentonite layers within the unit is discharged through seeps at the downdip exposure of the bentonite. Only a few wells are known which obtain water from the Greenhorn, and the yield from these wells is generally only a few gallons an hour.
Carlile Shale
This unit does not yield water to wells in Ellsworth County.
Pliocene and Pleistocene Deposits
The Ogallala Formation in Ellsworth County consists entirely of a soil caliche formed during late Pliocene time. These deposits everywhere lie above the water table and yield no water to wells.
Rocks representing all stages of the Pleistocene are present in Ellsworth County. These deposits are of both eolian and fluvial origin. Most of the eolian deposits occur in the uplands and yield no water to wells. The fluvial deposits range in age from Nebraskan to Recent and occur as Recent alluvium in the major valleys and as terrace deposits adjacent to these valleys. These deposits are comprised of a heterogeneous mixture of silt, clay, sand, and gravel. The fluvial deposits of Nebraskan and Kansan age occur in a high terrace position adjacent to the Smoky Hill River and as the lower part of the valley fill in Wilson valley. In much of the area underlain by Nebraskan age deposits, these fluvial deposits are near the dissected valley wall and are drained; however, in local areas small quantities of water, probably less than 10 gpm, are available to wells. The Grand Island and Sappa Formations of Kansan age in the Smoky Hill River valley and Wilson valley yield small to moderate quantities of water to wells in the area. Locally these deposits lie above the water table and yield no water. Where the deposits are saturated, yields are commonly less than 50 gpm, but in areas where the Grand Island is thick and is composed predominantly of sand and gravel, yields of more than 100 gpm could be obtained, although no wells having this large a yield were visited during the investigation. In the tributary streams the Kansan age deposits lie above the water table and do not yield water to wells. In southern and southwestern Ellsworth County the channel deposits of Kansan age are lithologically similar to the Kansan age deposits in the streams tributary to the Smoky Hill River, but they are somewhat thicker and lie below the water table. Wells in these deposits generally yield only a few gallons per minute; however, yields up to 50 gpm probably could be developed in local areas.
Pleistocene fluvial deposits of Illinoisan, Wisconsinan, and Recent age occur in the valleys of the major streams and are the principal alluvial aquifers in the county.
Wells locally yield water from Illinoisan fluvial deposits in the Smoky Hill River valley; however, these deposits are principally composed of silt and sand and yields are not large. In local areas adjacent to the Smoky Hill River where the thickest and most permeable Illinoisan deposits occur, yields of as much as 100 gpm probably could be developed. Wells in the Wisconsinan fluvial deposits in the tributary valleys yield only a few gallons per minute. In the Smoky Hill Valley, wells in the Wisconsinan fluvial deposits yield as much as 250 gpm; however, smaller yields are more common. The city of Ellsworth obtains water from wells in Wisconsinan fluvial deposits within and west of the city. Yields of these wells range from 135 to 250 gpm (table 6).
Recent age deposits, although lithologically and hydrologically similar to the Wisconsinan age deposits, are utilized only sparingly because of their limited areal extent and subject to flooding.
Utilization
Domestic and Stock Supplies
Principal uses of ground water in Ellsworth County are for household supplies and water for farm animals. Wells used exclusively for stock are generally pumped by windmills although some electric pumps are used. The majority of domestic wells utilize jet pumps with some other types also in use.
Practically all the water used for domestic and stock supplies is untreated. Some domestic users have softeners in their water systems. An estimated 1,000 acre-feet of water is used annually for domestic and stock supplies.
Public Supplies
Six communities--Ellsworth, Wilson, Holyrood, Kanopolis, Lorraine, and Geneseo (Rice County)--have well fields in Ellsworth County that supply their municipal water systems. Data for these wells are given in table 6 and analyses of water from the municipal systems are shown in table 3. Total pumpage for municipal use is about 1,000 acre-feet per year.
Ellsworth--Two dug wells and four drilled wells supply water for Ellsworth. Of the two dug wells, the east one is 38 feet deep and the west one is 45 feet deep. The four drilled wells are all 50 feet deep. All six wells are drilled to or near the Dakota-Pleistocene unconformity but probably obtain water from the Pleistocene. The two west drilled wells have automatic chlorine pellet dispensers to combat the growth of iron-fixing bacteria. Water is pumped from the wells to the treatment plant where it is chlorinated and softened. Storage is provided by a 50,000-gallon concrete basin, a 150,000-gallon steel standpipe, and a 400,000-gallon steel standpipe. Ellsworth pumps about 560 acre-feet of water annually, or about half a million gallons per day.
Wilson--The town of Wilson is supplied by two wells which are rather unique in their design and operation. One is a battery-type setup consisting of seven wells connected to one pump; the wells are drilled to a depth of 25 feet, and tap Pleistocene terrace deposits. These wells are sealed airtight, and water-filled pipes connect six of the wells to the seventh central one which is pumped. The other well, located in the SW sec. 20, T. 14 S., R. 10 W., is a concrete cylinder 10 feet in diameter and 25 feet deep. Extending out from the well for 400 feet to the east and west is a line of 12-inch perforated steel pipe, which acts as a collecting gallery for ground water in the Pleistocene terrace deposits. This type of construction greatly increases well capacity. The water is chlorinated and stored in a 60,000-gallon steel standpipe located at the municipal services building. The city of Wilson pumps about 90 acre-feet of water annually.
Holyrood--Five drilled wells furnish water for Holyrood. The wells, 12.5 inches in diameter and ranging from 105 to 190 feet in depth, draw water from sandstones within the Dakota Formation. The untreated water is stored in a 50,000-gallon steel standpipe for distribution. The annual pumpage is about 170 acre-feet per year.
Kanopolis--The town of Kanopolis obtains its water supply from four wells. The waterworks well, which is 40 feet deep, and the well in the center of the W2 sec. 19, T. 15 S., R. 7 W., which is 35 feet deep, probably tap sand and gravel of the Pleistocene terrace deposits. The south town well, which is 55 feet deep, and the well located west of the drive-in theatre, 75 feet deep, probably tap sandy zones within the Kiowa Formation. The water is treated by chlorination and stored in a 60,000-gallon standpipe for distribution. The city uses about 60 acre-feet of water a year.
Lorraine--Water needs of Lorraine are supplied by two wells, both about 210 feet deep, which tap sandstones within the Dakota Formation. The water is pumped into a 50,000-gallon steel standpipe. About 40 acre-feet of water is used a year.
Geneseo--Although Geneseo is located in Rice County just south of Ellsworth County, the city obtains the municipal water supply from five drilled wells in Ellsworth County which tap sandstones of the Dakota Formation. Four of the wells, all 95 feet deep, are clustered around the county road intersection 1 mile north and slightly west of Geneseo. The fifth well, which is 155 feet deep, is located at the center of the south line of sec. 34, T. 17 S., R. 8 W. The water is treated by chlorinators on each well and is stored in a 50,000-gallon steel standpipe near the center of town. About 120 acre-feet of water is pumped annually by the city.
Industrial Supplies
The principal industrial user of water in Ellsworth County is the Northern Natural Gas Co., operator of a hydrocarbon-extraction plant in the southwestern part of the county. In 1960, six wells were drilled into the Dakota Formation to obtain water for injection into the Wellington salt to dissolve the salt, creating cavities for storage of propane. These wells were tested at about 250 gpm. The production rate ranges from 150 gpm to 250 gpm. Water from this well field is now used for cooling purposes only.
Irrigation Supplies
One well (17-9W-19aaa) was used for irrigation during this investigation. This well yields about 100 gpm and obtains water from gravel deposits in a buried Pleistocene channel in southwestern Ellsworth County. The gravel deposits are not continuous in the buried channel, and development of additional irrigation in the area is dependent on the location of additional gravel in the basal part of the channel deposits.
Water in sufficient amounts for large-scale irrigation is not available in the county. Maximum known yields are about 250 gpm from alluvial deposits adjacent to the Smoky Hill River and from the Dakota Formation, and yields this large can be obtained only in local areas.
Prev Page--Structure || Next Page--Mineral Resources
Kansas Geological Survey, Geology
Placed on web Sept. 18, 2008; originally published March 1971.
Comments to webadmin@kgs.ku.edu
The URL for this page is http://www.kgs.ku.edu/General/Geology/Ellsworth/05_gw.html