![]()
Prev Page--Geology || Next Page--Discussion, Conclusions
IV. Petrography and logs
A. Lithologic description and the Poersch #1 samples
The Precambrian basement in the Poersch #1 well was encountered at 2,846 ft (867 m). Total depth of the well is 11,300 ft (3,444 m). The rocks penetrated by the well can be roughly divided into two distinct parts or successions of almost equal thickness (Figure 19). The upper succession down to a depth of 7,429 ft is characterized by a preponderance of mafic volcanics and subordinate mafic and acidic intrusives that make up about 90% of the section. Oxidized siltstone and arkose make up the remainder of the section. The lower succession from 7,429 down to total depth (TD; 11,300 ft) is totally different. Here, arkose and subarkose, together with minor amounts of oxidized siltstone and shale, make up 90% of the section. Two mafic units are present in the sediment-dominated succession in the lower part of the well. The upper mafic unit is almost 130 ft thick (40 m) (8,678-8,806 ft) and the lower one is approximately 220 ft (67 m) thick (10,622-10,840 ft). These two units, together with some minor volcanic flows, account for the remaining 10% of the rocks present. It thus appears that a pronounced change in the depositional and tectonic regime took place, resulting in prolonged renewed volcanic activity observed in the upper part of the hole. Substantial pre-Paleozoic erosion has also probably taken place in the region; hence we have no record or knowledge of possible rock units (volcanic or sedimentary) that may have been present above the penetrated sequence and were subsequently eroded. Some thickness must have been present if our interpretation is correct that an intrusive igneous rock tops the section and presently crops out beneath the top of the Precambrian section.
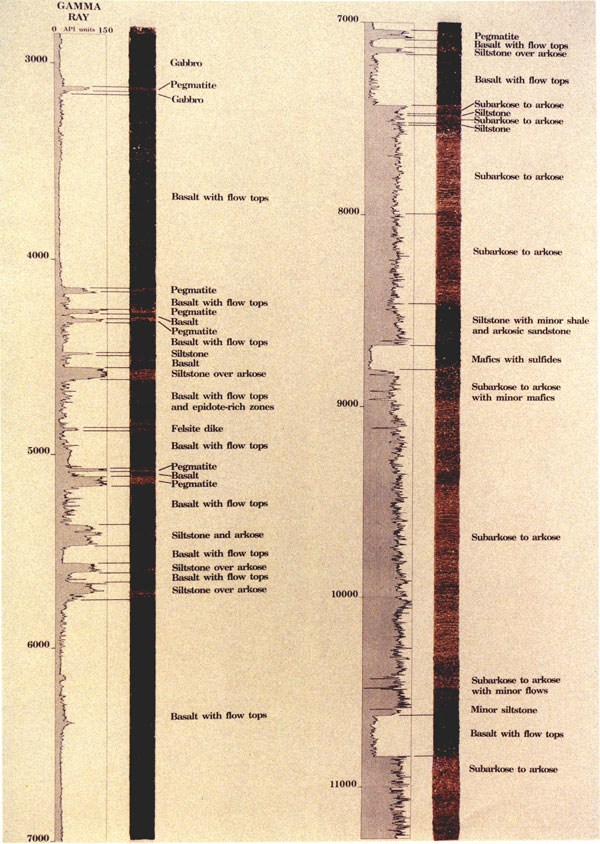
Figure 19--Lithologic log of Poersch #1 well.
Modeling based on gravity, magnetic, and seismic data allows for speculation on the rocks that underlie the penetrated strata at this location and this is discussed in the section dealing with regional and local geophysical modeling.
Methodology
To try to get a better understanding of the rocks present in the drill hole, we have examined the cuttings in some detail and prepared a lithologic column of the rocks present in the hole (Figure 20). This chart was constructed by glueing representative cutting samples on a cardboard strip.
Figure 20--Color lithologic column.
Samples were collected by Texaco, Inc., at 10-ft (~3-m) intervals. First occurrences of new lithologies were heeded in the cuttings in an attempt to offset the effect of cavings and differential lag time. Samples are generally in very good condition and any problems had been clearly identified in the sample envelopes. Lithologic changes are sharp and correlate well to the wireline-log response. Samples were described dry under the binocular microscope at 10-40X magnification. Selected chips were placed in 10% HCl to test for carbonate cement. Several thin sections of cuttings from various units were made, but time did not permit any systematic petrographic analysis. Grain sizes were visually estimated with an mm-sized edge of tweezers used to turn chips. Rock colors were matched using the Geological Society of America RockColor Chart (Goddard et al., 1948).
Grains larger than 2 mm (conglomeratic or gravel size) are typically broken in cuttings, displaying fresh surfaces and possibly rounded edges. Commonly, the larger grains are rounded and frosted so the distinction is clear that these are sedimentary gains rather than igneous crystals. Felsites and pegmatites created a few problems for distinguishing them from coarse arkoses and subarkoses because of the mass of ground feldspar crystals, but the uniform composition of the felsites, the fresh salmon-colored potassium feldspar, and delicate books of mica of the pegmatites distinguished them from terrigenous clastic sedimentary rocks.
Finer grained sedimentary rocks posed few problems to describe in cuttings. Aggregates of subangular to subrounded gains are common, cemented by either dolospar or translucent to clear megaquartz. Weathered, fine-grained basalt was generally easily distinguishable from fine-gained sediment although hematite alteration of mafics and chemical breakdown of the calcium plagioclase indicated a gradation of unweathered to weathered igneous rock. Size sorting can be estimated in chips of grain aggregrates. Finer sands range from well sorted to poorly sorted. Coarse, broken single grains are nearly always mixed with aggregates of smaller grain sizes, and it is difficult to describe sorting for these samples other than to mention range and abundance of sizes observed.
Only a few sampled intervals consist of only silt-sized grains or less. The strata immediately above mafic igneous units at 8,678 ft and 10,630 ft are predominantly silt-sized to clay-sized deposits. They are maroon colored with abundant hematite.
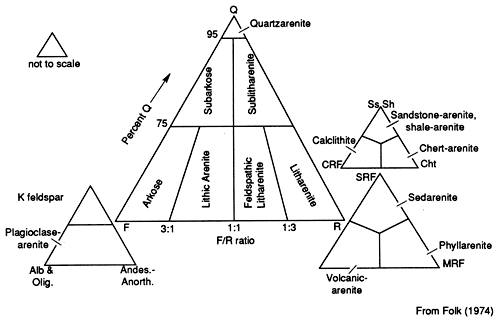
Composition of the sedimentary rocks is based on a visual estimate from binocular examination of the cuttings. Folk's (1974) classification (Figure 21) is used where arkose contains less than 75% quartz and greater than 3:1 feldspar over rock fragments. Subarkose contains between 25% and 95% quartz to feldspar and greater Ulan 50% feldspar to rock fragments.
Figure 21--Mineralogical classification of sandstones (from Folk, 1984).
Everyone familiar with drill cuttings is well aware of the limitations and possible pitfalls one faces with their examination (e.g., cavings, differential flotation, etc.). As an aid in the understanding and interpretation of the rocks, 10 whole-rock chemical analyses and some x-ray diffraction work were carried out. Brief examination of a number of thin sections also helped in the interpretation, but no systematic petrographic analysis was done. The depth intervals at which these analysis were done is noted in Appendix 3. All of these studies have been carried out in a very short time. Needless to say, much work needs to be done in the future.
As part of the drilling program Texaco Inc. took 14 cores in the hole. The information on the core is being held confidential for one more year from the date of this publication. However, age dates were obtained from several intervals and these dates are released and referred to in the text (see Table 1).
Table 1--Summary of K-AR ages from the Noel Poersch #1 borehole, Washington County, Kansas.
| Rock type | Interval (ft) | K-Ar ages | ||
|---|---|---|---|---|
| A | B | C | ||
| Gabbro | 2901-2914 | 667±33 my | 587±23 my | 800±18 my |
| Pegmatite | 5110-5160 | 655±15 my | ||
| Basalt | 5397-5402 | 953±48 my | 833±30 my | 981±22 my |
| Basalt | 7154-7160 | 864±43 my | 915±32 my | 992±23 my |
| Gabbro | 8711-8717 | 880±44 my | 814±31 my | 863±20 my |
| Basalt | 10648-10675 | 1021±100 my | 837±34 my | 895±21 my |
| A--Teledyne B--Geochron C--University of Arizona |
||||
A description of the rocks encountered in the Poersch #1 can be found in the Appendix 3. In the following section, a more detailed description and preliminary interpretation of some of the intervals follows, partially based upon some of the analytical work carried out to date.
For purposes of explanation and organization, rock types will be described going down hole. As described in the introduction to this section, we have tentatively divided the well into an upper volcanic-dominated succession (2,846-7,429 feet) and a lower sedimentary-dominated succession (7,429 to T.D.) Subdivisions within each of these successions are discussed below.
Table 2--Chemical analyses of cuttings from the Poersch #1 borehole; major-element compositions in weight %, trace elements in ppm.
| Sample No KGS No |
1* | 2* | 3* | 4* | 5* | 6* | 7* | 8* | 9* | 10* |
|---|---|---|---|---|---|---|---|---|---|---|
| SiO2 | 43.11 | 42.45 | 46.51 | 46.44 | 42.94 | 58.88 | 42.24 | 44.80 | 66.02 | 49.56 |
| Al2O3 | 16.27 | 14.68 | 15.15 | 14.89 | 14.02 | 13.07 | 14.48 | 16.10 | 12.68 | 15.12 |
| Fe2O3 | 11.57 | 13.09 | 13.68 | 12.68 | 16.93 | 3.13 | 16.33 | 13.58 | 1.89 | 11.54 |
| MnO | 0.21 | 0.20 | 0.21 | 0.21 | 0.24 | 0.05 | 0.29 | 0.21 | 0.21 | 0.27 |
| TiO2 | 1.35 | 1.05 | 2.63 | 2.09 | 2.97 | 0.58 | 2.77 | 1.62 | 0.32 | 1.55 |
| CaO | 10.21 | 7.95 | 8.12 | 8.21 | 7.14 | 7.98 | 8.00 | 8.91 | 1.90 | 5.37 |
| MgO | 8.93 | 14.92 | 5.53 | 6.61 | 5.84 | 9.17 | 6.12 | 8.14 | 0.46 | 6.30 |
| Na2O | 1.53 | 1.12 | 2.99 | 2.28 | 2.50 | 2.68 | 1.79 | 2.04 | 2.30 | 3.74 |
| K2O | 3.16 | 1.31 | 2.61 | 4.26 | 4.99 | 3.55 | 4.93 | 1.98 | 12.76 | 4.84 |
| LOI | 3.99 | 3.20 | 3.19 | 2.92 | 3.18 | 0.83 | 3.34 | 2.09 | 1.97 | 2.40 |
| Total | 100.33 | 99.97 | 100.62 | 100.59 | 100.75 | 99.92 | 100.29 | 99.47 | 100.51 | 100.69 |
| K2O+Na2O | 4.69 | 2.43 | 5.60 | 6.54 | 7.49 | 6.23 | 6.72 | 4.02 | 15.06 | 8.58 |
| K2O/Na2O | 2.07 | 1.17 | 0.87 | 1.87 | 2.00 | 1.32 | 2.75 | 0.97 | 5.55 | 1.29 |
| K2O/Al2O3 | 0.19 | 0.09 | 0.17 | 0.29 | 0.36 | 0.27 | 0.34 | 0.12 | 1.01 | 0.32 |
| SrO | 57.8 | 0.00 | 568.2 | 53.0 | 404.1 | 169.1 | 281.4 | 332.1 | 147.0 | 273.4 |
| BaO | 156.0 | 105 | 140 | 224 | 429 | 186 | 148 | 339 | 259 | 304 |
| NiO | 311.3 | 649.4 | 207.9 | 199.4 | 152.2 | 24.3 | 157.4 | 165.4 | 42.2 | 147.1 |
| Cu2O | 71.6 | 65.3 | 16.2 | 277.2 | 81.8 | 0.00 | 118.1 | 112.5 | 9.33 | 26.0 |
| Cr2O3 | 214.5 | 138.1 | 126.4 | 215.9 | 112.4 | 97.6 | 139.1 | 68.4 | 30.2 | 304.1 |
| All of the above values are listed in ppm oxide 1* Gabbro from a depth interval of 2860-2870 feet. 2* Basalt Erom a depth interval of 3720-3730 feet. 3* Basalt from a depth interval of 4760-4770 feet. 4* Basalt from a depth interval of 6130-6140 feet. 5* Basalt from a depth interval of 7180-7190 feet. 6* Arkose from a depth interval of 8330-8340 feet. 7* Gabbro or diabase from a depth interval of 8730-8740 feet. 8* Basalt from a depth interval of 6780-6790 feet. 9* Arkose from a depth interval of 9590-9600 feet. 10* Basalt from a depth interval of 10730-10740 feet. Analysis carried out by Kansas Geological Survey Analytical Services Labs. |
||||||||||
Upper Volcanic-Dominated Succession (2,846-7,429 ft)
Gabbro (2,846-3,150 ft)
The top of this succession is marked by a 290-ft (88-m)-thick, fine- to medium-grained gabbro or diabase. The color of the rock varies from a light greenish-gray to black, depending on the mafic content of the rock. In places it appears that the rock is serpentinized, which may be related to alteration of olivine. Using a hand magnet, a magnetite content up to several percent is noted. In the interval from 3,140 to 3,150 ft, about 10% of the rock is made up of epidote (x-ray analysis #3, Figure 20). A whole-rock chemical analysis of the gabbro from the interval of 2,860-2,870 ft using drill cuttings shows the rock to be alkaline and have a low silica content (Table 2).
From all appearances the rock is intrusive. Whether it is a sill or dike or part of a larger intrusive body is unknown. It is, therefore, reasonable to assume that more volcanic or sedimentary rock were present and subsequently eroded before Paleozoic sediments were deposited, but how much rock was removed by erosion is impossible to say. The contact with the overlying sediments is sharp, indicating that active erosion took place before the Ordovician Simpson Group was deposited on the Precambrian unconformity. The mafic rocks look reasonably fresh near the contact. A 21-ft (6-m)-thick pegmatite was intruded into the gabbro at 3,113 ft. The rock is medium crystalline and has a pinkish-light-brown to gray color. It is mostly made up of quartz and pink potassic feldspars. The pegmatite can be readily recognized on a variety of geophysical logs including gamma ray, neutron/density, and resistivity. Increased concentrations of thorium, uranium, and potassium contribute to a pronounced gamma-ray anomaly when compared to the typical low gamma-ray response of the gabbro in which it is intruded. Whether the pegmatite is genetically related to the gabbro or not is unknown. An increase in epidote in the gabbro directly below the pegmatite was noted. This epidote may be the result of late magmatic or hydrothermal alteration processes related to pegmatite intrusion.
K-Ar age dates from the interval were provided by three laboratories (Table 1). The dates vary considerably, but are all less than the 1,100 m.y. dates obtained for the rocks in the northern part of the rift in the Lake Superior region.
Basalt sequence (3,150-4,140 ft)
Underlying the gabbro down to a depth of 4,140 ft is a series of basalt flows. The top of the first flow is recognized in the cuttings by a distinct reddish color of the rock which can be attributed to oxidation of the top of the flow. Additionally, white to light-colored chips are present that are believed to represent infillings of amygdules near the top of the flow. Approximately 20 ft (6 m) down into the flow, the rock appears to be fresher and darker looking.
The rock is microcrystalline and its color varies from light-greenish gray to a darker gray depending on the mafic mineral content of the rock. The rock is also oxidized to varying degrees in thin zones in several places, and these horizons are interpreted to represent flow tops. The basalts have undergone deuteric and hydrothermal alteration. Fibrous hornblende, chlorite, saussurite, and albite are recognized.
A chemical analysis of cuttings from a relatively fresh-looking interval (3,720-3,730 ft) is given in Table 2. The composition is similar to that of the overlying gabbro and is an alkaline basalt. The magnesium content of the rock is quite high.
It is difficult to recognize individual flow tops from the geophysical logs. There is a suggestion that some of the more pronounced tops are reflected in the neutron-density signature. Based upon recognition of oxidized zones together with the presence of zeolites, flow tops are tentatively identified at 3,330, 3,390, and 3,530 ft (Appendix 3). Additional flow tops, inferred from the presence of zeolites only, may be present at 3,150, 3,240, 3,790, and 4,140 ft. Based upon this information, the thickness of the flows varies from 40 to 260 ft (12-79 m). This is generally a little thicker than the average for transitional basalt in the Lake Superior region, leading us to believe that more flows are present than can be readily recognized.
A thin pegmatite, possibly about 1 ft (.3 m) thick and similar in nature to the thicker pegmatite above (3,113-3,134 ft), is recognized in the interval between 3,290 and 3,300 ft.
The mafic mineral content of the basalt flows varies considerably. A lot of this variation can be attributed to magnetite which is easily tested for in the cuttings. The magnetic fraction that can be separated with a hand magnet from the cuttings varies from an estimated few percent to as much as 60% of the rock. It is tempting to ascribe this variation to differentiation processes, but in the absence of core, the answer remains elusive. Furthermore, these variations are not recognized in the geophysical logs. An x-ray diffraction analysis of the mafic magnetic fraction from a basalt at a depth of 6,410 ft showed that the mafic fraction consisted of an intergrowth of augite and magnetite. By crushing the material to a fine size, a magnetic separation showed that only about one-third of the fraction consisted of magnetite (x-ray analysis #10, Appendix 3, 6,410-6,420 ft). It is believed that the same might be true elsewhere in the section. Thus, the magnetite content of the rock ranges from a few to about 20% as, for example, in the interval from 3,640 to 3,650 ft.
In some intervals alteration of the plagioclases to albite has progressed to an extreme degree as, for example, in the interval from 3,3 10 to 3,340 ft. Here up to about 70% of the rock consists of albite (x-ray analysis #2, Appendix 3). Again, in the interval between 3,390-3,400 ft, albite is the dominant mineral.
Upper mixed volcanic-sedimentary sequence (4,140-5,719 ft)
This sequence of rocks is characterized by generally thin basaltic flows and alternating arkose and siltstone units. Within the first two hundred feet of this sequence, three pegmatite sills or dikes, up to 30 ft (9 m) thick, intrude the basalts.
The upper pegmatite (4,140-4,170 ft) looks different from the two pegmatites below it, in that it contains much more feldspar and a subordinate amount of quartz. It is also distinctly finer grained and has a felsitic texture. The amount of mafic minerals in the pegmatites is small. In the interval between 4,860 and 4,870 ft, another thin felsite or pegmatite is present.
Within this sequence, more flow tops are recognized than in the sequence above (i.e. the basalt sequence from 3,150 to 4,140 ft). Perhaps outpouring of basalt in the sequence between 4,140 and 5,719 ft took place more intermittently, which resulted in the accumulation of interflow sediment during periods of relative quiescence. During these periods of prolonged exposure to weathering, time was allowed for individual flow tops to become oxidized. The increase in oxidation within this whole sequence of rocks is well shown in the lithologic column (Figure 20).
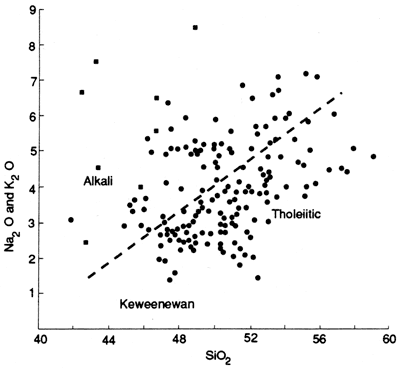
The basalts seem to have a slightly higher silica content as well as total alkalis as shown in the chemical analysis (Table 2) of cuttings from a depth of 4,760-4,770 ft. These basalts plot within the range of similar Keweenawan alkali basalts on an alkali versus silica diagram reported by Green (1982; Figure 22).
As noted above, the volcanics in this sequence seem to be much more deuterically and hydrothermally altered. The alteration of plagioclase to epidote-group minerals is quite common throughout the sequence. Some intervals are completely altered and epidote makes up 70% of the rock (4,710-4,720 ft), (4,810-4,850 ft). This is especially well shown by the presence of green-colored bands at these levels in the lithologic column (Figure 20).
The first significant interflow sedimentary rock occurs at 4,472 ft. It is about a 12-ft (4-m)-thick brick-red siltstone. The basalt below the siltstone is also oxidized. Another 60-ft (18-m)-thick sedimentary unit is present at 4,550 ft depth. It consists of a 50-ft (15-m)-thick coarse arkosic sandstone to conglomerate overlain by a 10-ft (3-m)-thick red siltstone. The arkosic sandstone, the first coarse sedimentary rock encountered in the hole, is composed mostly of quartz and pink potash feldspar. It marks an influx of material from a nearby granitic basement terrane. In a sense, it resembles the granite wash, which is commonly encountered at the top of basement below Paleozoic sediments. The change from arkose to siltstone at the top of this section seems to be abrupt and may well represent an unconformity. Three packages of interflow sedimentary rocks occur farther down in this sequence (i.e. the interval 4,610-5,719 ft). At 5,364 ft, a 120-ft (40-m)thick section of primarily brick-red oxidized siltstone and shale occurs. Minor basaltic rock and some coarse arkosic sandstone and conglomerate are interbedded. Two sedimentary units below it at 5,560 and 5,642 ft consist of red oxidized siltstone that grades into or overlies medium-grained arkosic sandstone. It is interesting to note that coarser grained sediments are usually found toward the base of these sedimentary packages and change to finer grained sediments upwards. Fining-upward sedimentary packages are also common in the sedimentary-dominated succession in the lower half of the Precambrian section penetrated by the well.
Two K-Ar age dates (Table 1) were obtained from the interval between 4,140 and 5,719 ft. The first was from the pegmatite in the 5,110-5,160-ft interval. No core was available, thus cuttings were used. Closer examination of this "pegmatite" in cuttings shows that it possibly could be interpreted to be a coarse-grained arkosic sandstone or a conglomerate. The difference between a conglomerate and a pegmatite is difficult to recognize in cuttings. Inasmuch as K-Ar dates from granitic basement would be expected to be considerably older, an age of 655 million years (Ma) may be more appropriate for a pegmatite. Another age date was obtained from the interval from 5,395 to 5,400 ft. Both basalt and siltstone occur in the interval, but it is assumed that the basalt was dated. An average age of 922 Ma for the basalt is just a little younger than the commonly quoted age for Keweenawan basalt (Table 1).
Figure 22--Alkalies versus SiO2 diagram showing Keweenawan alkali and tholeiitic lavas (solid circles) and alkali lavas plus gabbro (solid squares) in the Poersch #1 Hole in Washington County, Kansas.
Basalt-dominated sequence (5,719-7,039 ft)
The basalts in this sequence are microcrystalline and vary in color from light to dark greenish-gray depending on the mafic mineral content. Some basalt, especially near the presumed tops of flows, have a reddish-gray color. The basalts in this sequence are generally more thoroughly deuterically and hydrothermally altered than similar flows in the previously described basalt sequence between 3,150 and 4,140 ft. Thick intervals have considerable amounts of epidote and albite, and these can easily be distinguished on the lithologic column by their light-green colors (Figure 20). Individual flows seem to be quite thick and may range up to 370 ft (110 m). The mafic mineral content, including magnetite, increases regularly downward in some flows. A good example occurs in a thick flow (6,180-6,430 ft), where in the lower 100 ft (33 m) the mafic mineral content increases from 5% to 20%. The magnetite content increases from about 2% to 7% over the same interval.
Two whole-rock chemical analysis for cuttings from 6,130 to 6,140 ft and from 6,780 to 6,790 ft are given in Table 2. The analysis are within the same range as those at the basalts higher up in the sequence. Again they are alkaline basalts, and when compared with other Keweenawan basalts they are generally higher in alkalis, especially potassium.
An x-ray analysis (#10, Appendix 3) of a sample with a high content of mafic minerals near the bottom of a flow (6,410-6,420 ft) shows that the main minerals are magnetite, augite, and albite. Toward the bottom of this volcanic sequence, the rock seems to be quite fractured. Thin flakes of light-gay to white rock often giving the appearance of being "smeared" or striated are interpreted as fracture fillings. An x-ray diffraction analysis (#6, Appendix 3) from a depth of 7,000 to 7,010 ft shows the material to consist of oligoclase, chlorite, and hornblende with minor muscovite. This mineral assemblage probably results from deuteric alkalation processes.Lower mixed volcanic-sedimentary sequence (7,036-7,429 ft)
This sequence somewhat resembles the upper mixed volcanic-sedimentary sequence from 4,140 to 5,719 ft, in that both sequences are capped by a pegmatite that overlies basalt containing interflow sediments.
The pink-colored pegmatite at 7,036 ft is about 30 ft (10 m) thick and consists of potassium feldspar, quartz, and small amounts of mafic minerals. The pegmatite seems to be finer gained than the ones higher up in the hole. This is the deepest pegmatite seen in the hole, but admittedly if others occurred in the sediment-dominated succession in the lower half of the well, they would probably be difficult to discern. However, since several pegmatites occur in the upper unit, they may be all related to the same intrusive event. The pegmatite is separated from the underlying 26-ft (8-m)-thick coarse arkosic sandstone and siltstone by a basalt flow a few feet in thickness. This sedimentary unit occurs at 7,130 ft and, like others above, is again capped by a 15-20-ft (5-7-m) brick-red siltstone which overlies a coarse arkosic sandstone and conglomerate. The sediments are pinkish-red-brown in color and can easily be distinguished on the lithologic column from the dark-colored flows above and below (Figure 20).
The basalts in the lower mixed volcanic-sedimentary sequence (i.e. 7,036-7,429 ft) occur as thin flows not more than 10-20 ft (3-6 m) thick. Most of the basalt is oxidized to some degree and amygdules filled with secondary minerals are common.
A whole-rock chemical analysis (Table 2) of a basalt from the interval 7,180-7,190 ft shows the rock to be very alkaline and to have a relatively low silica content. The rock is also plotted on the silica-to-alkali diagram (Figure 22) together with other Keweenawan basalts.
Three K/Ar age dates from independent laboratories indicate an average age of close to 900 Ma for the basalts at a depth of 7,155 ft (Table 1). This age corresponds closely with the age for basalt at a depth of 5,400 ft but is seemingly younger dm basalt in the Lake Superior region
Lower Sedimentary-Dominated Succession (7,429-11,300 ft)
The sedimentary-dominated sequence in the lower part of the well can be divided into three sequences. The upper and middle sequences are composed of thick sedimentary units that respectively overlie relatively thin mafic volcanic flows or intrusives. The lowest sequence is only partly penetrated and is entirely sedimentary rock.
Upper sedimentary sequence (7,429-8,806 ft)
An abrupt change takes place at the 7,429-ft level. Volcanics predominate in the succession above, while sediments make up the bulk of the rocks below. Minor mafic intrusives or volcanics, less than 5-ft (1.5-m) thick, occur within this interval, possibly as harbingers of the intense volcanic activity to come. This activity influenced the type and nature of the sediments being deposited.
In general, sediments in the lower half of the borehole consist of arkosic to subarkosic medium- to coarse-grained sandstones, conglomerates, and subsidiary siltstone deposited in oxidizing environments. No accumulations of organic matter were noted in the cuttings. The sandstones and conglomerates are at times quite fresh looking and are light pinkish-red and brown colored. Rounding and frosting of coarser grains is also very common. This was not observed in coarse-gained sedimentary rocks in the upper volcanic-dominated succession. They are most likely derived from nearby granitic rocks that make up most of the Precambrian basement in Kansas. A chemical analysis of the arkose from the 8,330-8,340-ft interval shows the granitic nature of the rock (Table 2). The siltstones are brick-red colored.
Lithic fragments consist of finely crystalline altered or fresh volcanic rock or clay chips. Mica fragments also are present. The content of rock fragments and feldspar gains increases as grain size decreases; hence many of the finer grained sedimentary rocks could be classified as arkoses, whereas coarser grained varieties were commonly subarkoses. Quartz content and extent of grain rounding also decrease with a decrease in grain size.
The coarse-grained fraction (medium-sized to gravel) has abundant quartz grains which are commonly frosted. The crystals are coarse and commonly polycrystalline, although no quantitative estimates were made of the relative abundances for this preliminary report. The other major mineral is potassium feldspar. The feldspar grains in general are fresh, light pink and salmon colored. As the grain size decreases, the feldspars appear to be less fresh with more associated hematite staining. Mafic rock fragments also are commonly weathered and oxidized in the finer fraction and are stained with hematite. Hematite also commonly replaces mafics and stains plagioclase in what are interpreted to be tops of weathered basalt flows. Other detrital minerals like quartz and unrecognizable clay and silt-size fragments comprise these thin intervals (< 10 ft [3 m]) and appear to represent weathered surfaces on volcanic flows on which minor sedimentation also occurred. Hematite also exists as thin coatings on quartz and feldspar grains in the finer grained deposits. The pervasive hematite may be a diagenetic product, but it still appears to be closely related to the depositional settings as described later in this section.
Major porosity was not seen in the cuttings. However, more detailed examination is needed. Porosity wireline logs generally corroborate the lack of visible porosity in the cuttings but indicated 22 ft (~6 m) of porosity at 11,054 ft. Cuttings samples here however showed no obvious porosity. Fractures were, of course, not directly observable in cuttings. However, occasional terminated quartz crystals and fine-grained clay-like material in cuttings possibly indicated some type of void filling.
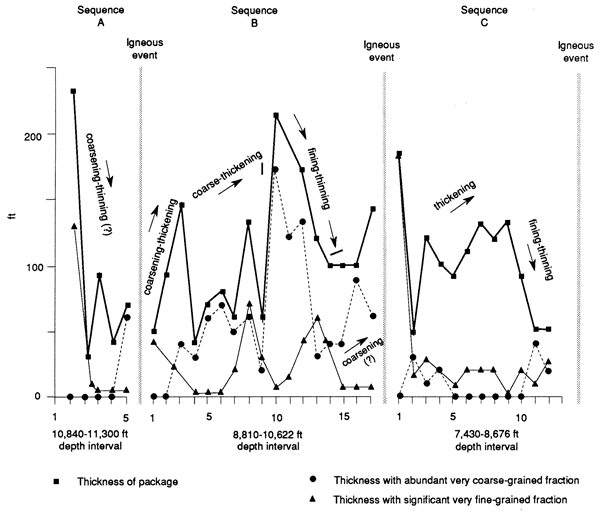
The upper sedimentary sequence between 7,429 and 8,806 ft seems to consist of about a dozen distinct sedimentary packages that can be characterized by having a conglomerate or medium- to coarse-grained sandstone at the bottom and decreasing in grain size upwards. A siltstone may or may not be present at the top (see Appendix 3). Hematite staining of grains is very common in places in this interval, particularly near or at the tops of the fining-upward packages. The finer fractions also contain more mafic and feldspar grains. The response of the natural gamma-ray wireline logs, particularly the potassium concentration, and the photoelectric curve correlate reasonably well with the compositional variation of the fining-upward and coarsening-upward packages. In fact, logs were used to strengthen the definition of these packages. Figure 23 depicts thickness and grain-size trends within individual fining- and coarsening-upward packages in the lower, middle, and upper sedimentary sequences in the lower half of this well.
Figure 23--Comparison of three sedimentary sequences below 7,400 ft in Poersch well. Vertical axis is thickness in feet. Each unit division of the horizontal axis represents an individual package for each of three sequences, A, B, and C, based on sample description and wireline-log interpretation (see Appendices 3 and 4). Sequences and packages are arranged from lowest on the left. Sequence A extends from 10,880 to 11,300 ft (bottom not reached), sequence B from 8,810 to 10,640 ft, and sequence C from 7,430 to 8,670 ft.
Examination of the well cuttings and geophysical logs indicate that some thin volcanic flows less than 5 ft (1.5 m) thick occur within the sedimentary sequence. In a few places they appear to occur near the bases of fining-upward packages (cf., 7,500, 7,690, and 8,660 ft). They may be indicative of tectonic activity concomitant with volcanic activity, thus giving rise to the deposition of coarse sediments.
The sediments generally display poor to medium sorting and the rounding of the grains varies considerably. Dolomite cement is common in places. The rock also appears to be fractured. Examination of the cuttings shows abundant, thin (less than 1 mm), often straiated, lamellar pieces of rock that may represent fracture fillings. Alternatively, these peculiar but common types of chips may be produced by the grinding action of the drill bit.
At a depth of 8,680 ft, near the base of the upper sedimentary sequence, a 125-ft (38-m)-thick gabbroic sill or dike occurs. The rock is a medium- to dark-greenish-gray, very fine to fine-gained mafic rock, tentatively identified as a gabbro. It is serpentinized and deuterically altered. Epidote, both in fractures and distributed through the rock, is common, as is albite. The rock also contains sulfides up to 1%, which occur as distinct large blebs (up to 1/2 inch) or as a replacement around mineral grains. The sulfide has been tentatively identified as consisting mostly of pyrite and minor chalcopyrite. A whole-rock chemical analysis using cuttings from the interval of 8,730-8,740 ft (Table 2) shows the rock to be similar to basalt and gabbros higher up in the hole. However, the rock appears to be quite alkaline. Three K/Ar ages have been obtained for the gabbro, giving an average of 850 Ma. (Table 1) The difference in apparent age between this rock and other basalts in the hole probably is not significant.
Middle sedimentary sequence (8,806-10,840 ft)
Sedimentary rocks in the middle sedimentary sequence (between 8,806 to 10,622 ft) resemble the upper sedimentary sequence and also show similar fining-upward packages of which at least 14 can be tentatively recognized (Appendix 3). Similarly, the middle sedimentary sequence also has an interval of mafic igneous rock at its base.
Conglomerate and fine to coarse arkosic sandstone makes up the bulk of the section. Brick-red siltstone is present in minor quantities. In general, the sedimentary rocks between 8,810 ft and 10,622 ft are consistently coarser grained than those in the interval between 7,430 and 8,676 ft and display wider variations in the spectrum of grain-size in individual fining-upward packages (Figure 23). Granite-derived material dominates the sediments, and dolomite cement is common. A chemical analysis of arkose from the interval of 9,590-9,600 ft (Table 2) shows the silicic nature of the rock. The rock in this interval is apparently again quite fractured.
Within the interval between 8,800 and 9,000 ft, three prominent 5-10-ft (1.5-3-m)-thick mafic units occur. It is difficult to tell whether they are intrusive and related to the gabbro above or whether they are flows. At least another three flows or intrusives also occur between 10,400 and 10,600 ft. They have a similar thickness and are completely altered to chlorite, serpentine, epidote, and carbonate.
Although quartz and potassium feldspar are the major types of sand grains in the middle sedimentary sequence, microcline, sodium feldspar, and calcium plagioclase are more common in the interval between 8,806 and 8,950 ft, suggesting that volcanic material may at least be a local source of sediments during part of the deposition of this sequence. (These minerals are also more common in the interflow sedimentary packages in the upper volcanic-dominated sequence.)
A series of relatively thin basaltic flows (possibly up to 50 ft [15 m] thick or more) interrupt the sediments between 10,622 and 10,840 ft. The flows display considerable alteration by chlorite and epidote. Red oxidized basalt fragments are also present in cuttings throughout this 218-ft (65-m) interval and indicate the presence of many indistinguishable flows. A whole-rock chemical analysis of cuttings from the interval between 10,730 and 10,740 ft (Table 2, Figure 22) indicates that the rock is an intermediate alkaline basalt. However, the total amount of alkali is quite high. K/Ar ages were also obtained for the basalt and are given in Table 1. An average age of about 900 Ma is obtained for the basalt.
Lower sedimentary sequence (10,840-11,300 ft)
Another 500 ft (150 m) of sedimentary rocks underlie the volcanics at the base of the middle sedimentary sequence. They are again mostly conglomerates and medium- to coarse-grained arkoses derived from a nearby granitic terrain. Minor red siltstone is also present from 11,200 to 11,300 ft (T.D.). Frosted grains occur in this sequence as they do in the two other sequences described in the lower sedimentary-dominated succession in the lower part of the well. Grains of volcanic rock are more common in this sedimentary sequence and increase in abundance downward, therefore possibly indicating the presence of a flow slightly deeper than T.D. Three intervals between 10,840 and 11,300 ft coarsen upward. One interval displays no apparent trends in gain size or sorting (Appendix 3).
B. Log analysis of the Precambrian rocks
The wireline logs run in the Precambrian section of the Poersch #1 borehole are listed below, together with their units of measurement:
Gamma ray (API units)
Spontaneous potential (millivolts)
Caliper (inches)
Lithodensity:
- Formation density (grams per cubic centimeter)
- Density correction (grams per cubic centimeter)
- Photoelectric absorption index (barns per electron)
Compensated neutron (equivalent sandstone porosity units)
Sonic velocity (microseconds per foot)
Spectral gamma ray:
- Potassium (percent)
- Uranium (parts per million)
- Thorium (parts per million)
Resistivity:
- Spherically focussed (ohm-meters)
- Medium induction (ohm-meters)
- Deep induction (ohm-meters)
Examination of the log suite shows a marked concordance between curve features and lithologies observed in cuttings. The two sources of information are complementary in many ways. Drill cuttings are the most commonly available "ground truth" concerning lithologies and minerals that occur in subsurface formations, but they are sampled at 10-ft (3-m) depth intervals. They are also subject to problems of cavings, infiltration from shallower zones, differential flotation of components in the mud column, and selective cominution by the drill bit. By contrast, wireline-logging measurements have a much finer vertical resolution (generally 3 ft [1 m]) and sample the formation in-place. However, the logs are records of physical properties which are capable of alternative interpretations and can be affected significantly by adverse borehole conditions. The pooling of cuttings and log data is especially helpful in the description and interpretation of the unusual formations in the Precambrian section of the Poersch #1 borehole. Most wireline-logging operations are made in Phanerozoic sedimentary sequences, whose properties differ markedly from the igneous rocks and arkosic sedimentary rocks described in the report. A review of wireline-logging theory and a summary of experience in logging similar rock types is included as an appendix in the report. The review should prove useful both as an aid in examination of the logs which supplement this report and to clarify interpretations and assertions made in this section.
Average log responses were calculated from intervals matched with the principal rock types recognized from the examination of drill cuttings. The results are summarized in Table 3.
Table 3--Average log responses of principal rock types.
| Rock Type | ρb | Pe | φn | Δt | Rild | K | U | Th |
|---|---|---|---|---|---|---|---|---|
| Gabbro | 2.76 | 4.66 | 23.8 | 54.2 | 71 | 0.4 | 0.7 | 1.6 |
| Sulfide-rich gabbro | 2.92 | 6.17 | 25.2 | 55.1 | 86 | 0.5 | 0.8 | 1.1 |
| Basalt | 2.93 | 5.23 | 19.5 | 48.7 | 167 | 0.5 | 0.9 | 1.5 |
| Felsite | 2.85 | 4.00 | 13.4 | 116 | 0.7 | 1.7 | 7.9 | |
| Pegmatite | 2.63 | 3.21 | 6.7 | 54.9 | 346 | 2.4 | 3.6 | 11.5 |
| Arkose | 2.70 | 3.65 | 8.2 | 50.6 | 262 | 2.3 | 2.9 | 9.6 |
| Subarkose-arkose | 2.62 | 2.87 | 1.8 | 52.2 | 268 | 3.3 | 1.9 | 8.2 |
| Siltstone | 2.69 | 3.44 | 7.1 | 52.4 | 311 | 2.5 | 3.0 | 10.1 |
| ρb = bulk density (gwcc) Pe = photoelectric absorbtion index (barns per electron) φn = neutron porosity (%), using equivalent sandstone porosity Δt = sonic velocity (microseconds per foot) Rild = resistivity (deep-induction log) K = potassium (percent) U = uranium (parts per million) Th = thiorium (parts per million) |
||||||||
Examination of the average responses shows a fundamental distinction between basic igneous rocks and the remainder, which are either acid intrusives or arkosic sedimentary rocks derived from granitic sources. This basic/acid bipartite differentiation occurs repeatedly in the log summaries and crossplots shown in the following pages.
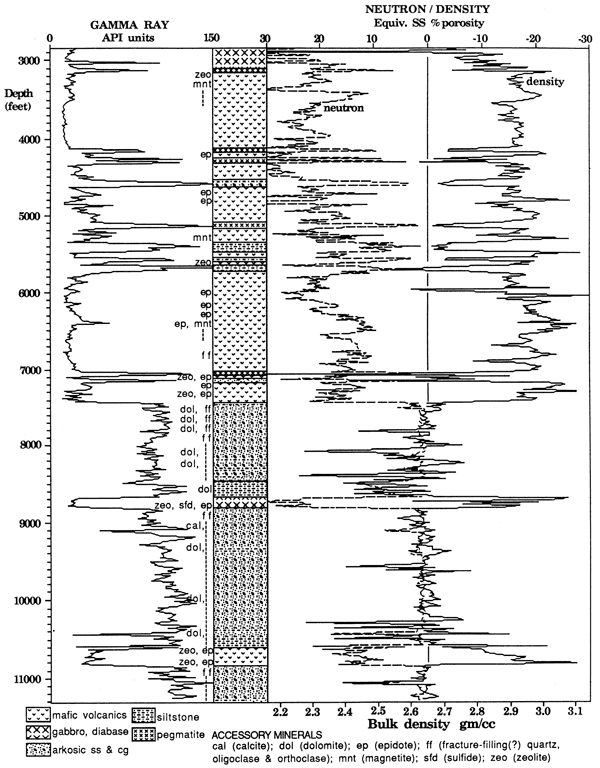
Gamma-ray density-neutron-lag (Figure 24)
The basaltic lavas of the upper volcanic-dominated succession (2,846-7,429 ft) are characterized by low gamma radiation, high density and moderate neutron porosity. All these characteristics match expectations from logging experience in other basaltic sequences. The low gamma radiation reflects the paucity of potassium, uranium, and thorium. These elements do not generally occur in isomorphic series within minerals in the early stages of fractionation, both because of the radii of their ions and lack of chemical compatibility with other common ions. Instead, relative enrichment in these elements occurs in later products of fractionation and their quantity tracks approximately with silica content (Stefansson and others, 1982). The density curve is an apparent estimate of the real density since the logging measurement is based on calibration from the electron density. However, the values recorded are probably approximately correct. Their average (2.93 gm/cc) is close to a median value of 2.87 gm/cc reported by Johnson and Olhoeft (1984), based on 323 basalt samples. The moderate neutron response averages 19.5% and shows good concordance with Tertiary basalts in Nevada (Sethi and Fertl, 1979) and Pacific crustal basalts (Anderson and others, 1984), which both average approximately 20%. As noted in the appendix log review (Appendix 5), the cause of the neutron response is bound water in the minerals, rather than free water. The basalts in this borehole appear to be extensively hydrothermally altered. The neutron curve may give direct indications of the quantitative degree of hydrothermal alteration as was demonstrated in their case study by Anderson and others (1984). In general, there appears to be a good match between zones especially rich in accessory epidote and zeolites which are marked on the central lithologic-strip log. The cause of the elevated neutron response in these and other hydrothermal minerals is the hydroxyl radical, which generates a significant "apparent porosity."
The upper volcanic-dominated succession is capped by a gabbroic intrusive which is overlain directly by Ordovician sediments. The density is significantly lower than other basic igneous rocks in the well, while its average resistivity is the lowest in the section. These characteristics combined with others (see Figure 24) suggest that this gabbro may have open-fracture systems ranging from the Ordovician unconformity down to a depth of 3,080 fL
Figure 24--Gamma-ray, neutron, density, and lithology logs in Poersch #1.
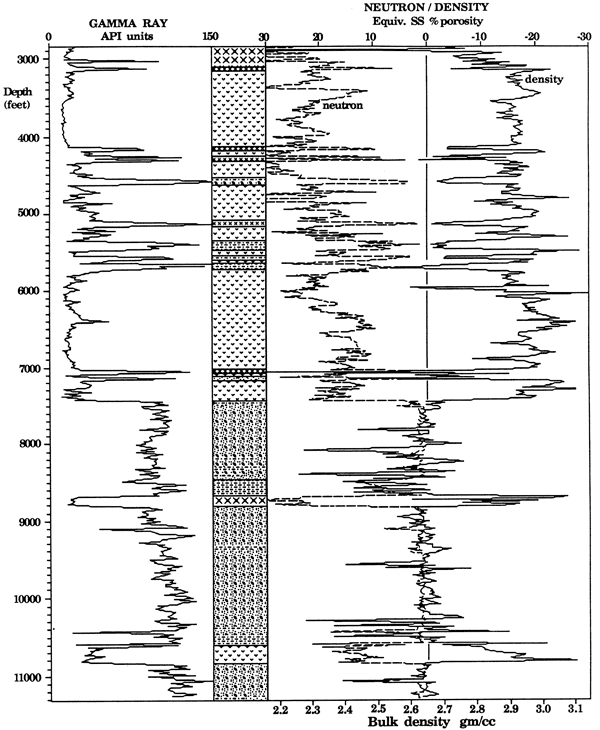
The occurrence of occasional pegmatites and arkoses in the upper section are shown clearly by increased gamma-ray responses and lowered neutron porosities and densities. The distinction between these intrusives and sedimentary rocks can sometimes be subtle. However, the pegmatites are usually marked by enhanced levels of potassium, uranium, and thorium. This can be seen in the average log values reported in Table 3, although the difference is partly muted by the uppermost two pegmatites which have anomalously low radioactivity.
The sedimentary rocks of the lower sedimentary-dominated succession (7,429-11,300 ft) are a thick sequence of subarkoses and arkoses with some minor siltstones. The granitic composition for these sediments accounts for the high gamma radiation, as will be discussed in more detail in the review of the spectral gamma-ray log. The choice of a hypothetical quartz matrix as an overlay porosity reference for both neutron and density logs is probably a reasonable approximation of the average matrix properties of these sedimentary rocks. While clearly appropriate for the quartz content, the neutron and density responses of potassium feldspars are very similar to quartz. The basic character of these curves shows that almost all of the sedimentary section has negligible porosity. A single porous zone occurs between 11,055-11,077 ft and will be discussed in more detail in the review of the resistivity logs. The neutron curve shows very little activity throughout the subarkosic sequence and averages 1.8% porosity. An exception occurs between 8,460 and 8,678 ft when the neutron log increases to a plateau feature of approximately 9% porosity equivalent. This relative enhancement in porosity is more apparent than real as is demonstrated by ft extremely high resistivities of this zone, coupled with the low, and even "negative," porosities indicated by the density log. The small increase in neutron values can be attributed to minor amounts of bound water associated with clay minerals in the shaly phase of the siltstones, minor shale, and arkosic sandstone reported from drill cuttings in this interval.
The density curve shows distinctive excursions to negative porosities" at various zones in this sedimentary sequence. These reflect the occurrence of minerals denser than the quartz reference of 2.65 gm/cc. In some cases, these may reflect the minor amounts of hematite observed in cuttings. However, the main cause appears to be the occurrence of dolomite cement. The high-density anomalies show a good depth match with dolomite-accessory occurrences noted on the central lithologic column of Figure 24.
The density log is also marked by a high-frequency sequence of "enhanced porosity" peaks in the interval between 7,950 and 8,450 ft depth and in two lower intervals (9,550-9,650 and 10,250-10,500 ft). The neutron curve is unaffected in these sections, but the caliper, SP, and resistivity curves are perturbed in a similar manner. The density-correction curve is particularly active and shows that the near detector was responding to much higher water contents than the far detector. The cumulative evidence from these separate indicators points to rapid changes in borehole diameter over relatively short distances of depth. Vertical fractures cannot be ruled out as an explanation, but the relative quiescence of the SP log (Figure 30) and the uranium curve (Figure 26) do not support this interpretation. The most consistent physical model to explain these phenomena is a highly rugose borehole section, with rapid alterations of wide and narrow diameter. The cause lies in the interaction of the drilling bit with the sedimentary rocks in these intervals. While not fully understood at this time, two possible explanations are offered which either acted singly or in concert. Rapid fluctuations of fine- and coarse-grain size may have resulted in a sequence of alternating mechanical competence. In part, the rugose zones are correlative with very coarse grained intervals that produced abundant free grains in cuttings. Perhaps these grains were easily spalled off the borehole during the drilling process. Alternatively, the degree of dolomite cementation may have been a factor. Mechanical breakdown of the carbonate cement due to strain release could also have occurred. Carbonate cements, particularly dolomite, are more brittle and softer than silica cement.
Density-neutron log crossplot (Figure 25)
This crossplot recasts the information from the density and neutron logs of the previous figure, so that distinctions and trends in lithologies can be perceived more readily. The location of average neutron and density values for the lithologies noted on Table 3 are also indexed on the plot. The fundamental bipartite nature of the rocks in this borehole is immediately apparent once again.
Figure 25--Neutron-density crossplot indexed with average responses of lithologies.
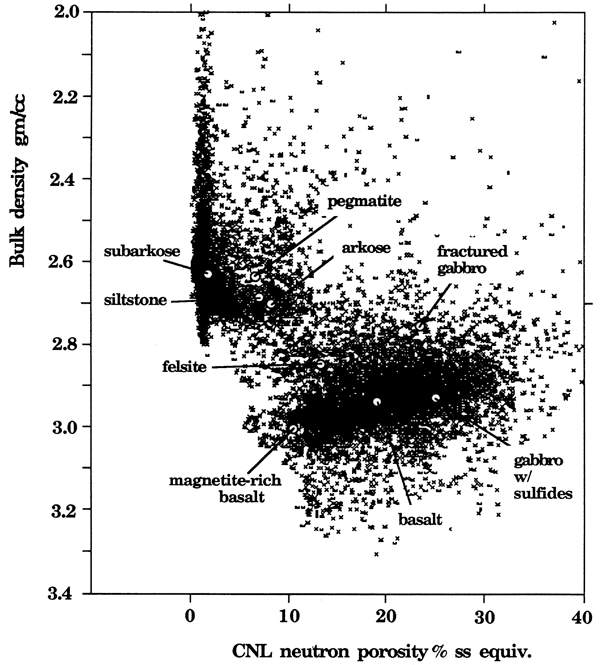
The densest basic igneous rocks are an interval of basalt which is relatively magnetite-rich (6,440-6,480 ft) and the gabbro with sulfides (8,678-8,806 ft). These meet expectations since the log densities of magnetite and pyrite are 5.08 and 4.99 gm/cc, respectively (Edmundson and Raymer, 1979). Taken as a whole, the basic igneous rocks show a distinctive trend of increasing neutron porosity with decreasing density. The possibility that the trend might be caused by the influence of increasing degrees of open fracturing was rejected after crossplots of neutron porosity against electrical conductivity and density-tool corrections failed to show any trends whatsoever. Indeed, the occurrence of significant open fractures seems to be minor, as will be discussed later in this section. Instead, the trend appears to reflect a relationship of hydrothermal alteration, not only with apparent neutron porosity, but also with density. However, the cause and effect are difficult to disentangle. The trend might imply that less basic members of the sequence were more susceptible to hydrothermal alteration. Alternatively, the original basic rocks had a similar range of densities, but hydrothermal processes have replaced primary minerals with less dense alteration products.
The other major cloud in the crossplot consists of overlapping fields matched with the pegmatites, arkoses which are interrelated with the lavas of the upper section, and subarkoses, arkoses, and siltstones of the lower section. They are all marked by lower densities and neutron porosities when compared with the basic igneous rocks. The sedimentary rocks of the lower section form a distinctive vertical cloud feature which is elongated along a neutron-porosity fine of approximately 1%. The tail of the cloud which is extended toward low densities corresponds with the intervals interpreted to be the product of excessive high-frequency borehole rugosity.
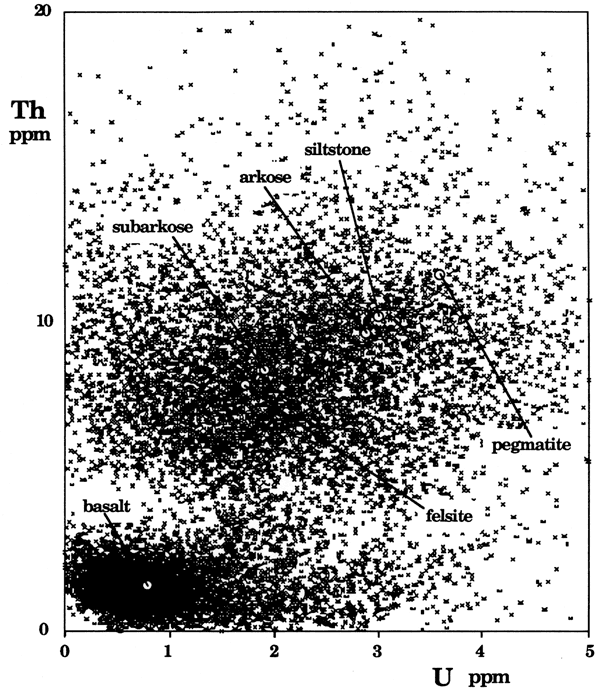
Spectral gamma-ray logs and crossplots (Figures 26, 27, and 28)
The elemental logs of the spectral gamma-ray tool represent the partition of the total formation gamma-ray emission into its principal radioactive sources. Estimates of potassium, uranium, and thorium contents are based on computer processing of counts recorded for gamma rays at various energy levels. The physics and theory of this tool are described more fully in the log review in the appendix.
As already noted, the basic igneous rocks of basalt and gabbro show low gamma radioactivity. Average concentrations of both uranium and thorium are in the order of one part per million while potassium is typically less than one percent. These observations show good agreement with laboratory measurements from outcrop and core samples of basalts from a variety of settings. As discussed earlier, the relative impoverishment in these elements is controlled by geochemistry in the early stages of fractionation.
Figure 26--Spectral gamma-ray logs in Poersch #1.
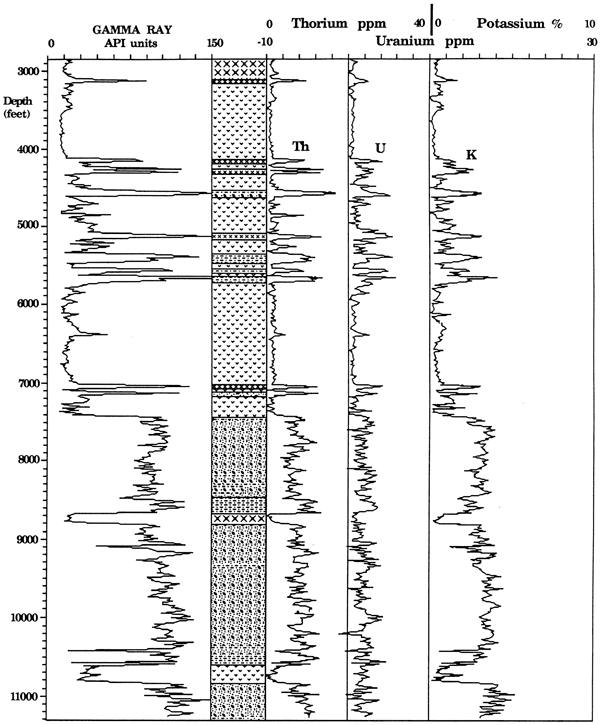
Figure 27--Thorium-potassium crossplot indexed with average responses of lithologies.
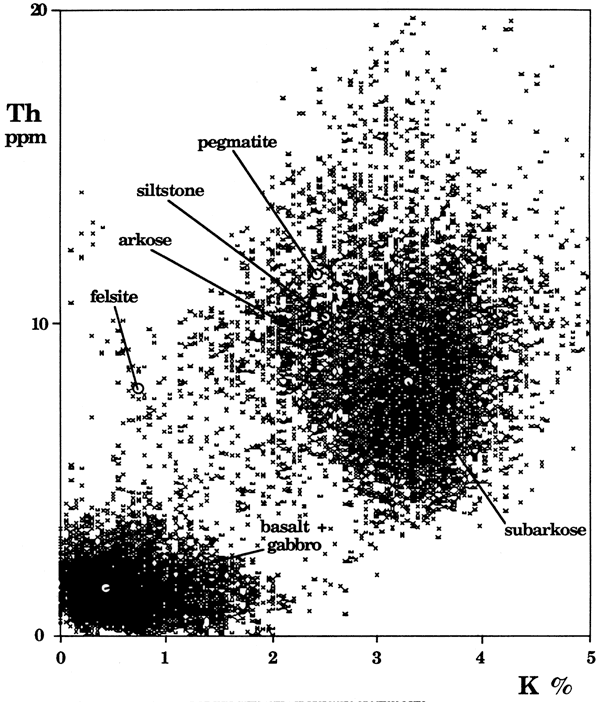
By contrast, the pegmatites, arkoses, and subarkoses have significantly higher concentrations of all three radioactive sources. The difference between these pegmatite intrusives and the arkosic sedimentary rocks is more subtle, but appears to be systematic. Discriminations are best made in the context of thorium-potassium and thorium-uranium crossplots (Figures 27 and 28). The pegmatites have distinctly higher levels of both uranium and thorium when related to the clastic units. However, the relationships involving potassium are less clear-cut. The subarkoses and arkoses in the lower section have higher concentrations of potassium than do the pegmatites of the upper section. This difference could be explained by the derivation of the subarkoses as weathered products of granitic sources which were richer in potassium feldspar than the later pegmatite intrusives. However, the arkoses of the upper section are intercalated with the basalt lavas and show potassium levels which are less than the pegmatites. This observation could be explained easily by the relative dilution in potassium content in these higher sediments through mingling of low potassium basaltic detritus with weathered granitic material. However, the hypothesis appears to be contradicted by both uranium and thorium concentrations, which are higher than those of the subarkoses in the lower section.
Figure 28--Thorium-uranium crossplot indexed with average responses of lithologies.
The spectral gamma-ray log is widely used by industry as an aid in the detection of fracture systems. Fractures can often be recognized by localized uranium spikes which are not associated with similar activity on the thorium and potassium curves. These high-uranium events have been observed on spectral-logging runs in both sedimentary and acid igneous rocks, as described in the log review (Appendix 5). Their cause is explained by the nature of the two oxidation states of uranium. Tetravalent uranium is fairly insoluble, but in oxidizing conditions is transformed to the hexavalent ion which forms soluble uranyl complexes. Fluids which migrate through fracture systems commonly carry trace amounts of uranium salts which may precipitate at fracture margins and cause a spectral gamma-ray anomaly.
The high degree of hydrothermal alteration in the basalts of the upper section implies the presence of an extensive fracture system. As will be discussed later, a variety of wireline log "fracture indicators" suggest that most of these fractures are now healed, with the exception of the uppermost gabbro. Regardless of whether the fractures are open or healed, relict uranium precipitates might be a possible useful diagnostic character for their location. However, the only significant uranium spiking in the upper section is associated with elevated levels of potassium and thorium. These events correspond to pegmatite intrusives and layers of arkose. The explanation for the lack of fracture-related uranium may be found in the geochemistry of the basaltic host rock. The relative impoverishment of these basaltic lavas as potential uranium sources could mitigate against the precipitation of significant amounts of uranium within fracture systems.
The ratio of thorium to uranium (Th/U) is sometimes used as a standardized index to gauge relative degrees of uranium fixation. Thorium and uranium are often associated geochemically but have the important distinction that thorium is only found in a poorly soluble tetravalent state, while uranium takes the form of both an insoluble tetravalent state and a soluble hexavalent one. The index, therefore, gives a useful relative measure of degree of oxidation (uranium mobilization) or reduction (uranium fixation). A log of the thorium-uranium ratio is shown in Figure 31 together with other fracture indicators. The relatively low ratio activity of the curve in the basalts of the upper section appears to show some concordance with the trends in hydrothermal minerals indicated from the neutron log. If real, these patterns would appear to show minor uranium enhancements within the fracture systems associated with hydrothermal processes. However, the total gamma-radiation count is so low in these basic rocks that any interpretation is clouded by the high measurement error of these stochastic variables.
Photoelectric absorption index (Pe) (Figure 29)
The photoelectric absorption index (Pe) is a relatively new measurement which is made in conjunction with the conventional density log. The index records the absorption of low-energy gamma rays and is a function of the aggregate atomic number (Z) of elements within the formation. This property is useful for mineral identification, particularly when used together with bulk-density and neutron-porosity logs. The photoelectric absorption is recorded in units of barns per electron. Larger values correspond to greater values of average atomic number matched with elements which are higher in the Periodic Table. A more detailed background to this measurement is given in the log review (Appendix 5) of this report.
Figure 29--Gamma-ray, photoelectric-absorption index, and sonic logs in Poersch #1.
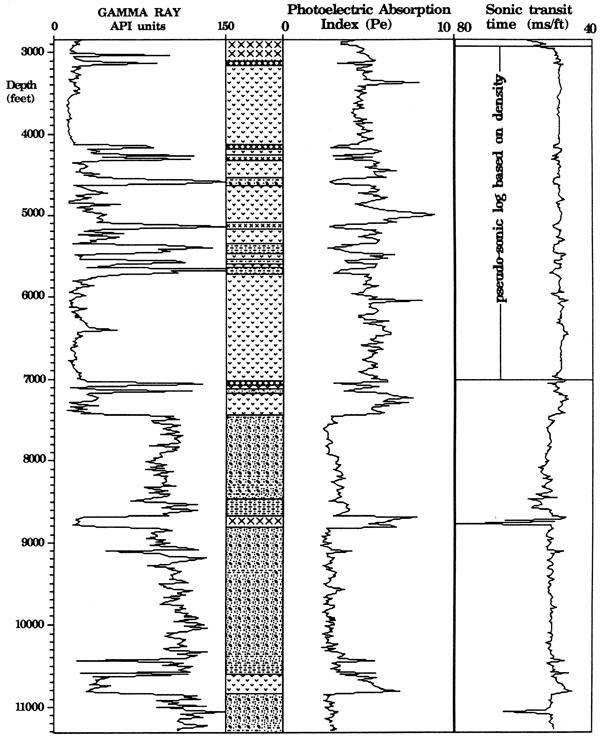
In the Poersch #1 borehole, Pe values are consistently higher in the basic igneous rocks than in either the pegmatite intrusions or arkosic sedimentary rocks. Local excursions of the curve to anomalously higher values occur within the basalts of the upper section. These are located at zones of relatively high magnetite abundance, such as between 6,440-6,480 ft. Higher values also occur within the gabbro between 8,678-8,806 ft and are probably caused by the sulfide mineralization observed in drill cuttings.
The similar mineralogy of the pegmatites and arkosic sediments results in a close match of Pe values. However, Pe curve features appear to have useful diagnostic value in the sedimentary sequence of the lower section. The long-term pattern of upward-coarsening in clastic material appears to be paralleled by generalized trends in decreasing value on the Pe log. There also seems to be a concordance between local spikes of high Pe values and horizons where cuttings are stained with hematite coatings. The close association between changes in mineralogy and photoelectric absorption was a useful aid in the analysis of sedimentation units, as described elsewhere in this report.
Sonic log (Figure 29)
The sonic tool measures the Teed of ultrasonic sound through the borehole formation. The log is recorded in units of microseconds per foot and represents a moving average of acoustic velocity. The implications of this log have been discussed earlier in the report, within the section concerning the modeling of a synthetic seismogram (section 11, part C). In general, there are only minor variations in acoustic velocity over the entire length of the pre-Phanerozoic section. This character contrasts with the "normal" variability observed in the Phanerozoic. At these shallower levels, distinctive breaks in velocity contrast the more rigid lithologies of carbonates and sandstones with the less competent shale units. Within the reservoir formations, the fluctuation of the sonic log tracks with changes in pore volume, as a consequence of the much slower transit times of pore fluids when compared with matrix minerals. In the pre-Phanerozoic, the tight character of most of the sedimentary section results in velocities that are essentially those of the mineral framework. As such, they show any minor differences with velocities which typify the igneous section. The lack of both significant shale units or appreciable porosity development results in a sluggish variation in velocity. This is controlled primarily by minor acoustic changes caused by changes in mineralogy.
Resistivity logs (Figure 30)
The resistivity logs recorded in the Poersch #1 borehole were made by medium- and deep-induction tools, together with the spherically focused device. The operation of these tools and basic concepts of rock resistivity are discussed in the log review (Appendix 5).
The resistivities of the basic igneous rocks in this borehole are generally much lower than would be expected by conventional wisdom. Some of the conductivity effect can be attributed to open fracture systems. However, these appear to be relatively localized, as discussed later in connection with "log fracture indicators." Although it is highly likely that the igneous rocks have been extensively fractured, most fractures appear to be "healed." These are not fluid-filled and would not affect the resistivity log through brine-conductivity effects.
Sources of conductivity in igneous-mineral assemblages are metallic oxides, hydroxides, and sulfides. The influence of pyrite on resistivity log was analyzed systematically by Clavier and others (1976). They showed that the magnitude of the conductivity effect was a function of both the relative abundance and degree of connectivity of pyrite grains within the rock framework. An example of sulfide conductivity effects are shown in the gabbro at depth 8,678-8,806 ft. The resistivity of the basaltic lavas in the upper section is less easily explained. Zones reported to be magnetite-rich in drill-cuttings often exhibited higher resistivities than the bulk of the section. It appears that the intergrowth of magnetite with augite precludes the development of conductive networks through the rock. However, this hypothesis does not explain the lower resistivities of the igneous rocks taken as a whole.
Hyndman and Ade-Hall (1974) noted that resistivities of oceanic-crust basalts were appreciably lower than values reported from laboratory measurements of oceanic-island and continental basalts. Basaltic samples dredged from the floor of the Indian Ocean and cores from Glomar Challenger deep-sea drilling sites were found to range between 100 and 2,000 ohm-meters. These "low" values are in stark contrast with resistivities measured in most basaltic rocks, which are between one thousand and one million ohm-meters (Bondarenko, 1968). Hyndman and Ade-Hall (1974) made careful laboratory studies of these anomalously low-resistivity oceanic-basalt samples under varying degrees of temperature and pressure. From their results, they concluded that conduction was primarily a matrix-mineral phenomenon, rather than caused by pore fluids. They noted that the presence and quantity of the primary metallic oxide phase (titanomagnetite) showed no obvious relationship with observed resistivities. Instead, the resistivity was controlled by secondary hematite and possible iron hydroxides which were disseminated through the rock. The conductivity effect was caused by fine particles of hematite produced by weathering and hydrothermal alteration of ferromagnesian minerals. The weathering of basaltic flows and extensive hydrothermal alteration are therefore suggested to account for a major source of resistivity variation within rocks of the upper section of the Poersch #1 borehole.
In general, the resistivities of the sedimentary rocks in the lower section are higher the either the basalts or gabbros. The arkosic sediments have low porosities, which average 2%. The virtual absence of a conductive pore-fluid phase explains the high resistivity. A notable exception occurs at 11,055-11,077-ft depth. Both neutron and density logs indicate a porous zone with porosities ranging up to 15%. The zone marks a significant reduction in the readings of all three resistivity logs. The deep-induction log plunges to a minimum value of 2 ohmmeters. Reconnaissance water-resistivity calculations (using the Humble form of the Archie equation) gave a value of 0.04 ohm-meters at formation temperature (188° F). If corrected to a "standard" temperature of 75° F, the formation water resistivity is 0.10 ohm-meters. This value is extremely similar to typical brine resistivities measured in Kansas Phanerozoic rocks.
Figure 30--Caliper, spontaneous potential, and resistivity logs in Poersch #1.
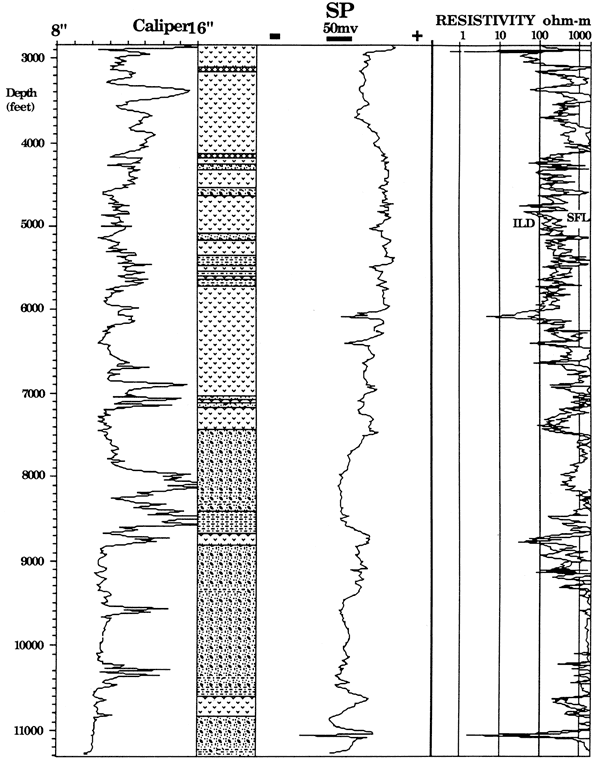
Spontaneous potential (SP) log (Figure 30)
The SP log is very useful for the distinction of porous, permeable formations from shales in normal Phanerozoic sequences, as explained in the log review (Appendix 5). However, over much of the pre-Phanerozoic section of this borehole, the SP curve shows the aimless, wandering character that is a typical response in igneous rocks and tight sedimentary sections. The spontaneous potential shows a systematic drift to more negative values with depth. This trend is commonly observed in almost all wells and reflects the influence of temperature and salinity of connate formation water. Occasionally, localized negative excursions within the basic igneous rocks are probably caused by streaming (electrokinetic) potentials associated with open fractures. However, these occur infrequently. The major length of the curve is relatively featureless when seen at the normal log-depth scale, rather than the compressed scale of this figure.
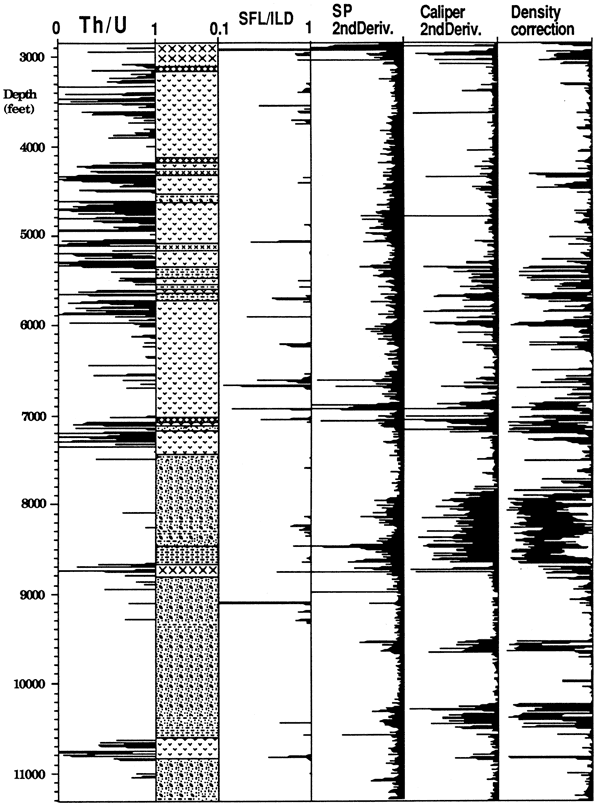
Fracture indicator logs (Figure 31)
Although no tools specifically designed to detect fractures were run in this borehole, some diagnostic indications of the presence or absence of open fractures can be deduced from various log characters. The "fracture indicator log" shows (from left to right):
- the thorium-uranium ratio, to highlight possible zones of uranium enrichment;
- the SFL/IILD ratio to display zones where the shallow-resistivity device may have been influenced by open-conductive fractures;
- the second derivative of the SP curve, to accentuate negative spiking events, possibly associated with streaming potentials;
- the second derivative of the caliper, to emphasize high-frequency borehole rugosity;
- positive values of density correction, associated with zones where the near detector appears to read higher fluid content than the far detector.
All five curves were oriented to the same convention, so that higher probabilities of fracture occurrence are matched with increasing deflections, from right to left. The concept of multiple fracture-indicator logs is described by Schlumberger (1987, p. 192). Because each indicator is influenced by a variety of borehole and formation conditions, the likelihood of fractures is contingent on patterns of multiple positive indications from these parameters. There are suggestions of occasional open-fracture zones in the igneous rocks, although most of the fracturing associated with hydrothermal alteration appear to be healed. The sympathetic variation of the caliper and density-correction curves (particularly within the sedimentary sequence) seems to reflect horizontal features of borehole rugosity caused by differences in mechanical competence of rock layers, rather than vertical fractures.
Figure 31--"Fracture indicator" logs in Poersch #1.
Prev Page--Geology || Next Page--Discussion, Conclusions
Kansas Geological Survey, Texaco Poersch #1 Report
Placed on web March 5, 2010; originally published June 1988.
Comments to webadmin@kgs.ku.edu
The URL for this page is http://www.kgs.ku.edu/Publications/OFR/1988/OFR88_22/05_petr.html