![]()
Prev Page--Introduction || Next Page--Geology
II. Regional and local geophysical modeling
A. Regional geophysical modeling
Modeling the geologic structure of the MRS has been performed by many investigators during the past two decades. Chase and Gilmer (1973) used a computer simulation to conclude that it is an aborted continental rift that would have resulted in the formation of an ocean basin if rifting had continued. They hypothesized a pole of rotation that was located in New Mexico, and they proposed that horizontal offsets between segments of the rift were caused by transform faults. While their hypothesis was favored by geophysicists in the Midcontinent for about 15 years, recent seismic-reflection work in the Lake Superior region does not support it (Cannon et al., 1988; Behrendt et al., 1988). Kevin Burke, in an address delivered at the MRS scientific-drilling conference in Duluth (1987), suggested that the MRS may be an intra-plate rift formed in response to plate-tectonic stresses caused by contemporaneous rifting or collision at a continental boundary located some distance away.
While no public-domain modeling has yet been done that includes the data from the #1 Poersch, a brief summary of pertinent modeling of gravity and magnetic profiles is included in the following paragraphs. Ocola and Meyer (1973) calculated a deep root to the MRS in Iowa and Nebraska (Figure 4). They also showed 2-3 km (1-2 mi) thickness of material with a density of 2.42 g/cc, which is characteristic of arkosic sediments that have not been highly squeezed or extensively cemented.
Figure 4--Modeling of the MRS from gravity data in Iowa and Minnesota by Ocola and Meyer (1973).
B. Local geophysical modeling
Yarger (in Hahn, 1980) proposed a similar model for the Kansas portion of the MRS, using a central core of mostly mafic material with a density of 2.9 g/cc which produced the central gravity and magnetic highs (Figure 5). Yarger's model included about 1 km (.6 mi) of low-density sediment (2.3 g/cc). A density for Precambrian-aged rift-fill sediments of 2.4 to 2.5 g/cc would lead to models containing 3-5 km (2-3 mi) of sediments.
Figure 5--Modeling of the MRS in Kansas from gravity and magnetic data by Harold Yarger (from Hahn, 1980).
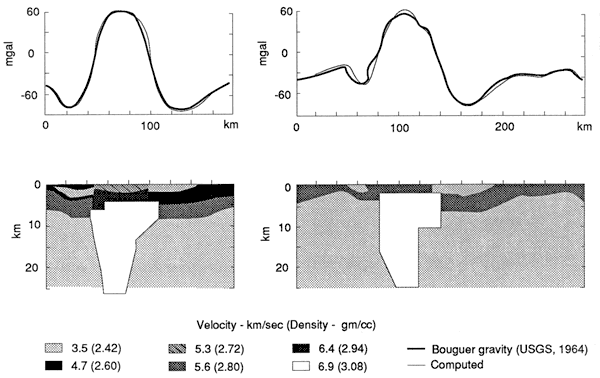
Somanas et al. (1988) used a density of 2.46 g/cc for the rift-fill sediments and consequently surmised that 3-5 km (2-3 mi) of these sediments would be necessary to fit observed gravity data (see Figure 6). Their modeling honored the gravity data, the magnetic data, and the COCORP data as interpreted by Serpa et al. (1984). Serpa et al. (1984) performed modeling only to the extent of showing the central gravity high is likely caused by rocks occurring at depths exceeding 10 km (6 mi).
Figure 6--Modeling by Somanas et al. (1988), using gravity, magnetics, and a reprocessed version of the Kansas COCORP data.
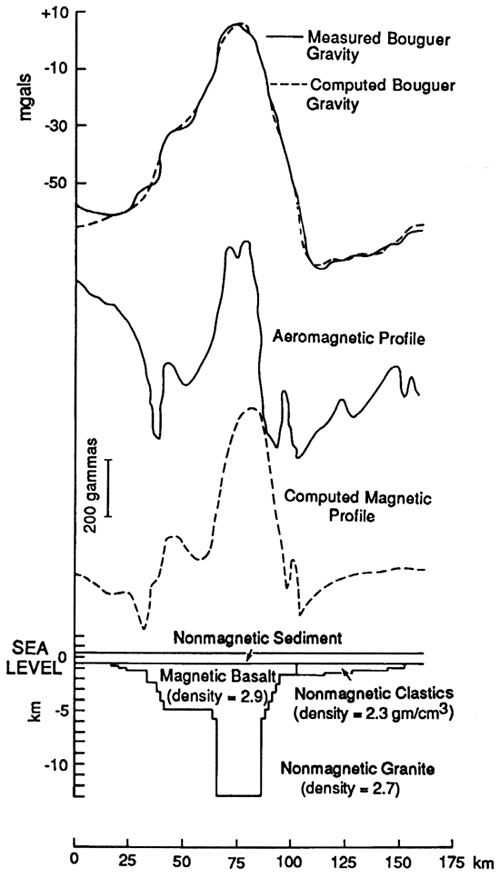
Lee and Kerr (1984) proposed that the central gravity high was caused by a pillow of rather high-density material (3.35 g/cc) at a depth of 25-40 km (15-24 mi; Figure 7). They modeled the rift-fill sediments (2.5 g/cc) as interbedded with 1/3 by volume of basalt flows with a density of 3.0 g/cc. The #1 Poersch data shown in this report show that Lee and Keff's treatment of the upper 1015 km (6-9 mi) was probably the best model, although the real-world geology, as always, is more complex and interesting than anyone's model. Their high-density rift pillow at 25-40-km (15-24-mi) depth can not be evaluated using the #1 Poersch data. Seismic-reflection data from the GLIMPCE experiment in Lake Superior (Cannon et al., 1988; Behrendt et al., 1988) do not support the Lee and Keff model for the deep part of the central rift. As always with gravity and magnetic models, a number of possible models fit the data.
Figure 7--Modeling by Lee and Kerr (1984), using gravity only.
Future modeling incorporating the #1 Poersch data, the data from the Amoco M. G. Eischeid #1 well in Carroll County, Iowa, the seismic-reflection data, and the potential-fields data will improve our understanding of the whole MRS. Also, it should be pointed out that most of the modeling done up to now has involved only the upper 15-25 km (9-15 mi). There is increasing evidence that the models should include anomalies at least as deep as the Moho (i.e. 35 km [21 mi]).
All of the regional and local geophysical modeling needs to reconcile two things. First, there is no question that a large volume of high-density material is present in the crust in the axial part of the rift. Outcrop data from the Lake Superior area and drill data from dozens of wells in the southern portion of the rift reveal high-density materials, predominantly basalts and gabbros, in the upper crust. The lateral extent of these mafic rocks generally increases from less than 50 km (30 mi) in central Kansas to more than 100 km (60 mi) in Iowa and Minnesota. Secondly, gravity lows that generally flank the gravity high on both sides are caused by substantial thicknesses of lower density rocks, including sediments of Precambrian age. These sediments reach thicknesses of as much as 3-5 km (2-3 mi) in Kansas and 10 km (6 mi) or more in Iowa.
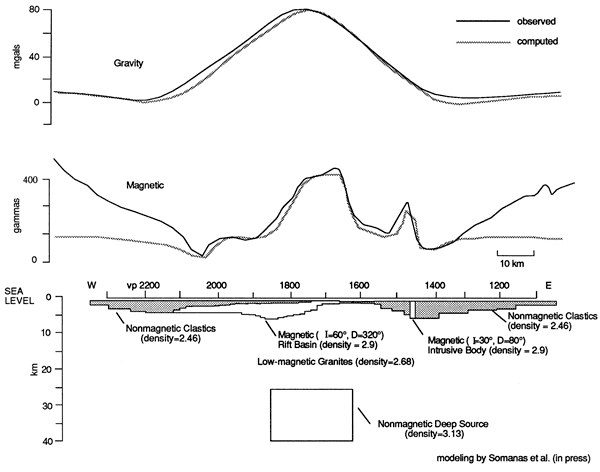
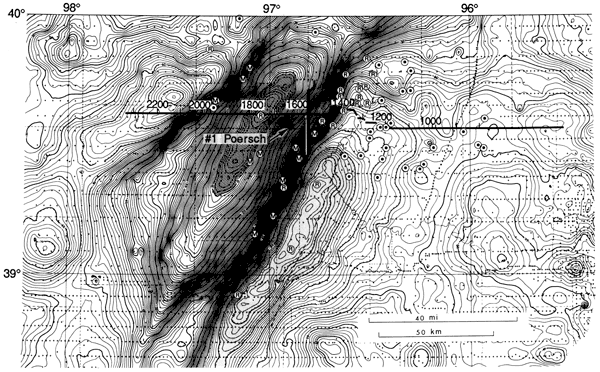
In order to put the gravity and magnetic data into perspective for the local area around the #1 Poersch, several figures are included here. Figure 8 shows the gravity and magnetic profiles along an east-west line along the section line just south of the #1 Poersch. Figure 9 shows the map location of these profiles. Figure 10 shows the gravity and magnetics profile of Figure 8 plotted on a geologic basement rock-type map as interpreted by Bickford et al. (1979). The map was sliced along an east-west line along the southern boundary of Washington and Marshall counties and pulled apart to inset the gravity and magnetic profiles. These profiles were used in conjunction with Precambrian-aged drill samples from a couple dozen wells by Bickford et al. (1979) to arrive at the geologic basement interpretation. Figures 11 and 12 from Somanas et al. (1988) show details of variation in gravity and magnetic profiles north and south of the #1 Poersch. Note that the strike of the gravity and magnetic anomalies is about N 10° E in this vicinity.
Figure 8--Gravity and aeromagnetic profiles along the southern boundary of Washington and Marshall counties, Kansas; data taken from Kansas Geological Survey files.
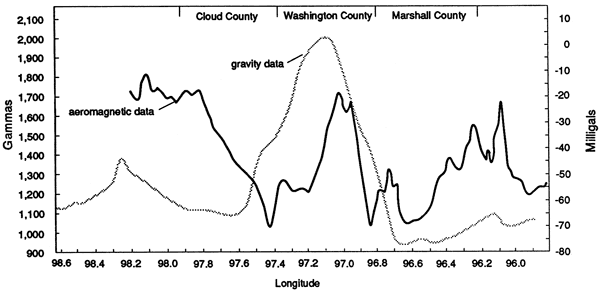
Figure 9--Location of flight line and gravity line for profiles of Figure 8 and Figure 10.
Figure 10--Gravity and magnetic profiles along southern edge of Washington and Marshall counties, Kansas. Geologic map is from Bickford et al. (1979) and is separated along the east-west line of the gravity and magnetic profiles.
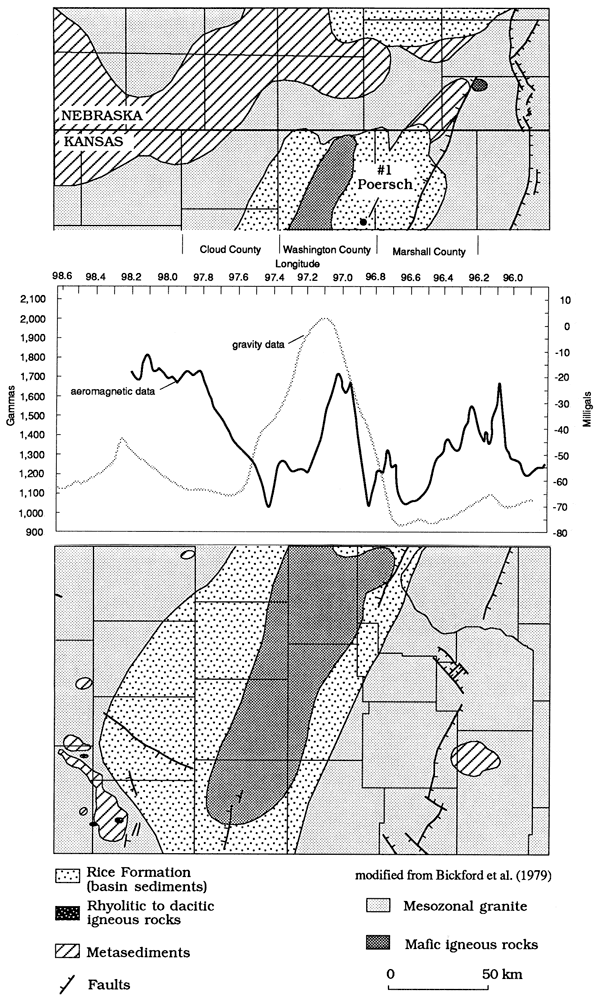
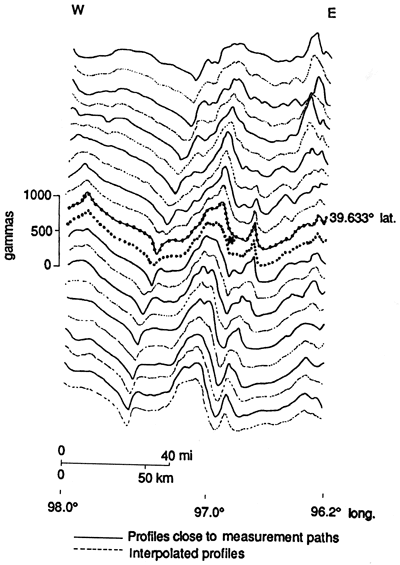
Figure 11--Gravity profiles 1 mi (1.6 km) apart in the vicinity of the #1 Poersch hole. Actual gravity values were measured at 1-mi (1.6-km) intervals on east-west lines 6 mi (9.6 km) apart. Dashed lines are interpolated to give the reader a perspective of the axial gravity high of the MRS. Location of #1 Poersch hole is shown by a star.
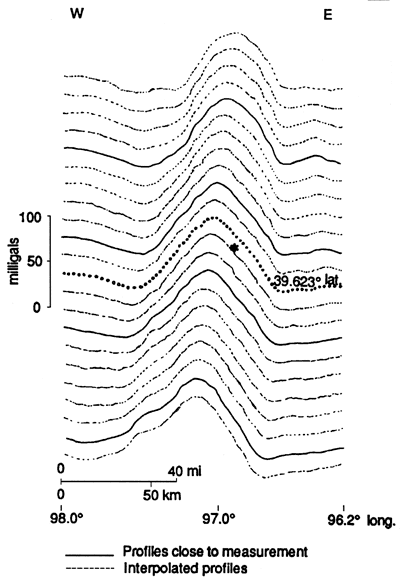
Figure 12--Aeromagnetic profiles in the vicinity of the #1 Poersch hole. Actual data were collected at intervals approximately 400 ft (120 m) apart along east-west lines spaced 2 mi (3.2 km) apart. Location of #1 Poersch is shown by a star.
COCORP Seismic data in light of #1 Poersch Data
COCORP data can be reprocessed at the Kansas Geological Survey and elsewhere, taking into account the results of analysis of the #1 Noel Poersch logs and cuttings. Figure 13 is a reprocessed version of the upper four seconds of Kansas COCORP Line 1A. Figure 14 is the upper four seconds of Kansas COCORP line 4. Figure 15 shows the locations of these seismic lines. Note that the COCORP lines pass within a few miles of the #1 Poersch.
Figure 13--Reprocessed version of Kansas COCORP line. The location of the #1 Poersch hole is projected northeastward along strike to near vibration-point 1600 of the COCORP line. The hole bottomed at a depth equivalent to a two-way travel time of about 1.4 secs. A larger PDF version is available.
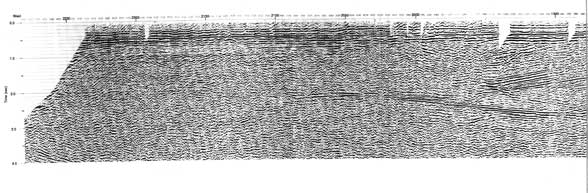
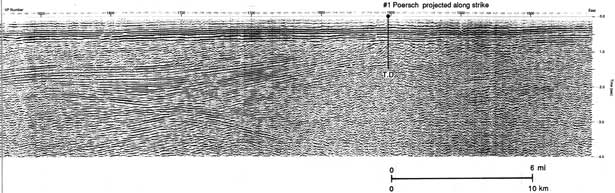
Figure 14--Orignal processed version of the north-south Kansas COCORP Line 4. A larger PDF version is available.
Figure 15--Gravity map showing location of COCORP lines 1 and 4 in relation to #1 Poersch hole. Line 4 intersects line 1 near VP 1550, which corresponds to VP 186 on line 4. Basement-rock types from Bickford et al. (1979) are shown at well locations represented by circles, with 'M' representing mafic, 'R' representing Rice formation, and dots representing rocks with various granitic affinities. A larger PDF version is available.
The COCORP lines define three sides of a structure that attracted Texaco to drill at the #1 Poersch location. Proprietary data defined the fourth side and proved closure on the structure. Note on Figure 13 that anticlinal structure is indicated between vibration points (VPs) 1560 and 1750, a distance of about 12 mi (19 km). The east flank of the structure is cut by a fault of great vertical magnitude and questionable dip near VP 1550. This anticline is visible on the original version of the processed data shown in Serpa et al. (1984) but has been enhanced here by additional processing (Figure 13).
COCORP line 4 (Figure 14) shows the southeast flank of the structure, but not so clearly, at times between 1.2 and 1.8 seconds between VPs 215 and 275, a distance of about 4 mi (6 km). Line 4 intersects Line 1 at about VP 1560, not far from the major fault mentioned in the previous paragraph. In retrospect, the COCORP data nicely suggest a structure of roughly four townships in size with about 500 msec (5,000 ft [1,500 m]) of relief in the time interval of 1 to 2 secs on the west, south, and east with no knowledge of closure to the north. Proprietary seismic data show that closure does, in fact, exist on the north side. This is a geologic structure of huge proportions by Kansas petroleum-exploration standards, or by any standards, for that matter.
Given the fact that the COCORP line locations were chosen mostly on the basis of the availability of long stretches of straight road, it is indeed fortuitous that the intersecting lines defined three sides of the Poersch dome. At this point, speculation with confidence about how many additional structures of this magnitude exist along the MRS is not possible. It is known, however, that other structures of this size are present in other segments of the rift.
The Paleozoic sediments on seismic sections can be seen to extend to times of about 400 msec throughout the area. At the Poersch site, immediately below the Paleozoic section, is a 12,000-ft (3,600-m)-thick zone of acoustically transparent material (i.e. no strong reflections are visible) that increases in thickness westward from the top of the Poersch dome to at least VP 1950, where about 10,000 ft (3,000 m) of this material are present. This zone was interpreted by Serpa et al. (1988) to be Precambrian clastics. The Poersch data show this zone to be primarily basalt with minor interbeds of sediment or other igneous rocks. The reason that these beds do not show as reflectors is that they are too thin to resolve with 20-Hz seismic energy, or they are not of sufficient lateral extent to show up consistently, or they do not have sufficient acoustic-impedance contrast to produce reflections.
Beneath the above-described transparent zone is a zone of strong reflectors that was correctly interpreted by Serpa et al. (1984) as interbedded Precambrian basalts and clastics at 16,000 ft (4,800 m) below surface.
A complex structural feature exists between VP's 1860 and 1960 at times between 1.5 and 3.0 secs (corresponding to depths between 4 km and 9 km [2-5 mi]). Serpa et al. (1984) interpreted this to be a listric normal fault after substantial discussion among authors. There is a possibility that this is a thrust fault, and the observance of compressional features on the GLIMPCE data by Behrendt et al. (1988) opens this for future discussion. At this writing this issue is being warmly debated at the KGS and elsewhere. Other possible thrust-rift (Keweenawan) faults have been observed in seismic data in Iowa (Herman et al., 1984).
To the west of VP 1960, a zone of acoustically transparent material as much as 14,000 ft (4,200 m) thick exists at reflection times from 0.8 sec to 2.2 secs. While it could be basalt, it is spatially associated with a gravity low of about 10 mgal which would be consistent with approximately 14,000 ft (4,200 m) of sediments. From a seismic-reflection standpoint, it looks very much like the sequence of basalts in the upper part of the Poersch well that have a transparent seismic signature. Neither the seismic character nor the gravity low is sufficiently diagnostic to assign a rock-type interpretation to this zone.
Although the gravity low does not totally rule out the transparent zone west of VP 1960 being composed of basalt, it makes it highly unlikely. Another possibility is that this zone is composed of sediments that were quickly and chaotically dumped into a rapidly subsiding basin. The quick subsidence could have been related to collapse into the underlying depleted basalt magma chamber. While the basin could have also formed by cooling of the rift as a whole, the cooling process would take substantially longer.
C. Synthetic seismogram
A synthetic seismogram was generated for the Poersch #1 borehole, based on the sonic (acoustic-velocity) and density logs. The model serves several purposes. It allows events on seismic-field records to be correlated with specific lithologic intervals identified from drill-cuttings and other wireline logs run in the borehole. At a secondary level, it provides useful information that may aid in the interpretation of reflections that occur at deeper levels. The computation of the model proceeds through several stages. The graphic results of each are shown together in Figure 16, and their implications are discussed below.
Figure 16--Velocity profile, reflection coefficients, and synthetic seismogram in Poersch #1.
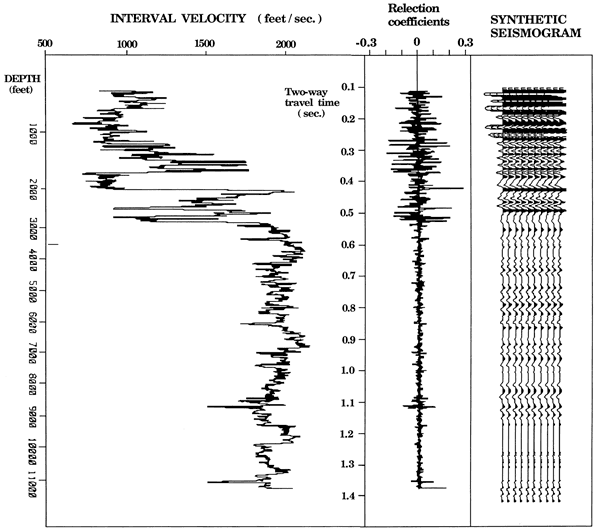
The first operation involves the transformation of the sonic log from its sample reference axis scaled in vertical feet of borehole length to a two-way travel time matched with the scale of seismic-field sections. This process is achieved through the integration of transit times recorded by the sonic log and used to graph a velocity profile (shown on the left in Figure 16). The major variability in velocity occurs in the Paleozoic section and, for the most part, expresses changes from fast velocities in relatively rigid carbonates (and some sandstones) with slower velocities in less competent shales. Smaller-scale velocity fluctuations within the rigid-framework lithologies are a function of porosity (fluid-volume) changes. Velocity contrasts within the Precambrian section are more subtle, with only minor differentiation between igneous rocks and low-porosity arkosic sediments.
Reflection magnitudes and polarities are dictated by changes in impedance, which is the product of velocity and density. The contrast between intermediate-density arkosic sediments (about 2.6 gm/cc) and high-density igneous rocks (about 2.9 gm/cc) is a significant function in difference in their impedance. However, it results in a fairly weak reflection coefficient of approximately 0.1 at interfaces between the two rock types. This character is shown by the train of subdued reflection coefficients in the Precambrian section of the reflection-coefficient profile (shown in the center of Figure 16).
While reflection coefficients of 0.1 are not exceptionally large, they are sufficient to generate detectable reflections, provided the geologic layers are of sufficient thickness.
The modeling procedure is concluded by the convolution of the reflection coefficients with a wavelet which contains a similar frequency content to the source used in seismic fieldwork. In this case, the model used a wavelet centered in a path band of 15-45 Hz. The resulting synthetic seismogram shows only weak reflection within the Precambrian section of the Poersch #1 borehole and appears to typify the acoustically transparent signature seen on seismic-field sections.
D. Local geological setting
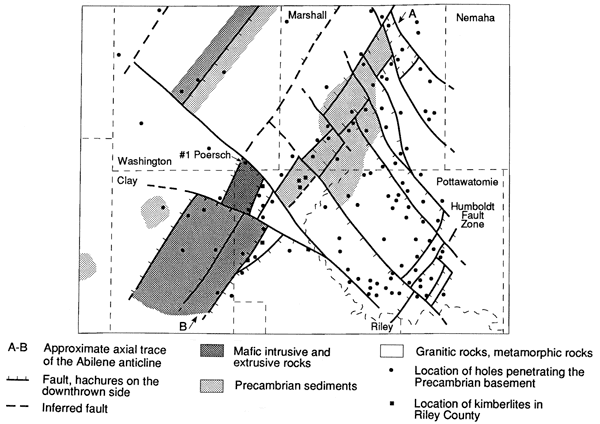
The general relationship between the geophysical anomaly and the Precambrian rock present is shown in Figure 17 (Marshall, Washington, Clay, Riley, and Pottawatomie counties). Over 100 drill holes penetrate die Precambrian surface (Cole and Watney, 1985). Most of the drill holes are in the area of the Nemaha uplift in Marshall and Pottawatomie counties (Figure 18) where depth to the basement is as little as 800 ft (240 m). By plotting the depth at which the Precambrian surface is intercepted and the rock type present, the relationship between structure and basement-rock type can be interpreted (Figure 18; see also Figure 17).
Figure 17--Base map from Bickford et al. (1979) showing Precambrian rock types and earthquake locations. Microearthquakes are depicted by solid squares and have Richter equivalent magnitudes between 1.0 and 3.3. Solid circles represent historical earthquakes with the sizes representing Modified Mercalli Intensities of VII for the largest grading downward to MM Intensity IV for the smallest circles.
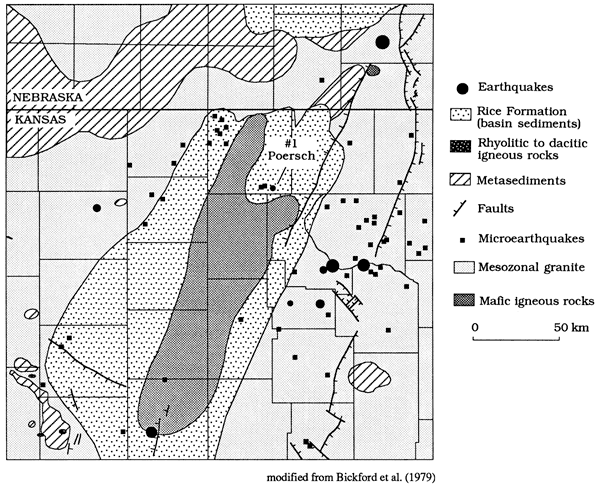
Figure 18--Tectonic map of the five counties surrounding the #1 Poersch hole. This map represents an alternative umrpretation to um map of Bickford et al. (1979). Solid circles show the locations of well control for this interpretation.
The structural history of the area is quite complex and not well understood. A brief explanation of the major structures present follows.
The Nemaha uplift is considered to be a post-Mississippian high that crosses Kansas from Nemaha County in the north to Sumner County in the South (Jewett, 1951). Prior to that time the north Kansas Basin is believed to have occupied the area. However, recent studies suggest that an ancestral Nemaha uplift existed as early as Middle Ordovician (Berendsen and Doveton, 1988). The Nemaha uplift is bounded on the east side by a series of anastomosing high-angle down to the east faults, referred to as the Humboldt fault zone (Berendsen and Blair, 1986). The Humboldt fault zone is recognized in southeast Pottawatomie County, showing a compound vertical displacement of nearly 2,000 ft (600 m).
Other previously recognized structures include the northeast-trending Abilene anticline (Jewett, 1951), which can be recognized in the basement as a down to the west fault or fault system extending from the Kansas-Nebraska border in central Marshall County southwestward into southeastern Clay County. Most of the Precambrian sediments that occur at the surface of the basement are spatially closely associated with this zone. The sediments are believed to be deposited in relatively small fault-bounded basins that protected them from later erosional processes. The southern extension of the Abilene fault system in Riley and Clay counties forms the eastern boundary of the basalt- or gabbro-dominated area. Not much vertical displacement can be recognized on the basement topography at present. The fault is partially based upon the assumption that flood basalts are related to large fractures or fault systems. Similarly, the western boundary of the mafic area is not well defined at present. However, a major fault is recognized in this location to affect rocks as young as the Pennsylvanian Heebner Shale. The fault continues in a northeasterly direction into west-central Marshall County.
Another area in which mafic rocks and Precambrian sediments are recognized occurs in Washington County. The nature of the boundary separating the two is largely inferred.
In this area, as in other areas along the rift, northwest-trending faults that cross-cut the rift are common. A prominent fault extends from northwestern Washington County to just north of the Poersch #1 borehole into southeast Riley County, where it parallels the southeast-trending arm of Tuttle Creek Lake. This fault can be traced on aeromagnetic maps farther to the southeast where it appears to coincide with mapped faults of the Bolivar-Mansfield tectonic zone in eastern Kansas and western Missouri. Within the five-county area, the fault is easily recognized by steep gradients on aeromagnetic maps; it also displaces Paleozoic sediments. Interestingly enough, a northwest-trending fault is recognized in surface rocks at the overflow area near the dam at Tuttle Creek Lake. This fault is right on trend with the mapped basement fault.
The known kimberlites are also indicated on Figure 18. Most are spatially associated with the faults of the Abilene anticline. One, the Stockdale Kimberlite, occurs along the trace of the major northwest-trending fault in Riley County. The intrusion of Cretaceous kimberlites at the intersection of two major through-going tectonic zones, and their close association with alkaline mafics, suggests that reactivation of these deep-seated faults and partial melting of a phlogopite-garnet-peridotite (Berendsen et al., 1985) took place.
Prev Page--Introduction || Next Page--Geology
Kansas Geological Survey, Texaco Poersch #1 Report
Placed on web March 5, 2010; originally published June 1988.
Comments to webadmin@kgs.ku.edu
The URL for this page is http://www.kgs.ku.edu/Publications/OFR/1988/OFR88_22/03_geop.html