![]()
Prev Page—Soil || Next Page—Reclamation
Water
by J. E. Welch, D. O. Whittemore, and D. A. Grisafe
Introduction
Approximately 11,000 miles of streams in the United States have been affected by mine drainage, primarily in the coal-mining areas of Appalachia (Martin and Hill, 1968). The acidic waters draining from coal mines are derived from the weathering of the iron sulfide minerals, pyrite and marcasite, occurring in the coal and associated shales. Mining exposes the sulfides to moist air or oxygenated surface and ground waters, causing oxidation of the sulfide to sulfate and the production of hydrogen ions, which decrease the pH of the water present. The ferrous iron released remains in solution or oxidizes to ferric iron, depending on the pH of the water. The ferric iron either forms sulfate salts in soils and on the surface (given drier conditions) or precipitates as ferric oxyhydroxides, reactions that further increase the concentration of hydrogen ions and thus decrease the pH of the water. The highly acidic waters can leach high concentrations of elements such as manganese, aluminum, and other trace metals from the shales. The precipitated ferric oxyhydroxides and sulfates coat particles in spoil material or stream beds, giving them a red to orange to yellow color. In some cases where natural waters partially neutralize acidic drainages in streams, accumulations of several inches of muddy precipitates occur. Neutralized mine drainages are often less than desirable for many uses, because they generally are extremely hard and contain high concentrations of dissolved sulfate.
In certain areas of the united States coal mining exposes coal and overburden containing appreciable pyrite, but acid mine drainage is not generated. Generally, in these areas carbonate rocks or calcareous shales and siltstones overlie the coal. The carbonate minerals present dissolve in surface waters and groundwaters, producing well-buffered solutions that can both prevent the formation of much acidic water and neutralize what is produced. In the study areas of this report, however, there are no carbonate rocks or appreciable amounts of calcite in the shales, siltstones, and sandstones (see Geology section). Thus, wherever pyrite-containing overburden and coal-processing wastes are located near the surface at the mine site, acidic drainages can form that are low in pH and high in hardness, dissolved iron, manganese, and sulfate.
The chemistry of surface waters at the mine site was examined to compare the extent and severity of acid generation and associated pollutants from unreclaimed and reclaimed mined land. Water samples were collected from 2 streams, 1 draining farm land and unreclaimed mined land and 1 draining reclaimed mined land. In addition, 2 drilled wells, 1 in unmined land and 1 in reclaimed mined land, were utilized to study and compare the recharge of shallow aquifers in unmined land and reclaimed mined land.
Experimental Procedures
To determine the effects of unreclaimed mined land on water quality, the tributary to East Cow Creek that drains the area of unreclaimed mined land (S2, Sec. 35, T. 30 S., R. 25 E.; Fig. 12) just north of the reclaimed mined land was sampled (sites W-2 to W-8). This tributary also drains Sec. 3, T. 31 S., R. 25 E. and flows into East Cow Creek in NE, SE, Sec. 4, T. 31 S., R. 25 E. The upper reaches of the tributary (not shown on Fig. 12), as well as site W-1, drain farm land and experience intermittent flow, whereas some flow was detected at sites W-7 and W-8 at all sampling times. The sample locations chosen represent a range of drainage environments that includes farm land, mined land, farm and mined land, and strip pit drainage.
Drainage from the reclaimed mined land (Field 7) was sampled at site W-10. This site is on a tributary that drains Sec. 10, T. 31 S., R. 25 E. and flows into Cow Creek in the SW, NE, Sec. 16, T. 31 S., R. 25 E. The major source of water of this tributary is strip pit overflow from the north-south-aligned strip pit at the western edge of Field 7. When the spoil banks were leveled the field was contoured to drain into the strip pit. The north half of the field drains to the south and west and the south half drains to the north and west into the pit.
East Cow Creek was sampled at site W-9 and Cow Creek at site W-11. Site W-9 was located just south of the point where the tributary draining the unreclaimed mined land flows into East Cow Creek. Sample W-11 was located just south of the point where the tributary draining the reclaimed mined land flows into Cow Creek. Sample sites W-12 and W-13 were strip pits in the reclaimed mined land.
Figure 12—Map of surface-water sampling sites and groundwater observation-well locations.
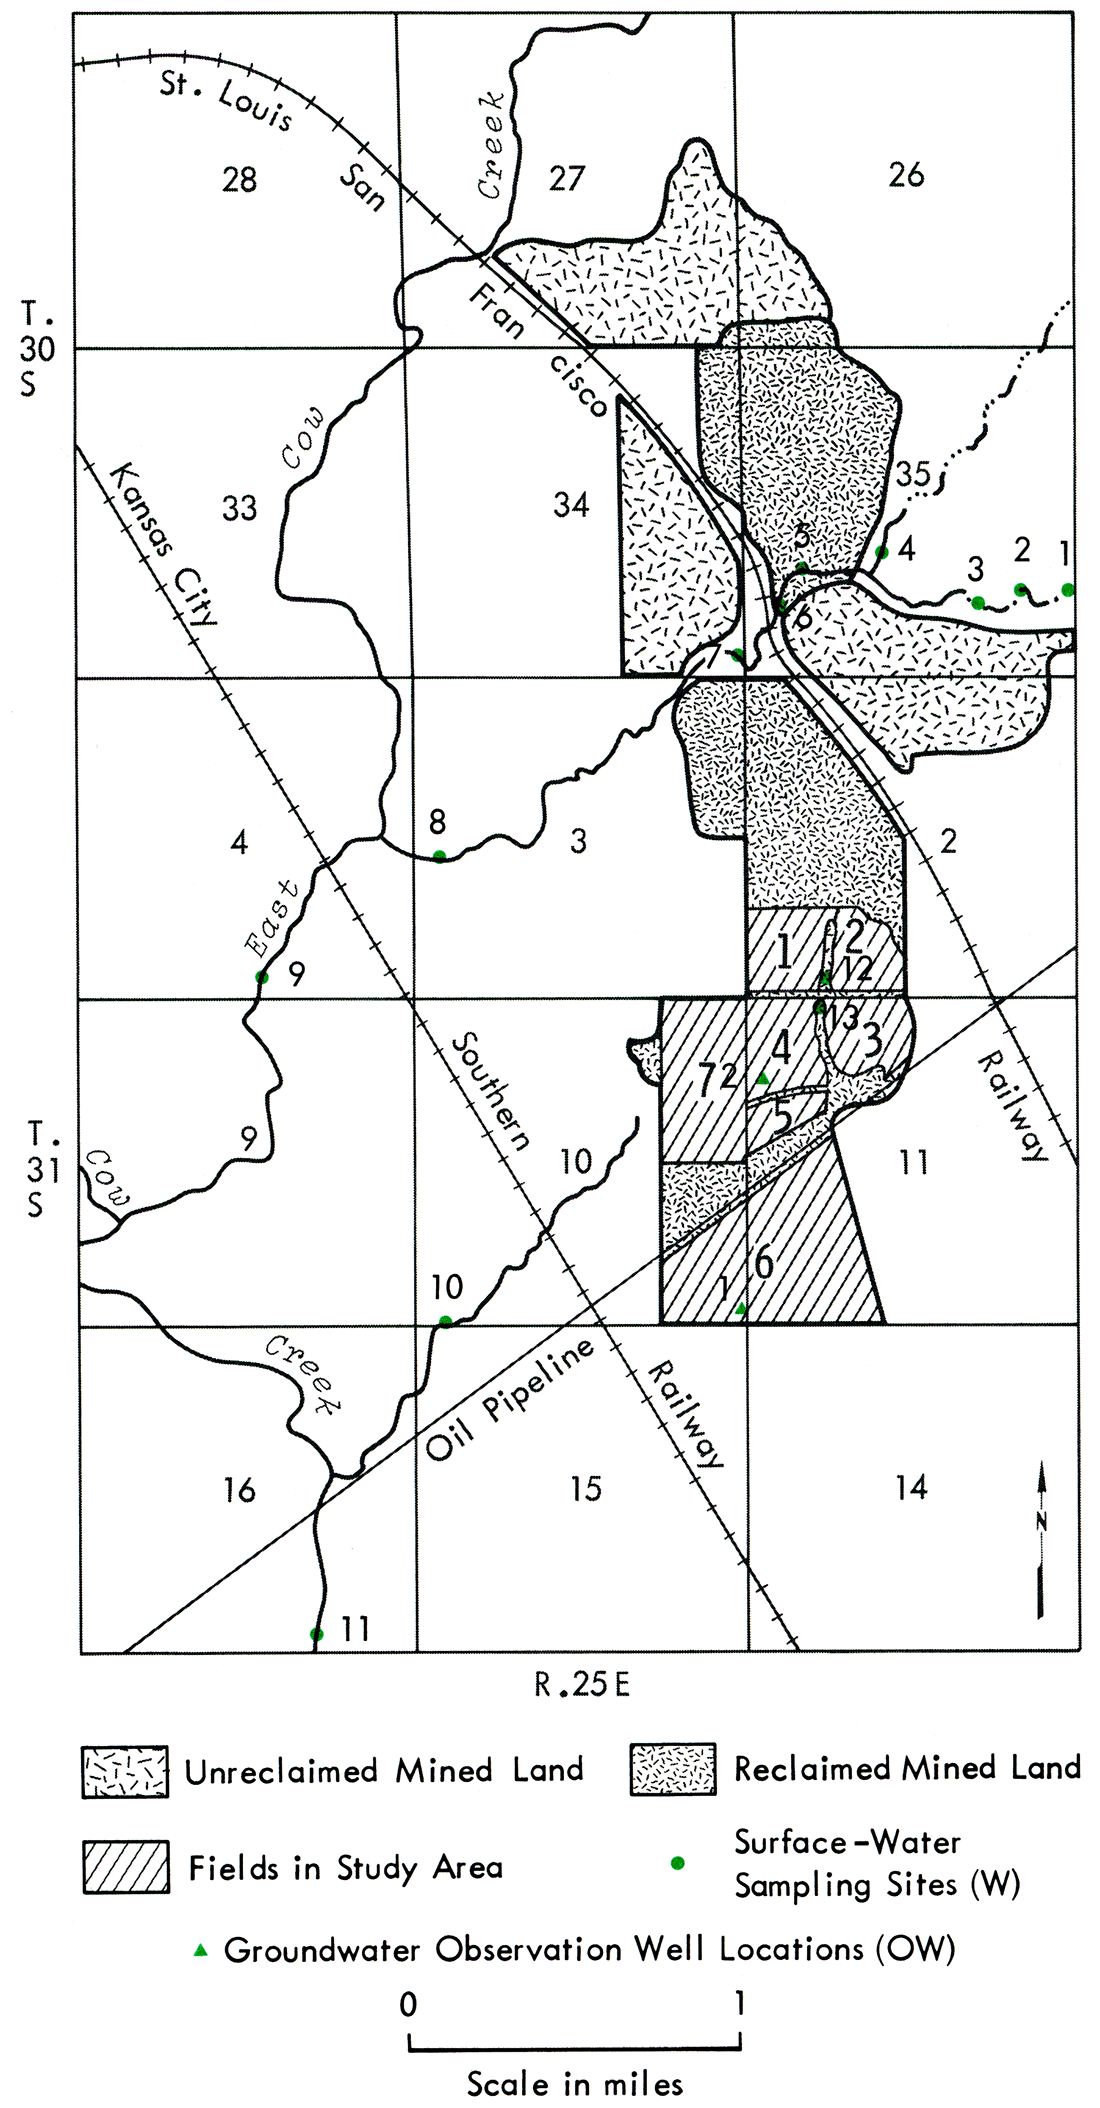
Sites W-1 and W-7 to W-11 were monitored over time to assess and compare the quality of water draining from farm land and from unreclaimed and reclaimed mined land. These data are given with the appropriate dates in Appendix H. Samples were taken at sites W-2 to W-6 only once, at the scheduled July 1976 sampling date. Sites W-2 and W-6 were sampled to determine the source of the acidity from the unreclaimed mined land, which was detected routinely at sites W-7 and W-8. Samples were taken at sites W-12 and W-13 only once to investigate and compare the effect on the water quality of the strip pits of the acid drainage observed flowing in Field 2 in the reclaimed mined land from the coal cleaning and loading area in the northeast corner of the field.
At each stream-water site flowing water was collected in 2 polyethylene bottles (250 and 1,000 ml); the smaller sample was acidified to prevent precipitation of metal cations by adding 1.0 ml of concentrated HNO3. Field measurements of pH of the non-acidified samples were obtained with a Beckman Expand-Mate pH meter. These same procedures were also used on the samples from the strip pits in the reclaimed land. All samples were analyzed by the Kansas Department of Health and Environment using the methods given in Table 26.
Table 26—Methods used for analysis of water samples.
| Determination | Method |
|---|---|
| pH | pH meter, glass-calomel electrode |
| Hardness | Titration, ethylenediaminetetraacetic acid (EDTA) |
| Calcium | Titration, EDTA, pH 12-13 |
| Magnesium | Calculation, difference between hardness (Ca + Mg) and calcium (Ca) |
| Sodium | Flame photometry |
| Potassium | Flame photometry |
| Iron | Atomic absorption |
| Manganese | Atomic absorption |
| Alkalinity | Titration, sulfuric acid |
| Chloride | Titration, mercuric nitrate |
| Sulfate | Gravimetric, barium chloride |
| Nitrate | Colorimetric, Technicon Auto Analyzer |
| Fluoride | Colorimetric, alizarin visual |
| Phosphate | Colorimetric, vanadomolybdophosphoric acid |
| Boron | Colorimetric, carmine |
| Copper | Atomic absorption |
| Lead | Atomic absorption |
| Zinc | Atomic absorption |
| Chromium | Atomic absorption |
| Cadmium | Atomic absorption |
| Silver | Atomic absorption |
| Nickel | Atomic absorption |
| Silica (SiO2) | Colorimetric, molybdosilicate |
A chemical analysis for each sample site is given in Table 27. The data for sites W-1 to W-8 represent water quality of the tributary draining farm land (W-1) and unreclaimed mined land (W-2 to W-8) on 1 day, while site W-9 represents the effect of the tributary water on the quality of water of East Cow Creek on the same day. The data for sample sites W-10 and W-11 represent drainage from reclaimed mined land and its effect on Cow Creek, respectively, on 1 day.
Table 28 is a summary of the pH values for all sites by sampling date, along with a description of the drainage environment represented by each site.
Table 27—Chemical analysis of surface-water samples. (Concentrations in ppm [mg/l], except pH.)
| Samplea | W-1 | W-2 | W-3 | W-4 | W-5 | W-6 | W-7 | W-8 | W-9 | W-10 | W-11 | W-12 | W-13 |
|---|---|---|---|---|---|---|---|---|---|---|---|---|---|
| pH | 6.0 | 4.3 | 2.8 | 5.2 | 3.2 | 2.7 | 3.0 | 3.7 | 6.7 | 6.4 | 7.1 | 3.8 | 7.1 |
| Hard.b | 100 | 481 | 1520 | 1160 | 1370 | 1640 | 1230 | 1300 | 820 | 615 | 515 | 570 | 755 |
| Ca | 28 | 84 | 240 | 268 | 288 | 312 | 228 | 256 | 172 | 141 | 114 | 132 | 192 |
| Mg | 7.3 | 66 | 224 | 120 | 158 | 210 | 161 | 161 | 95 | 64 | 56 | 59 | 67 |
| Na | 9.8 | 14 | 36 | 32 | 34 | 43 | 29 | 40 | 57 | 44 | 52 | 28 | 46 |
| K | 3.2 | 4.0 | 3.6 | 5.5 | 5.6 | 5.0 | 5.0 | 5.8 | 5.8 | 4.6 | 4.9 | 5.8 | 5.0 |
| Fe | .30 | .68 | 39 | .08 | 7.0 | 84 | 21 | .63 | .27 | .72 | 1.4 | .88 | .13 |
| Mn | .96 | 40 | 210 | 22 | 75 | 310 | 110 | 56 | 11 | 12 | 3.9 | 19 | 2.4 |
| Alkc | 12 | 8 | 0 | 14 | 0 | 0 | 0 | 0 | 38 | 20 | 82 | 0 | 44 |
| CI | 4 | 8 | 14 | 5 | 6 | 14 | 10 | 10 | 8 | 8 | 17 | 7 | 6 |
| SO4 | 107 | 560 | 2090 | 1140 | 1580 | 2420 | 1528 | 1460 | 884 | 653 | 483 | 690 | 736 |
| NO3 | .3 | .3 | 1.4 | .1 | 1.9 | 2.8 | 5.7 | .4 | 1.1 | 1.2 | 7.1 | .2 | .1 |
| F | .1 | .9 | 2.0 | .8 | 1.0 | 3.4 | 1.1 | 1.0 | .8 | .4 | .6 | .4 | .1 |
| PO4 | .16 | .09 | .01 | .07 | .07 | .01 | .05 | .06 | .09 | .17 | .7 | .01 | .01 |
| B | .07 | .09 | .11 | .12 | .13 | .15 | .13 | .20 | .18 | .13 | .21 | .18 | .12 |
| Cu | .00d | .01 | .03 | .00 | .01 | .07 | .04 | .02 | .00 | .01 | .00 | .01 | .00 |
| Pb | .00 | .02 | .02 | .02 | .06 | .04 | .04 | .02 | .02 | .00 | .02 | .00 | .00 |
| Zn | .03 | .57 | 1.3 | .13 | .80 | 6.5 | 4.0 | 2.0 | .28 | .28 | .19 | .90 | .07 |
| Cr | .00 | .00 | .01 | .01 | .01 | .01 | .01 | .00 | .00 | .00 | .00 | .00 | .00 |
| Cd | .00 | .01 | .00 | .01 | .01 | .01 | .01 | .01 | .01 | .01 | .00 | .00 | .00 |
| Ag | .00 | .00 | .00 | .00 | .0 | .00 | .00 | .00 | .00 | .00 | .00 | .00 | .00 |
| Ni | .00 | .50 | 2.9 | .10 | 1.0 | 4.3 | 1.9 | .90 | .10 | --e | -- | .37 | .05 |
| SiO2 | 12 | 29 | 54 | 5 | 23 | 48 | 27 | 18 | 12 | 11 | 11 | 2.2 | 1.3 |
| (a) Locations and dates listed below. (b) Hardness as CaCO3 (total). (c) Alkalinity as CaCO3 (total). (d) Below detection limit. (e) Not determined. |
|||||||||||||
| Sample | Location | Date | ||
|---|---|---|---|---|
| Section | Township | Range | ||
| W-1 | SE SE 35 | 30S | 25E | 07/13/1976 |
| W-2 | SE SE 35 | 30S | 25E | 07/13/1976 |
| W-3 | SW SE 35 | 30S | 25E | 07/13/1976 |
| W-4 | NE SW 35 | 30S | 25E | 07/13/1976 |
| W-5 | NW SW 35 | 30S | 25E | 07/13/1976 |
| W-6 | SW SW 35 | 30S | 25E | 07/13/1976 |
| W-7 | SE SE 34 | 30S | 25E | 07/13/1976 |
| W-8 | NW SW 3 | 31S | 25E | 07/13/1976 |
| W-9 | SW SE 4 | 31S | 25E | 07/13/1976 |
| W-10 | SW SW 10 | 31S | 25E | 05/04/1976 |
| W-11 | SW SE 16 | 31S | 25E | 05/04/1976 |
| W-12 | SW 2 | 31S | 25E | 11/17/1976 |
| W-13 | NW 11 | 31S | 25E | 11/17/1976 |
Table 28—pH values of surface-water samples.
| Sample Site |
Drainage Environment of Sample |
Date of Sample | ||||
|---|---|---|---|---|---|---|
| 11/25/1976 | 01/20/1976 | 05/04/1976 | 07/13/1976 | 11/17/1976 | ||
| Tributary of East Cow Creek | ||||||
| W-1 | Farm Land | 6.4 | 6.5 | 6.0 | ||
| W-2 | Mined Land and Farm Land | 4.3 | ||||
| W-3 | Mined Land Strip pit | 2.8 | ||||
| W-4 | Mined Land and Farm Land | 5.2 | ||||
| W-5 | Mined Land | 3.2 | ||||
| W-6 | Mined Land Strip Pit | 2.7 | ||||
| W-7 | Mined Land | 3.0 | 3.0 | 3.2 | 3.0 | |
| W-8 | Mined Land and Farm Land | 3.4 | 3.4 | 3.8 | 3.7 | |
| W-9 | East Cow Creek | 5.4 | 6.5 | 6.8 | 6.7 | |
| Tributary of Cow Creek | ||||||
| W-10 | Reclaimed Mined Land | 5.1 | 4.9 | 6.4 | ||
| W-11 | Cow Creek | 6.3 | 6.8 | 7.1 | ||
| W-12 | Reclaimed Mined Land Strip pit | 3.8 | ||||
| W-13 | Reclaimed Mined Land Strip Pit | 7.1 | ||||
Surface Water
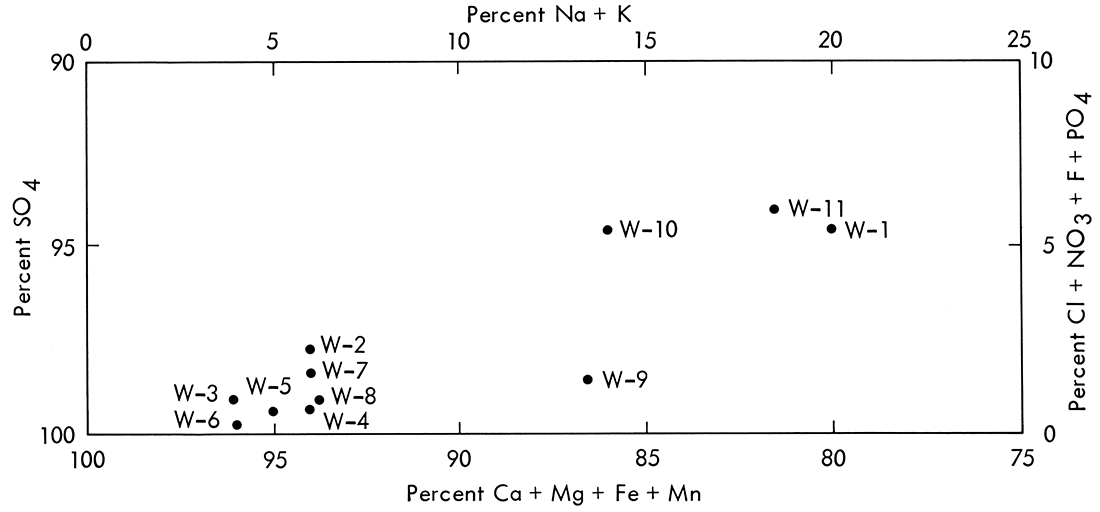
At site W-1 water flow is intermittent and drains from farm land. As shown in Table 27 and Appendix H, the water at this location has a slightly acidic pH (6-7) and low concentration of the major and minor solutes and trace elements. Downstream from site W-1 strip pit drainages from the unreclaimed mined land (seepage and overflow) enter directly into the tributary. The waters from the strip pits, sites W-3 and W-6 (Table 27), are highly acidic, extremely hard, and have very high dissolved sulfate, iron, and manganese concentrations, all of which are typical of acid mine drainage. The chemistry of the tributary is strongly influenced by these strip pit drainages, as shown by an overall decrease in water quality from sites W-1 to W-8 in Table 27 and Figure 13.
Figure 13—Modified Piper diagram of water samples from the tributary of East Cow Creek, East Cow Creek, and Cow Creek.
Surface water draining from the reclaimed mined land was appreciably better in quality than that from the unreclaimed mined land, but not of as good quality as that from the unmined land. As shown in Appendix H, site W-10 had a higher pH and a lower concentration of dissolved constituents than sites W-7 and W-8 on the May 1976 sampling dates.
The higher concentrations of nitrate and phosphorus routinely detected at site W-11 are from effluent discharged into Cow Creek from the city of Pittsburg's sewage treatment plant located approximately 3.5 miles upstream. On the November 1975 sampling date the north half of Field 7 had been leveled and planted to wheat. Active mining was still in progress in the south half of the field. Thus, the water quality at that time at site W-10 was more similar to that at sites W-7 and W-8 because of exposure of pyrite-bearing overburden. By the January 1976 sampling date the south half of Field 7 had been leveled. The high nitrate concentration in the January sample at site W-10 reflects the addition of nitrogen fertilizer to the north half of the field.
As the streams from the mined areas are mixed downstream with East Cow Creek and Cow Creek, the waters are both diluted and partially neutralized. The pH values increase and concentrations of dissolved constituents decrease at sites W-9 and W-11 as shown in Tables 27 and 28 and Figure 13. The neutralization and dilution processes occur continually at sites W-9 and W-11 (Appendix H). However, even though pH IS are near neutral and slightly alkaline at these sites, the concentrations of such dissolved species as calcium, magnesium, iron, manganese, and sulfate are still greater than those at site W-1, which represents drainage from unmined (farm) land. Additionally, the concentrations of sulfate, iron, and manganese were too high for most uses.
Variability in the composition of spoil material and the source of drainage water also greatly affected the chemistry of the water in the reclaimed mined area. Water samples at sites W-12 and W-13 (Table 28) were taken from strip pits that are almost contiguous in a north-south direction, but are separated by a gravel road. Both pits are in reclaimed mined land. Site W-13, the southern pit, has a nearly neutral pH of 7.1. The minesoil around site W-12 (Fields 1 and 2) contains an unusually large amount of pyrite on and near the surface. Also, drainage from a coal cleaning and loading site in the northeast corner of Field 2 enters the northern pit. Contents of major dissolved constituents are relatively similar, indicating that the pit at site W-13, which receives drainage from Fields 3 and 4, has a source of drainage that neutralizes acidic weathering products, a fact confirmed by the pH data for Field 3 (Table 31).
Temporal as well as spatial variability in water chemistry was pronounced at the mine site. A rise in pH and a drop in the concentrations of major dissolved species occurred at sites W-7, W-8, and W-9 on May 4 (Appendix H). During the 2 weeks prior to sampling, 4.6 inches of rain provided greater runoff for dilution and partial neutralization. This effect is also well illustrated in the surface-water-quality records for Kansas of the U.S. Geological Survey, water year 1977, for Little Cherry Creek near West Mineral, Cherry Creek near Hallowell, and Brush Creek near Weir. All of these streams drain land surface mined for coal in Cherokee County. Values of pH as low as 3.1 and sulfate concentrations as high as 1,200 milligrams per liter during low flow in Little Cherry Creek near West Mineral changed to pH 6.2 and 47 mg/l sulfate during a period of high flow.
Mine drainages affected by the weathering of pyrite are unusable or less than desirable for many uses. Present major uses of the surface waters in this area are recreation, swimming and fishing, and livestock watering, mainly of beef cattle. Low pH would first preclude the use of the waters draining from the unreclaimed mined land (sites W-7 and W-8) and from the strip pits (sites W-3, W-6, and W-12). A pH <5 is not recommended for drinking water for humans and livestock. A pH <6.5 is not recommended for water used for swimming. For fresh-water aquatic organisms a pH <5 is considered to afford a low level of protection. A pH <4 is considered to be undesirable for irrigation of acid soils such as the Parsons soil. For industrial purposes, specifically for cooling-water use, a water with a pH <6.0 with dissolved solids greater than 1,000 mg/l would cause considerable corrosion problems (National Academy of Sciences, 1973).
At the lower pH'S, dissolved concentrations of many minor and trace elements can surpass recommended or maximum permissible levels established for safe concentrations of potentially toxic substances. Recommended concentrations in irrigation waters for continuous use on all soils (National Academy of Sciences, 1973) were exceeded for iron (5.0 mg/l) at sites W-3, W-5, W-6, and W-7, fluoride (1.0 mg/l) at sites W-3 and W-6, manganese (0.2 mg/l) at all sites, zinc (2.0 mg/l) at sites W-6 and W-7, and nickel (0.2 mg/l) at sites W-2, W-3, W-5 to W-8, and W-12. Recommended concentrations in livestock water (National Research Council, 1974) were exceeded only for fluoride (2 mg/l) at site W-6.
National Secondary Drinking Water Standards (U.S. Environmental Protection Agency, 1979a) were exceeded for soluble iron (0.3 mg/l) at nearly all of the sites, but were greatly exceeded at sites W-3, W-5, W-6, and W-7. The standard for manganese (0.05 mg/l) was greatly exceeded at all sample sites, except W-1. The recommended maximum concentration for zinc (5 mg/l) was exceeded only at site W-6, while the maximum contaminant level for sulfate (250 mg/l) was greatly exceeded at sites W-2 to W-13.
Maximum contaminant levels of the National Interim Primary Drinking Water Regulations (U.S. Environmental Protection Agency, 1976) were exceeded only for fluoride and only at 2 sites, W-3 and W-6.
Regulations of the Federal water Pollution Control Act exist for the control of acid mine drainages discharged from active coal-mining areas. The U.S. Environmental Protection Agency promulgated standards based on the "best practical control technology currently available" for existing point sources in 1977 and more stringent standards for new point sources of pollution discharged to water courses. Limitations are required for total iron and manganese, total suspended solids, and pH of point sources of acid or ferruginous mine drainage, alkaline mine drainage, and effluents from coal-preparation plants and associated areas (Table 29). These limitations are not applicable to large precipitation events, which can transport great amounts of sediment in streams.
Samples from sites W-2 to W-S and W-12 do not meet the pH standard and samples from sites W-2 to W-9, W-10, and W-12 exceed the manganese standard for any 1 day. Additionally, sites W-3, W-6, and W-7 exceed the iron standard.
Dissolved manganese concentrations were always higher than iron in all the samples. Ferrous iron in solution oxidizes and precipitates as ferric oxyhydroxides at lower pHiS than for the oxidation and precipitation of manganese. This would be shown by a decrease in the iron concentration relative to that of manganese in the pH range 3 to 5. For surface waters with near-neutral pH (sites W-9, W-11, and W-13) the dissolved iron contents would be expected to be lower than the recommended drinking-water standard. For surface waters with pH <3.0 (sites W-3 and W-6) the dissolved-iron concentrations would be expected to be much higher than the standard. Most of the iron present in water with a pH near 7 would be as colloidal ferric oxyhydroxide. Manganese in water with a neutral to slightly alkaline pH would be in the process of oxidizing and precipitating, and thus would leave undesirable accumulations of dark scale if used untreated.
Table 29—Effluent limitations for the Coal Mining Point Source Category.a Concentrations (mg/liter) of pollutants that may be discharged from existing sources after application of the best practicable control technology currently available.
| Parameter | Maximum for any 1 day |
Average of daily values for 30 consecutive discharge days |
|---|---|---|
| Iron, totalb | 7.0 | 3.5 |
| Manganese, total | 4.0 | 2.0 |
| Total suspended solids | 70.0 | 35.0 |
| pH | Within range of 6.0-9.0 | |
| (a) Derived from U.S. Environmental Protection Agency (1979b) regulations. (b) Discharges of iron from new sources after application of the best available demonstrated control technology are limited to 6.0 mg/liter (maximum allowable) and 3.0 mg/liter (average of daily values for 30 consecutive discharge days). |
||
Groundwater
The condition of the shallow aquifers at the mine site was determined by measurements at 2 observation wells. One of these wells was located in unmined land (Field 6) south of the mining operation. This was observation well OW-1, which was drilled in January 1976 to a depth of 40 feet in SE, SE, SE, Sec. 10 (86 feet north of the south line of the section and 12 feet west of the east line), T. 31 S., R. 25 E. The well had a 2-inch diameter casing, perforated from 30 to 40 feet, and was sandpacked. The ground elevation was 920 feet above sea level. A pumping and recovery test on January 20, 1976, yielded a specific capacity of 0.4 gallons per minute per foot of drawdown.
Observation well OW-2 was located in SW, NW, NW, Sec. 11 (1,229 feet south of the north line of the section and 5 feet east of the west line), T. 31 S., R. 25 E., in the reclaimed mined land. This well was drilled in January 1976 to a depth of 35 feet and was sandpacked. Ground elevation was 916 feet above sea level. A pumping and recovery test in January 1976, preceding a period of virtually no rainfall, was unsuccessful, as the water table had not yet built up and risen high enough in the reclaimed mined land. A test in August 1976, taken with a 1-inch baler, yielded 0.14 gallons per minute, with little change in water level.
Recovery tests from the well in the unmined land (OW-1) showed a specific capacity value of 0.04 gallons per minute per foot of drawdown, indicating an extremely small storage capacity and a very low permeability. Inspection of the rocks indicated an extremely low porosity, and hence storativity, for these rocks. The baler test of well OW-2 in August 1976 suggested a higher storativity and transmissivity for the reclaimed mined land. The mechanical breaking of strata associated with the surface-mining process resulted in an unconsolidated material with a higher porosity and permeability compared to the unmined land.
A series of water-level measurements for these observation wells is recorded in Table 30. The rise in the elevation of the water level on March 11, 1976, in OW-2, as compared with OW-1, was attributed to recharge by direct infiltration of rain due to the greater permeability of the reclaimed mined land. Rainfall for the period September 1, 1975, to March 11, 1976, measured 15.45 inches. Prior to March 11, no water level was detected in OW-2 because the water table was building up and rising in the reclaimed mined land. Rainfall for the period March 11 to August 20, 1976, was 21.84 inches. On August 20, 1976, the elevation of the water in a nearby strip pit was the same as that in well OW-2, which indicated the water in the strip pit and the minesoil was connected. As such, the water level in the pit in the future should indicate the water level in the reclaimed mined land.
Table 30—Static water levels from land surface in observation wells. (Depth to water in feet below land surface.)
| Date | OW-1 | OW-2 |
|---|---|---|
| January 20, 1976 | 15.18 | ---a |
| March 11, 1976 | 11.66 | 16.25 |
| March 23, 1976 | 12.44 | 15.42 |
| June 2, 1976 | 15.83 | 10.58 |
| July 14, 1976 | 15.90 | 6.25 |
| August 20, 1976 | 16.04 | 6.55 |
| aNo water level detected. | ||
The lowering of the elevation of the water level in OW-1 during January through March was attributed to an interruption in the flow by cuts made during the mining operation. The rise in water level in OW-1 from June through August was attributed to flow from the reclaimed mined land. The data for OW-1 show that little, if any, water from direct rainfall reaches the water table in the unmined land. This is not unusual for an area such as southeastern Kansas that has soils with extremely clayey subsoils, which impede downward water percolation. This is one reason for the observation that, although this area receives the greatest amount of rainfall in the State, it also has the greatest amount of runoff.
Summary
Comparisons of the quality of surface waters draining the unmined land and reclaimed and unreclaimed mined land showed major differences. Water in the tributary draining the unreclaimed mined land was severely affected by strip pit drainages (overflow and seepage). The water was highly acidic, extremely hard, and had very high concentrations of most of the major and minor solutes and trace elements. The high acidity makes this water unsuitable for drinking for humans and animals, for swimming, for irrigation of the soils in the area, and for most industrial purposes.
As a result of the low pH, many minor and trace-element concentrations exceeded recommended permissible levels for various uses. Recommended concentrations in irrigation water for continuous use on all soils were exceeded for iron, manganese, nickel, zinc, and fluoride. National Secondary Water Contaminant Levels were exceeded for iron, manganese, zinc, and sulfate. Maximum Contaminant Levels of the National Interim Primary Drinking Water Regulations were exceeded only for fluoride. Effluent Limitations for the Coal Mining Point Source Category of the Federal Water pollution Control Act were exceeded or not met for pH, manganese, and iron.
Water draining from the reclaimed mined land was appreciably better in quality than that from the unreclaimed mined land, but not as good quality as water draining from the unmined land. The concentrations of iron, manganese, and sulfate were still too high for most uses.
Dilution and partial neutralization of the tributary waters draining from both the reclaimed and unreclaimed mined land occurred after mixing with water in the larger creeks that drain the area. However, even after dilution, iron, manganese, and sulfate concentrations were too high for most water uses.
Temporal variability in the water quality was also pronounced. A rise in pH and a drop in the concentrations of the major dissolved constituents occurred as a result of greater runoff from rainfall that allowed for greater dilution and neutralization.
Water-level measurements of observation wells in the unmined land and reclaimed mined land showed a relatively rapid recharge of the shallow aquifer of the reclaimed mined land by direct rainfall. This was attributed to a higher permeability of the reclaimed mined land as a result of its unconsolidated nature. The water level in the reclaimed mined land also fluctuates due to seepage from adjacent strip pits. Recharge of the shallow aquifer in the unmined land from direct rainfall was slight. Thus, the quantity of water available from reclaimed mined land will be much greater than that from unmined land in the area.
Prev Page—Soil || Next Page—Reclamation
Kansas Geological Survey, Geology
Placed on web Oct. 25, 2018; originally published 1982.
Comments to webadmin@kgs.ku.edu
The URL for this page is http://www.kgs.ku.edu/Publications/Bulletins/MRS7/06_water.html