![]()
Prev Page—Coal || Next Page—Water
Soil
by J. E. Welch and H. P. Dickey
Introduction
Surface coal mining drastically alters the natural environment in a mined area. Vegetation is removed, topographic features and characteristics are changed, and the natural soil profile is destroyed. Soil is a natural resource and in the long term its value may equal or exceed that of coal. Natural processes of soil formation are slow and can take decades to form new soil (Caspall, 1975). To has ten the process and put mined land back into productive use as quickly as possible, man implements his own land reclamation procedures and reconstructs a new soil.
One of the major problems associated with minesoils is the generation of acid from oxidation of iron sulfides in the disturbed overburden when exposed to the atmosphere. During weathering, the sulfide in pyrite and marcasite (both FeS2) oxidizes first to sulfur, releasing ferrous ions. In the next step of the oxidation, sulfur is oxidized to sulfate and hydrogen ions are produced, decreasing the pH of the soil solution. The ferrous iron will remain in solution for quite some time, as long as the soil solution is acidic (pH ≤ 4). The oxidation rate at the iron-sulfide surface depends primarily on the availability of ferric iron ions. The production of ferric ions in acid solutions is greatly facilitated by iron-oxidizing bacteria. After the acidic water leaves the sulfide mineral surfaces, the dissolved ferrous iron can oxidize and hydrolyze to precipitate ferric oxyhydroxides of hydrous ferric sulfate minerals in the soil, depending on the acid, iron, and sulfate content of the soil solution (Nordstrom and others, 1979). This process further acidifies the soil solution. Neutralization of the acid in minesoils with lime or limestone increases the oxidation rate of ferrous iron and supplies calcium, which can combine with sulfate to precipitate gypsum (CaSO4 · 2H2O). The overall reaction for the weathering of pyrite (the most common iron sulfide) and the precipitation of ferric oxyhydroxides can produce 4 moles of acidity (H+) for every mole of pyrite oxidized:
FeS2 + (7/2) H2O + (15/4) O2 → Fe(OH)3- + 2 SO42- + 4H+.
In minesoils the rate of this process is usually inversely related to the depth in the soil due to the decreasing availability of oxygen with depth. Many studies on the acidity aspect of minesoils appear in the reclamation literature (Gleason, 1979).
To date, however, little research has been done on comparing properties of minesoils to natural soils. Minesoil properties need to be compared to the properties of the natural soils to evaluate the impact of surface mining and reclamation practices on land in order to devise sound management and land-use practices on minesoils. The Clemens Coal Company site provided such an opportunity to investigate the effects of surface coal mining and reclamation on land.
Experimental Procedures
For purposes of this study, the mining area was subdivided into 7 fields. All fields and the location of sample sites within the appropriate fields, as well as type and date of sampling, are shown in Figure 10. Core samples of natural soil were obtained using a hydraulic Bull Soil Sampler equipped with a 4-foot core, 1-1/2 inches in diameter. Three core samples were taken at each site at depths of 0-16 inches, 0-4 feet, and 4-8 feet. The cores were taken at the same time the deep 4-inch cores of the rock units were bored, and were located within 2 to 3 feet of the deep bore holes. Samples below S feet were taken for x-ray diffraction analysis from the deep 4-inch core at site C-2 at 1-foot intervals from 9 to 15 feet.
Figure 10—Map of location of soil samples taken for physical and chemical analyses of minesoil. Auger samples were located 200 feet north and south of section-line road, 500 feet apart. Core sampLes were located 350 feet south of pipeline, 600 feet apart.
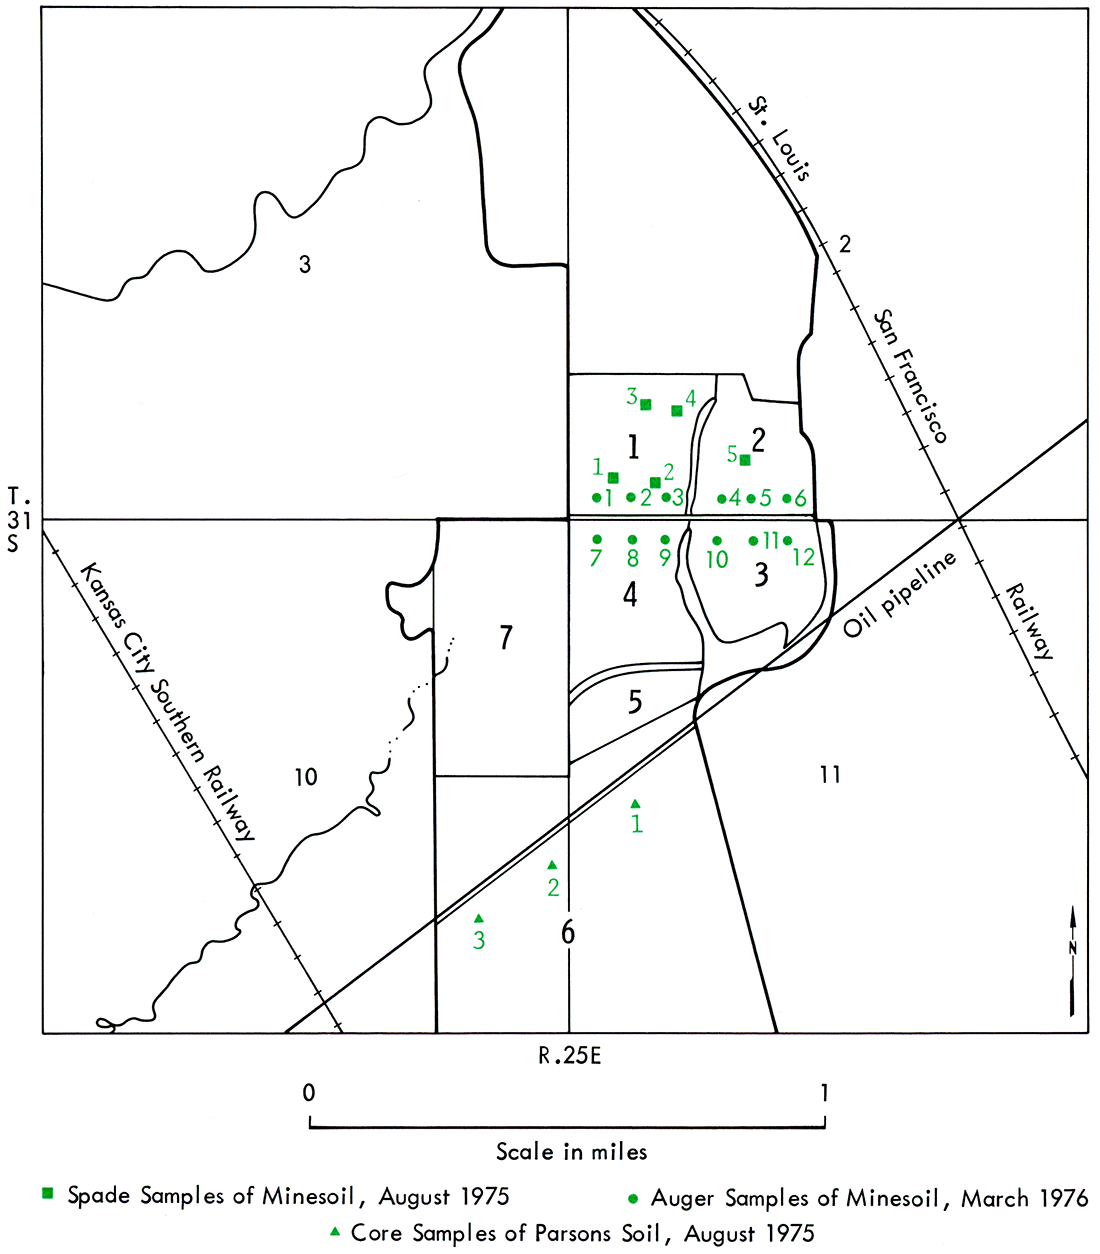
Spade samples for fertility analysis of minesoil were dug to plow depth (6 inches) with a sharpshooter spade. Each spade sample was a composite of 5 samples taken at each site around the perimeter of a circle 5 feet in diameter. Auger samples of the minesoil were taken to a depth of 40 inches using a 3-1/2-inch diameter standard hand bucket auger, or in some cases by channel sampling of the 40-inch vertical wall of a hole dug with the sharpshooter spade. Both spade and auger sampling sites selected were determined by extensive observations to be representative of the variability of the minesoil. Auger samples of the minesoil were sealed in containers at the site for later gravimetric moisture determinations.
The mineralogy of the Parsons soil and minesoil spade samples was determined by x-ray diffractometry. Samples were dried, pulverized to a fine powder, and hand packed into aluminum sample holders. All samples were examined on a Norelco diffractometer using CuKa radiation and a single-crystal monochromator.
Portions of the Parsons soil core and minesoil spade samples were sent to the Soil Testing Laboratory of the Department of Agronomy and the Cooperative Extension Service at Kansas State University for chemical analysis and fertility evaluation. Chemical analyses of minesoil auger samples were performed by the Geochemistry Section of the Kansas Geological Survey, using the procedures of the Kansas State Soil Testing Laboratory.
Procedures used in the chemical analysis of soil samples are given in Table 12. All soil samples were first air-dried, and then ground to pass a 2 mm sieve. Subsequently all chemical analyses were done on a <2 mm size fraction. Aliquots of the NH4C2H3O2 leachates used for determinations of exchangeable calcium and magnesium were made to contain 1 percent lanthanum to eliminate chemical interferences during analysis by atomic absorption. Lithium was added to give a concentration of 0.1 percent in aliquots of the NH4C2H3O2 leachates used for determinations of exchangeable calcium and potassium, to suppress ionization. Exchangeable acidity was determined by the BaCl2-triethanolamine II procedure (U.S. Department of Agriculture, Soil Conservation Service, 1972). Cation exchange capacity was calculated by summation of exchangeable bases and acidity. Base saturation was calculated by dividing the sum of the exchangeable bases by the cation exchange capacity.
Table 12—Procedures used in chemical analysis of soil samples. [Note: Procedures used by Kansas State University Soil Testing Laboratory.]
| Parameter | Extractant | Method |
|---|---|---|
| Available N | ||
| NH4 | 2N KCl 1:10 soil/solution |
Steam distillation with MgO into H3BO3 and titration with standard acid |
| NO3 | 2N KCl 1:10 soil/solution |
MgO and Devarda's Alloy, steam distillation into H3BO3 and titration with standard acid |
| Available P | 0.025N HCl and 0.03N NH4F 1:10 soil/solution (Bray Method) |
Colorimetric (Fiske-Subbarrow Method) |
| Available K | 1N NH4C2H3O 1:5 soil/solution |
Flame emission |
| Exchangeable Bases |
1N NH4C2H3O 1:5 soil/solution |
|
| Ca | Atomic absorption | |
| Mg | Atomic absorption | |
| Na | Flame emission | |
| K | Flame emission | |
| Available Micronutrients |
0.005 M DTPA 1:2 soil/solution (Lindsay method) |
|
| Zn | Atomic absorption | |
| Fe | Atomic absorption | |
| Cu | Atomic absorption | |
| Mn | Atomic absorption | |
| B | Hot water (boiling) 1:2 soil/water (Berger and Troug method) |
Colorimetric (curcurmin) |
| pH | Distilled-deionized water 1:1 soil/water |
pH meter |
| Parameter | Reagent | Method |
| Lime Requirement |
Equilibrium with SMP buffer solution 1:1:2 soil/water/solution |
pH meter |
| Organic Matter | Wet oxidation with 1N K2Cr2O7 and conc. H2SO4 1:10:20 soil/K2Cr2O7/H2SO4 (Walkley-Black Method) |
Colorimetry (qualitative) (Graham Method) |
Particle-size distribution of the <2 mm size fraction of soil was determined by the pipette method (U.S. Department of Agriculture, Soil Conservation Service, 1972). with this procedure, sand-size particles are separated from silt- and clay-size particles in suspension by wet sieving through a 300-mesh sieve (50 micron). The sand is then dried and sieved into different size fractions and weighed. The amounts of silt- and clay-size particles are determined from aliquots pipetted from a suspension held in a sedimentation cylinder, at depths dependent on the temperature of the suspension and time of settling according to Stoke's Law. After evaporating the water by oven drying at 105°C, the silt and clay are weighed and, through appropriate calculations, the amounts of total silt and clay of the sample are determined.
Particle-size distribution of the >2 mm size fraction of soil was determined gravimetrically. After drying, samples were separated into different size ranges by sieving. The material remaining on each sieve was then weighed. The distributions of the >2 mm (coarse particles) and <2 mm (fine particles) size fractions were expressed as weight percentages.
Moisture content of soil was determined by the direct gravimetric method, which measures the loss of weight of a soil sample after oven drying at 105°C. The amount of moisture was then expressed as a percent of the oven dry soil (Gardner, 1965).
Soil Types Present at the Mining Site
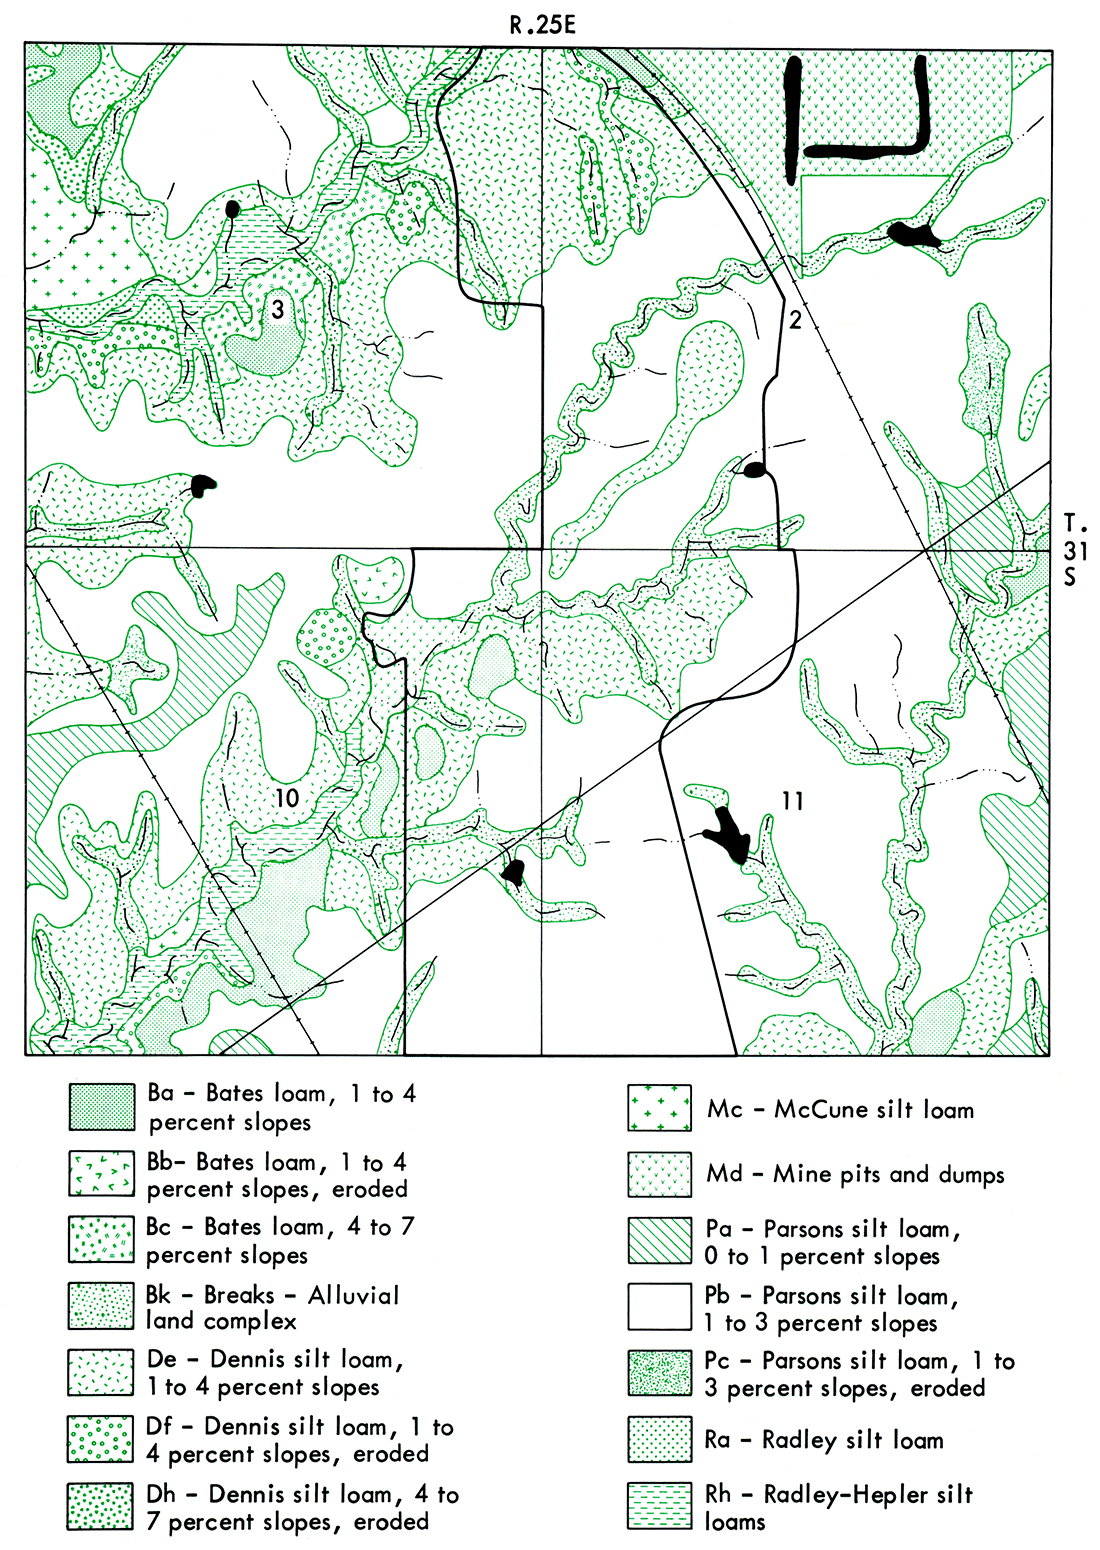
Soils present on the mining site are shown in Figure 11. The Parsons silt loam, 1 to 3 percent slopes (map symbol Pb), is the predominant soil type, with lesser amounts of Breaks-Alluvial land complex (map symbol Bk); Dennis silt loam, 1 to 4 percent slopes (map symbol De); and Bates loam, 1 to 4 percent slopes (map symbol Ba), also pres en t. The Breaks-Alluvial land complex, the Bates loam, and Dennis silt loam occupied considerably smaller acreage within the mining area, compared to the Parsons silt loam. Thus, it would have been impractical to compare such a heterogeneous mixture as minesoil to soils whose input to the minesoil was small compared to the Parsons soil. Therefore, comparisons between properties of minesoil and natural soil were based on the properties of Parsons soil. To adequately compare the properties of Parsons soil and minesoil required extensive profile sampling by depth in both the Parsons soil and minesoil.' This was done for the minesoil, but not for the Parsons soil. Therefore, other published and unpublished data on the Parsons soil were utilized.
Figure 11—Map of soils of Fields 1-7 before mining. From Soil Survey of Crawford. County, Kansas (U.S. Department: of Agriculture, Soil Conserovation Service, 1973). Scale 1:20,000.
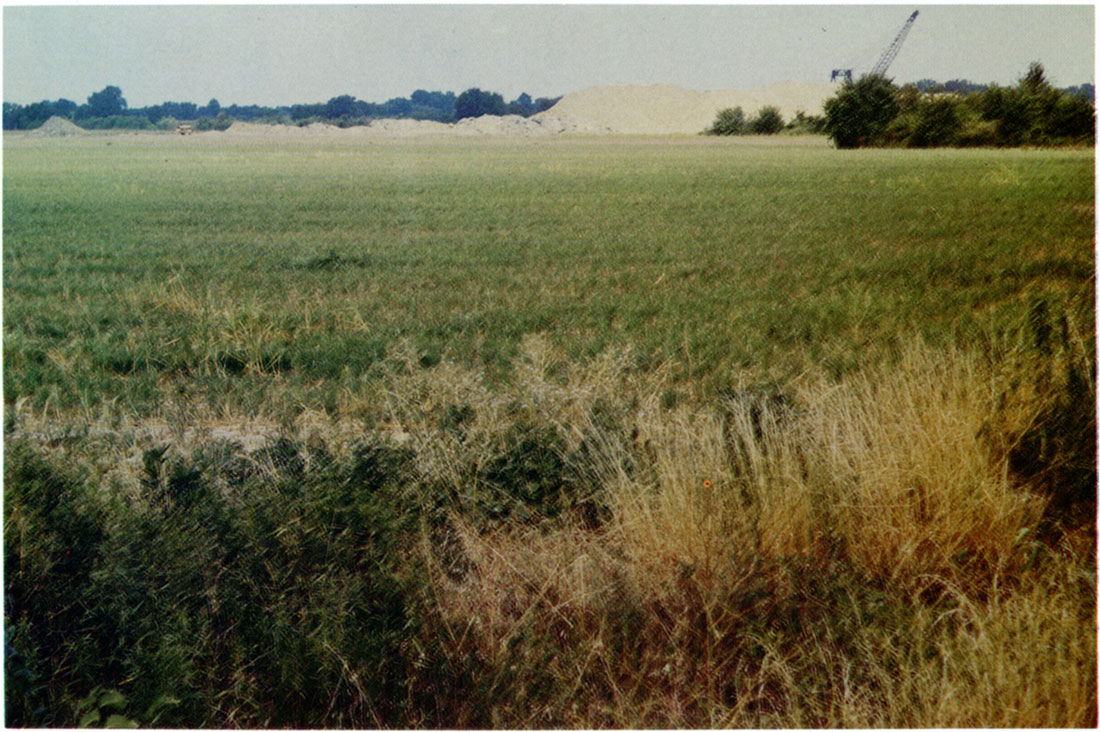
Field 6 of Figure 10 is the unmined field within the study area (also shown in Pl. 2). The 3 core profiles described from this field were of the Parsons soil and are given in Appendix C. The field descriptions of the 3 cores are very similar to each other and to the field description of the Parsons soil in Jarvis and others (1959) (see Appendix F) and the u. S. Department of Agriculture, Soil Conservation Service (1981) (see Appendix G). The same recognizable surface (A) and subsurface (B and C) horizons were present at essentially the same depths. Other diagnostic properties of horizons, such as color, texture, structure, consistence, pH, thickness, and distinctness and topography of horizon boundaries, were also essentially the same for the respective horizons. Based on field descriptions and chemical and physical data reported later in this report, the Parsons soil was classified as a fine, mixed, thermic, Mollic Albaqualf.
Plate 2—View of unmined area (Field 6) south of the mining opepation, August 1975; crop is tall fescue gpowing on the Parsons soil.
The lack of variation among the field descriptions of the Parsons soil at the 3 separate locations is not surprising when one considers that all 3 locations are in approximately the same position on the landscape. This landscape consists of nearly level, upland areas that are relatively stable and free of erosion and have been subjected to the same pattern and intensity of weathering for the same period of time. In addition, the parent material at the 3 locations is identical. The Parsons soil formed in alluvium material weathered from shale.
Properties of Parsons Soil
Mineralogy
The data from the x-ray diffraction analysis of the soil cores at depths of 0-16 inches, 0-4 feet, and 4-8 feet showed no significant differences with depth within and among the 3 cores. All the patterns indicated mainly quartz, feldspars, and clay minerals. Comparisons of these diffraction patterns to those of rock core C-2 confirmed that siltstones and shales form the parent rock of the Parsons soil. Absence of the intense, narrow, sharp peaks for the clay minerals in the soil compared to those of the rock units is due mainly to weathering of clay particles to smaller sizes and/or partial coating with mineral precipitates such as iron-manganese oxyhydroxides. Iron-manganese oxide stains were observed in the soil cores from 15-120 inches (Appendix C).
Those samples from drill cuttings obtained over the depth interval of 9-15 feet that were examined by x-ray diffraction showed a gradual increase with depth in the diffraction-line intensity for clay minerals. These results suggest an increase in clay-particle size with depth. An absence of weathering of clay particles at these depths, and/or smaller amounts of iron oxyhydroxide coatings on clay particles at these depths, would account for this observation.
From the x-ray diffraction data and the field descriptions, it was concluded that extensive weathering extended to a depth of approximately 9 feet, and that no extensive alteration of clay particles had occurred.
Chemistry
Extensive leaching results in the removal of soluble cations and anions and clay particles from surface (A) horizons and their deposition and accumulation in subsurface (B) horizons. As the more common soluble cations are leached, hydrogen and aluminum ions increase in the soil solution, causing an increase in acidity and hence lowering of pH. Chemical analysis confirms that these processes have occurred in the Parsons soil (Table 13). The pH of the surface horizon, based on data from the 0-16 inch depth of each core site, ranged from very strongly acid (4.5-5.0) to medium acid (5.6-6.0). Soluble cations such as calcium, manganese, sodium, and potassium show accumulation with depth. Less-soluble elements such as zinc, iron, copper, and manganese were concentrated more in the surface horizon. Also, the distribution of the less-soluble elements with depth in the subsoil was essentially constant. This pattern is typical of plant recycling of these trace elements. These elements are taken up by plants and deposited in the upper portion of the soil profile upon the death of the plant, where they accumulate due to their limited solubility (Tisdale and Nelson, 1975).
Fertility
The chemical analysis of the Parsons soil from the unmined field is given in Table 13. To evaluate the fertility status, the data of the 0-16 inch depth of the 3 core sites were averaged.
Table 13—Chemical analysis of the Parsons soil from the unmined area. (Analyses by the Soil Testing Laboratory, Kansas State University.)
| Samplea Site |
pH (1:1) |
Lime Requirement (lbs/ac ECC)b |
Avail. P (lbs/ac)c |
Exchangeable Bases (meq/100g)d |
Organic Matter (wt %) |
DTPAe (ppm)f |
Avail. N (ppm N) |
Avail. Bg (ppm) |
|||||||
|---|---|---|---|---|---|---|---|---|---|---|---|---|---|---|---|
| Ca | Mg | Na | K | Zn | Fe | Cu | Mn | NH4 | NO3 | ||||||
| C-1 | |||||||||||||||
| 0-16 in. | 5.4 | 3000 | 10 | 3.9 | 0.9 | 0.2 | 0.2 | 1.0 | 2.2 | 59.4 | 2.1 | 25.9 | 6.7 | 2.8 | 0.3 |
| 0-4 ft. | 6.6 | 2.9 | 0.9 | 0.4 | 0.6 | 27.8 | 0.6 | 15.1 | |||||||
| 4-8 ft. | 7.1 | 3.1 | 1.1 | 0.4 | 0.7 | 24.2 | 1.0 | 13.9 | |||||||
| C-2 | |||||||||||||||
| 0-16 in. | 5.0 | 9500 | 20 | 2.5 | 1.5 | 0.2 | 0.2 | 1.7 | 10.7 | 122.2 | 1.2 | 33.5 | 11.5 | 4.8 | 0.2 |
| 0-4 ft. | 3.9 | 3.1 | 0.7 | 0.3 | 2.7 | 55.0 | 0.6 | 35.4 | |||||||
| 4-8 ft. | 4.3 | 3.5 | 1.0 | 0.3 | 1.6 | 39.3 | 0.6 | 24.4 | |||||||
| C-3 | |||||||||||||||
| 0-16 in. | 5.8 | 2500 | 11 | 3.3 | 1.0 | 0.2 | 0.2 | 1.2 | 3.0 | 86.0 | 0.9 | 20.0 | 8.7 | 3.9 | 0.4 |
| 0-4 ft. | 5.6 | 3.5 | 1.1 | 0.3 | 0.7 | 55.0 | 0.9 | 6.0 | |||||||
| 4-8 ft. | 5.9 | 4.2 | 1.7 | 0.4 | 0.6 | 58.0 | 0.9 | 60.8 | |||||||
| (a) Core samples. (b) pounds/acre of effective CaCO3 (ECC) to raise pH to 6.8. (c) pounds/acre. (d) Milliequivalents/100 grams of soil. (e) Diethylenetriaminepentaacetic acid method. (f) parts per million (µg/g) on an oven-dry (105°C) soil weight basis. (g) Hot-water-soluble boron. |
|||||||||||||||
The exchangeable calcium and magnesium averaged 3.2 and 1.1 milliequivalents/100 grams of soil respectively. The recommended ranges of exchangeable calcium and magnesium required for adequate growth of most crops on the Parsons soil, based on recommendations of Graham (1959) and using the cation exchange capacity of 20 meq/100 grams of soil for the Parsons soil, are 13-16 meq/100 grams of soil for calcium and 1.2-2.4 for magnesium. These data show the Parsons soil to be quite low in calcium and possibly low in magnesium. However, it must be noted that adequate plant growth can occur at magnesium concentrations less than the lower limit recommended by Graham (1959), as shown by Adams and Henderson (1962). Using the recommendations of both and a cation exchange capacity of 20 meq/100 grams of soil, the concentration at which the Parsons soil would be considered low in magnesium is 0.8 meq/100 grams of soil. Magnesium may occur in soils in a somewhat slowly available form (nonexchangeable) in which it is thought to be in equilibrium with that which is exchangeable (Tisdale and Nelson, 1975). The formation of the slowly available form is favored by conditions in acid soils with expanding type clays, such as the Parsons soil. When exchangeable magnesium is low, the slowly available magnesium becomes available for plant growth (Rice and Kamprath, 1968; Christenson and Doll, 1973).
Comparisons of the average available nitrogen, phosphorus, and potassium concentrations of the Parsons soil with the recommended soil levels required for adequate growth of the major crops in Kansas (Whitney, 1976) showed the Parsons soils to also be low in these elements. Most soils contain on a total basis more than sufficient potassium (around 10 percent) for adequate plant growth. However, most of this is fixed (not available) in mineral compounds that are relatively insoluble and release potassium slowly (Tisdale and Nelson, 1975). Therefore, most soils cannot supply potassium quickly enough and in quantities sufficient for fast-growing crops. Consequently, fertilizer potassium, along with nitrogen and phosphorus, must be added to agricultural soils to produce high yields of high-quality grasses. In most uncultivated soils only nitrogen and phosphorus are the major limitations in grass production.
Concentrations of the DTPA-extractable micronutrients iron, copper, manganese, and zinc of the Parsons soil averaged 89.2 ppm (parts per million) (dry soil weight basis) for iron, 1.4 for copper, 26.5 for manganese, and 5.3 for zinc. Except for copper, these concentrations were well above the deficiency levels suggested by Lindsay and Norvell (1978) for these DTPA-extractable micronutrients. Their suggested minimum concentrations are 4.5 ppm for iron, 0.2 for copper, 1. 0 for manganese, and 0.8 for zinc. Based on these minimum concentrations, the Parsons soil should provide more than sufficient amounts of these micronutrients to plants.
The average available boron concentration of the Parsons soil indicates a possible deficiency of this element for some crops. In general, a boron concentration of <0.5 ppm (dry soil weight basis) indicates a boron deficiency. Requirements of different crops for boron vary, but the range between them is small. Therefore, the boron status of a soil should be evaluated as to the boron needs of the particular crop to be planted. For example, a concentration of 0.1 ppm boron is considered adequate for optimum growth of small grains and grasses, whereas alfalfa and clover require 0.5 ppm (Bingham, 1973). Based on the above requirements the Parsons soil should provide sufficient boron for the growth of wheat and fescue.
The organic matter content of the Parsons soil averaged 1.3 percent, which, compared to most mineral soils, is considered moderately low on a scale where <0.5 percent is very low and >4 percent is high (U.S. Department of Agriculture, Soil Conservation Service, 1975).
Comparison of properties of Parsons Soil and Minesoil
Morphology of Minesoil
Field descriptions of minesoil profiles are given in Appendix E. The most prominent characteristics of the minesoil were the absence of the well-developed and contrasting horizons that were present in the Parsons soil, and the presence of coarse shale fragments up to a maximum of approximately 50 mm in length and ranging in amounts from <5 to 25 percent. The only pedogenic development visually observed in the minesoil was the physical weathering and breakdown of shale fragments on the surface, due mostly to freeze-thaw cycles. This process is most effective in climates such as in southeast Kansas where the surface temperatures fluctuate across freezing many times each year (Birkeland, 1974). Any other pedogenic development that had occurred over the course of 1 year would also have been limited mainly to the C1 (0-6 inches) horizon. This development would probably have been physical, such as the disintegration of clods by water and roots, and the binding together of soil aggregates by plant roots.
Since the terms used to describe soil structure are intended only for describing natural aggregates in the soil ("peds"), it is not appropriate to use them to describe structure in disturbed and reconstructed soils such as minesoils, which are composed mainly of clods of the original soil structure and rock fragments. The term that is appropriate to use is "clods."
The structure of the minesoil was mostly clods, spheroidal to irregular in shape, varying in size, with many visible voids present in the C2 (6-12 inches) and C3 (12-40 inches) horizons. No voids were observed in the C1 horizon. The voids in the C2 and C3 horizons were attributed to the large volume of rock fragments in these horizons. The difference in the amount of rock fragments would not alone explain the absence of voids in the C1 horizon. However, the bulk density of the C1 horizon was observed to be greater than that of the C2 and C3 horizons. This was attributed to the filling of the void spaces in the C1 horizon by fine materials during smoothing of the minesoil and tilling of the minesoil prior to planting.
Based on field observations and chemical and physical properties determined from minesoil samples, the minesoil was classified as a loamy-skeletal, mixed, thermic Udalfic Arent. This classification characterizes a soil with little or no pedogenic horizon development, a mixed mineralogy, and a silty clay loam texture of the <2 mm size fraction, which would be found in a climate similar to that of southeast Kansas.
Mineralogy
Results from the x-ray diffraction analysis of minesoil spade samples of sites S-1 to S-5 were compared to those from C-horizons and rock units from boring C-2. The diffraction patterns were essentially identical, with all samples containing quartz, feldspars, and clays. The spade samples exhibited strong diffraction line intensities for the clay minerals kaolinite and illite almost identical to those of the C-horizons (9-15 feet) and parent siltstones and shales, which suggested that a considerable amount of the material present in the surface of the minesoil was derived from both upper and lower overburden. This was confirmed by presence in the minesoil of fragments of shale, ferruginous siltstone, sandstone, coal, and iron-manganese oxide nodules. Shale fragments varied in size, with a maximum length of 50 mm.
The x-ray diffraction patterns of minesoil spade samples of sites S-3 and S-4 also showed the presence of gypsum, often a by-product of the oxidation of pyrite. Sample sites S-3 and S-4 were in areas of Field 1 that were practically devoid of wheat and were identified as being extremely acid. Field observations of these 2 sample sites showed fragments of dark shale that contained pyrite. These shale fragments were exposed to the extremes of surface weathering and were rapidly disintegrated. The difference in the percentages of coarse particles (>2 mm) found between spade sites S-5 and the 0-6 inch depth of auger site A-4 taken in Field 2 (Appendices D and E) confirmed this disintegration. Spade sample S-5, taken in August 1975, was estimated by field observation to contain 15-25 percent coarse shale fragments, whereas the 0-6 inch depth of auger sample A-4, taken in March 1976, was found to contain only 10 percent coarse shale fragments.
Physical Properties
Particle-Size Distribution: The particle-size data from laboratory determinations of minesoil auger samples from sites A-2, A-3, A-4, A-8, and A-11 are given in Tables 14 and 15. These sites were chosen for additional laboratory analysis because they were determined from field observations of 12 auger sites to be representative of the range of particle sizes found in the minesoil. The particle-size distributions for whole minesoil samples by weight percentage with depth are given in Table 14. The particle-size distributions of the <2 mm size fraction (fine material) of minesoil samples by weight percentage with depths are given in Table 15. The <2 mm size fractions were used to determine soil texture.
Table 14—Particle-size analysis of whole minesoil samples. (Values are weight percentages.)
| Samplea Site |
Depth (inches) |
Size Class of Particles (diameter in millimeters) | |||||||||
|---|---|---|---|---|---|---|---|---|---|---|---|
| >75 | 75-20 | 20-5 | 5-2 | 2-0.074 | <0.074 | >2 | <2 | ||||
| A-2 | 0-6 | 0 | 0 | 8.3 | 13.8 | 9.3 | 68.6 | 22.1 | 77.9 | ||
| 6-12 | 0 | 1.2 | 6.8 | 5.4 | 10.9 | 75.7 | 13.4 | 86.6 | |||
| 12-40 | 0 | 4.1 | 7.8 | 4.9 | 9.6 | 73.6 | 16.8 | 83.2 | |||
| A-3 | 0-6 | 0 | .4 | 4.6 | 3.3 | 16.4 | 75.3 | 8.3 | 91.7 | ||
| 6-12 | 0 | .3 | 1.5 | 1.4 | 6.5 | 90.3 | 3.2 | 96.8 | |||
| 12-40 | 5.7 | 13.7 | 9.7 | 3.9 | 10.9 | 56.7 | 33.0 | 67.0 | |||
| A-4 | 0-6 | 0 | .3 | 3.0 | 2.8 | 9.9 | 84.0 | 6.1 | 93.9 | ||
| 6-12 | 0 | 1.8 | 4.7 | 3.2 | 10.1 | 80.2 | 9.7 | 90.3 | |||
| 12-30 | 0 | .3 | 7.0 | 7.8 | 11.8 | 73.1 | 15.1 | 84.9 | |||
| 30-40 | 0 | 2.2 | 8.3 | 4.0 | 11.9 | 73.6 | 14.5 | 85.5 | |||
| A-8 | 0-6 | 0 | 0 | 10.1 | 7.8 | 8.8 | 74.3 | 16.9 | 83.1 | ||
| 6-12 | 0 | .6 | 8.4 | 7.2 | 10.6 | 73.2 | 16.2 | 83.8 | |||
| 12-40 | 0 | 11.0 | 3.4 | 2.0 | 6.0 | 77.6 | 16.4 | 83.6 | |||
| A-11 | 0-6 | 0 | 2.3 | 6.5 | 4.4 | 10.3 | 76.5 | 13.2 | 86.8 | ||
| 6-12 | 0 | 6.7 | 8.9 | 4.8 | 6.7 | 72.9 | 20.4 | 79.6 | |||
| 12-40 | 0 | 1.2 | 8.2 | 5.3 | 8.0 | 77.3 | 14.7 | 85.3 | |||
| (a) Auger samples. | |||||||||||
Table 15—Particle-size analysis of the <2 mm size fraction of minesoil. (Values are weight percentages.)
| Samplea Site |
Depth (inches) |
Size Class of Particles (diameter in millimeters) | ||||||
|---|---|---|---|---|---|---|---|---|
| Sand | Silt (0.05-0.002) |
Clay (<0.002) |
||||||
| Very Coarse (2.0-1.0) |
Coarse (1.0-0.5) |
Medium (0.5-0.25) |
Fine (0.25-0.10) |
Very Fine (0.10-0.05) |
||||
| A-2 | 0-6 | 2.6 | 2.6 | 1.8 | 2.5 | 10.7 | 49.8 | 30.0 |
| 6-12 | 3.2 | 4.0 | 1.5 | 2.2 | 8.1 | 52.9 | 28.1 | |
| 12-40 | 3.0 | 2.5 | 1.1 | 2.4 | 10.9 | 51.5 | 28.6 | |
| A-3 | 0-6 | 2.0 | 1.8 | 9.4 | 2.1 | 13.4 | 43.3 | 28.0 |
| 6-12 | 1.1 | 1.2 | .7 | 1.3 | 13.9 | 57.1 | 24.7 | |
| 12-40 | 5.8 | 3.7 | 1.6 | 2.8 | 8.8 | 47.5 | 29.8 | |
| A-4 | 0-6 | 2.3 | 2.4 | 1.3 | 2.6 | 7.8 | 47.4 | 36.2 |
| 6-12 | 2.6 | 2.8 | 1.3 | 2.5 | 7.9 | 49.8 | 33.1 | |
| 12-30 | 3.9 | 2.9 | 1.5 | 3.1 | 9.6 | 43.5 | 35.5 | |
| 30-40 | 1.6 | 2.0 | 1.5 | 2.8 | 10.9 | 45.7 | 35.5 | |
| A-8 | 0-6 | 3.3 | 2.3 | 1.0 | 2.2 | 7.6 | 51.6 | 32.0 |
| 6-12 | 2.7 | 3.1 | 1.1 | 3.6 | 8.4 | 57.5 | 23.6 | |
| 12-40 | 2.7 | 3.4 | 1.5 | 3.3 | 8.5 | 53.1 | 27.5 | |
| A-11 | 0-6 | 3.0 | 2.6 | 1.4 | 2.9 | 7.7 | 48.2 | 34.2 |
| 6-12 | 2.4 | 1.8 | .9 | 1.8 | 5.7 | 51.5 | 35.9 | |
| 12-40 | 2.6 | 2.3 | 1.0 | 1.9 | 6.6 | 52.4 | 33.2 | |
| (a) Auger samples. | ||||||||
The particle-size distribution of whole minesoil for each size range showed variations at each site and among sites. This reflects the considerable mixing of soil and overburden that occurred during leveling and smoothing of the spoil banks. Particles in the <0.074 mm range showed the most uniform distribution with depth.
Auger sites A-2 and A-3 were located in Field 1, in low areas. At these sites, the quantity of particles >2 mm (coarse material) at depths above 12 inches ranged from 13 to 22 percent (Table 14). These figures are in good agreement with the estimated range of 15-25 percent reported from visual observations in the field (Appendix D). Compared to site A-2, site A-3 showed a larger amount of particles <2 mm in the surface 12 inches, and also had an unusually large amount of particles >20 mm, approximately the size of the smallest shale fragment observed in the field in the 12-40 inch depth. The large amount of particles <2 mm at site A-3 was attributed to the fact that the area of Field 1 where site A-3 was located had received sediment from storm runoff.
Site A-4 was located in Field 3 and was also in a low area. The particle-size distribution of whole minesoil in the 0-12 inch depth at this site was also characterized by a greater amount of particles <2 mm, and the 12-40 inch depth was characterized by a larger amount of particles >2 mm. As at site A-3, the greatest number of particles was found in the 20-5 and 5-2 mm size ranges.
The particle-size distributions of the <2 mm size fraction at sites A-3 and A-4 were not similar (Table 15). The very fine sand fraction at site A-3 averaged 13.7 percent by weight in the 0-12 inch depth, whereas at site A-4 the average was 7.8 percent. The average amount of clay in the 0-12 inch depth at site A-4 was 34.6 percent, whereas at site A-3 the average amount of clay was 26.3 percent. The amount of medium sand at site A-3 in the 0-6 inch depth was 9.4 percent compared to 1.3 percent at site A-4.
Other than the differences between sites A-3 and A-4 discussed above, the particle-size distribution in each size range of the <2 mm size fraction was more uniform with depth at each site and among sites than was the particle-size distribution of the >2 mm size fraction (Table 14). Site A-8 showed the most uniform distribution of particles with depth for both the >2 and <2 mm size fractions.
Particle-size analyses of the Parsons soil are given in Tables 16 and 17. At all depths in the Parsons soil only trace amounts of material >2 mm were detected (Table 16). Nearly all the material (98-99 weight percent) was <2 mm in diameter. The average of all minesoil sites showed 15 percent by weight of the material was >2 mm in diameter and 85 percent was <2 mm. Both the minesoil and the Parsons soil had no material >75 mm in size. Except for the <0.074 mm fraction, the minesoil had greater amounts of material present in all size fractions compared to the Parsons soil. The <0.074 mm size range of the minesoil had the greatest amounts of material at all depths. This was also the case for the Parsons soil. The size range in the minesoil that showed the greatest increase in amount of material was the 2-0.074 mm range. The particle-size data of the <2 mm size fraction of the minesoil and the Parsons soil, given in Tables 15 and 17 respectively, also show the last observation. Sand sizes of the <2 mm size fraction encompassed in the 2-0.074 mm range are very coarse, coarse, medium, fine, and a portion of the very fine sand. The data show significant differences in the amounts of material of all these sand sizes for the minesoil compared to the Parsons soil, except for fine sand.
Table 16—Particle-size analysis of whole samples of Parsons soil.a (Values are weight percentages).
| Horizon | Depth (inches) |
Size Class of Particles (diameter in millimeters) | ||||||||
|---|---|---|---|---|---|---|---|---|---|---|
| >75 | 75-20 | 20-5 | 5-2 | 2-0.074 | <0.074 | >2 | <2 | |||
| AP | 0-7 | 0 | 0 | TRb | TR | 3 | 95 | TR | 98 | |
| A21 | 7-11 | 0 | 0 | 0 | TR | 4 | 95 | TR | 99 | |
| A22 | 11-15 | 0 | 0 | 0 | TR | 4 | 95 | TR | 99 | |
| B21t | 15-20 | 0 | 0 | 0 | TR | 2 | 97 | TR | 99 | |
| B22t | 20-27 | 0 | 0 | 0 | TR | 1 | 98 | TR | 99 | |
| B3 | 27-39 | 0 | 0 | TR | TR | 4 | 94 | TR | 98 | |
| C1 | 39-52 | 0 | 0 | TR | TR | 6 | 92 | TR | 98 | |
| C2 | 52-63 | 0 | 0 | TR | TR | 8 | 90 | TR | 98 | |
| aData derived from U.S. Department of Agriculture, Soil Conservation Service (1981). (b) TR (trace)—assumed to be <1 percent by weight. |
||||||||||
Table 17—Particle-size analysis of the <2 mm size fraction of Parsons soil.a (Values are weight percentages.)
| Horizon | Depth (inches) |
Size Class of Particles (diameter in millimeters) | ||||||
|---|---|---|---|---|---|---|---|---|
| Sand | Silt (0.05-0.002) |
Clay (<0.002) |
||||||
| Very Coarse (2.0-1.0) |
Coarse (1.0-0.5) |
Medium (0.5-0.25) |
Fine (0.25-0.10) |
Very Fine (0.10-0.05) |
||||
| AP | 0-7 | .2 | .4 | .4 | 2.4 | 2.9 | 77.1 | 16.6 |
| A21 | 7-11 | .1 | .7 | .5 | 2.4 | 2.6 | 77.0 | 16.7 |
| A22 | 11-15 | .2 | 1.0 | .4 | 2.5 | 2.5 | 75.7 | 17.7 |
| B21t | 15-20 | .2 | .4 | .2 | 1.7 | 1.8 | 52.9 | 42.8 |
| B22t | 20-27 | TRb | TR | .1 | 1.5 | 1.7 | 46.0 | 50.7 |
| B3 | 27-39 | .5 | .6 | .3 | 3.5 | 3.5 | 48.4 | 43.2 |
| C1 | 39-52 | .8 | .9 | .6 | 4.4 | 4.3 | 51.0 | 38.0 |
| C2 | 52-63 | 1.6 | 1.3 | .6 | 4.7 | 4.8 | 51.9 | 35.1 |
| (a) Data from U.S. Department of Agriculture, Soil Conservation Service (1981). (b) TR (trace)—represents <0.1 percent by weight. |
||||||||
Comparison of the amounts and distribution of silt and clay in the 0-39 inch depth of the Parsons soil and the 0-40 inch depth of the minesoil showed a greater uniformity of the silt and clay distribution in the minesoil. Averaging the data over these depths showed the amount of clay in the minesoil to be essentially the same as that in the Parsons soil, 31.0 percent compared to 31.3 percent. However, the amount of silt in the minesoil was less than that in the Parsons soil, 50 percent compared to 63 percent.
Bulk Density: The bulk density of the Parsons soil increased with depth, whereas minesoil bulk density decreased with depth (Table 18). The higher bulk density of the 0-12 inch depth of the minesoil compared to that of the Parsons soil was caused by filling of void spaces by fine materials during smoothing of the minesoil and tilling of the minesoil for planting. The higher bulk density and lack of voids in the 0-12 inch depth (observed in field descriptions, Appendix E) may result in the minesoil's having a lower infiltration rate and a higher surface runoff rate than the Parsons soil. However, in time plant roots will aid the development of a crumb structure in the surface of the minesoil, thus increasing the infiltration rate and decreasing the runoff rate.
Table 18—Bulk density of Parsons soil and minesoil.
| Depth (inches) |
Parsons Soila g/cm3 |
Minesoilb g/cm3 |
|---|---|---|
| 0-6 | 1.44 | 1.45 |
| 6-12 | 1.39 | 1.44 |
| 12-40 | 1.65 | 1.20 |
| (a) Data derived from U.S. Department of Agriculture, Soil Conservation Service (1981). (b) Average of 5 sites (A-2, A-3, A-4, A-8, A-11); B.D. of the 0-6 and 6-12 inch depths determined by the sand funnel method, B.D. of 12-40 inch depth estimated from water content and porosity measurements. |
||
A substantial difference was found between the 2 soils in the 12-40 inch depth. Although the bulk density of the 12-40 inch depth of the minesoil was estimated, it compares quite well with bulk densities of spoils reported to be in the range of 1.10-1.40 g/cm3 (grams per cubic centimeter) (Power and others, 1978). The lower bulk density of the minesoil at this depth indicated the presence of large voids, a fact confirmed by field descriptions of the minesoil (Appendix E). The presence of large voids at this depth will aid deeper root penetration in the minesoil. The Parsons soil has an extremely firm silty clay subsoil layer, as indicated by the bulk density of 1.65 g/cm3 in the 12-40 inch depth (horizons B21t, B22t, and B3), which is difficult for roots to penetrate.
This layer impedes water percolation in the Parsons soil, resulting in a temporary perched water table above the layer during periods of prolonged rainfall (Miller, 1973). Since this layer is not present in the minesoil, water should percolate faster through the minesoil, allowing for quick access to fields after rainfall. With time, the percolation rate of the minesoil should increase as the large voids in the subsoil become interconnected to the smaller voids of the surface from the penetration of plant roots.
Water-Holding Capacity: The water content of the March 1976 minesoil auger samples (Table 19) may well depict the field capacity of the minesoil as a result of the occurrence of a 2.8 inch rainfall 2 days prior to sampling. Field capacity is defined as the amount of water held in the soil after the excess gravitational water has drained away, and represents the upper or wet limit of plant-available water under general field conditions. For many soils the field capacity has been closely correlated to the amount of water held at 1/3 bar tension (Richards and Weaver, 1944). Most soils have been found to drain to field capacity in 2 to 3 days (Veihmeyer and Hendrickson, 1931).
Table 19—Gravimetric water content of minesoil auger sites.
| Sample Site |
Depth (inches) |
Percent Moisturea | ||
|---|---|---|---|---|
| Date of Sampling | ||||
| 03/11/1976b | 05/06/1976c | 07/14/1976d | ||
| A-3 | 0-6 | 19.2 | 8.3 | 6.9 |
| 6-12 | 15.7 | 11 .2 | 19.2 | |
| 12-24 | 19.1 | 15.8 | 22.2 | |
| 24-40 | 13.5 | 16.6 | 22.1 | |
| A-4 | 0-6 | 24.8 | 15.1 | 16.1 |
| 6-12 | 24.2 | 15.6 | 21.5 | |
| 12-30 | 24.6 | 12.8 | 24.7 | |
| 30-40 | 24.4 | 16.8 | 22.3 | |
| A-8 | 0-6 | 17.4 | 11.4 | 22.2 |
| 6-12 | 22.7 | 17.4 | 21.2 | |
| 12-24 | 25.6 | 19.4 | 28.3 | |
| 24-40 | 25.1 | 26.2 | ---- | |
| (a) Oven-dry soil weight basis. (b) Rainfal1 from 09/01/1975 to 03/09/1976 measured 15.45 inches; of this amount 2.83 inches fell over the period of 03/04/1976 to 03/09/1976. Vegetation was growing wheat. (c) Rainfall from 03/12/1976 to 05/05/1976 measured 6.57 inches; of this amount 1.46 inches fell over the period of 04/28/1976 to 05/05/1976. Vegetation was growing wheat. (d) Rainfall from 05/07/1976 to 07/14/1976 measured 12.22 inches; of this amount 4.13 inches fell over the period of 07/03/1976 to 07/04/1976. Wheat had been harvested, stubble remained. |
||||
The average wilting point percentage for the 0-11 inch depth of the Parsons soil, calculated from data in Table 20, was 7.8 percent. The wilting point represents the dry limit of plant-available water, and is defined as the soil water condition at which the release of water to plant roots is just barely too small to counterbalance the loss of water from plants by transpiration; this results in a net loss of plant water and hence wilting. The wilting point for many soils has been closely correlated to the amount of water held at 15 bar tension (Richards and Weaver, 1943).
Table 20—Gravimetric water content of Parsons soil at field capacity and wilting point.a
| Horizon | Depth (inches) |
Field Capacity % |
Wilting Point % |
|---|---|---|---|
| AP | 0-7 | 29.1 | 8.6 |
| A21 | 7-11 | 26.6 | 7.1 |
| A22 | 11-15 | 23.0 | 7.4 |
| B21t | 15-20 | 27.6 | 17.6 |
| B22t | 20-27 | 30.4 | 20.5 |
| B3 | 27-39 | ---b | 18.4 |
| C1 | 39-52 | 23.3 | 16.1 |
| C2 | 52-63 | 24.0 | 14.9 |
| C3 | 63-73 | --- | 15.6 |
| C4 | 73-85 | 25.8 | 18.0 |
| (a) Data from U.S. Department of Agriculture, Soil Conservation Service (1981). (b) Data missing. |
|||
The difference between the field-capacity percentage and the wilting-point percentage is assumed by agronomists to be the amount of soil water available to plants. The amount of plant-available water for any depth of a soil can be calculated using the equation I = B · D · P (Peters, 1965)—where I represents inches of plant-available soil water, B represents bulk density (g/cm3), D represents depth (inches), and P represents the percentage of water between the field capacity and wilting point. Using the average bulk density of 1.41 g/cm3, an average field capacity of 27.8 percent, and an average wilting point of 7.8 percent, the amount of plant-available water in the surface 12 inches of the Parsons soil was calculated to be 3.4 inches. Using the same equation with the average bulk density of 1.44 g/cm3, an average field capacity of 20.7 percent, and an average wilting point of 7.8 percent, the amount of plant-available water in the surface 12 inches of the minesoil was calculated to be 2.2 inches. These calculations show the surface 12 inches of the minesoil retain 35 percent less plant-available water than the Parsons soil. However, it must be noted that the permanent wilting percentage of the minesoil was not determined; thus that of the Parsons soil was used in the calculation of plant-available water in the minesoil. The permanent wilting percentage of the minesoil may have been less, thus expanding the range between field capacity and wilting point, and in effect supplying more water than was calculated. This has been shown to be the situation in other minesoils (Jones and others, 1975; Verma and Thames, 1975). Also, others have shown that shale fragments in minesoil retain water that is plant available, adding to the total amount of water available to plants in minesoil (Hanson and Blevins, 1979).
The sampling dates represent early spring, mid-spring, and early summer, the time of year this area of Kansas receives its heaviest rainfall (U.S. Department of Agriculture, Soil Conservation Service, 1973). Also, this is the period of most vigorous plant growth. As discussed earlier, the March date represents a base period of maximum water buildup. The average amount of water in the 0-40 inch depth in March was 21.3 percent. The average amount of water in May, which represents a time of maximum water utilization by plants, was 15.5 percent. Although 6.57 inches of rain fell between March 12 and May 5, the water content did not return to the March amount. There are 2 reasons for this: (1) the rainfall was spread out over the period and the water had time to percolate deeper than 40 inches, whereas just prior to the March sampling approximately 3 inches of rain fell, and (2) during May the wheat was growing vigorously and using the available water in the transpiration and growth processes. Four inches of rain fell 10 days prior to the July sampling, which was almost a sufficient amount to bring the water content up to that of March. Also, since the wheat had been harvested, most of the water was still present in the 0-40 inch depth.
Overall the data show the minesoil can supply sufficient water for the growth of wheat under typical southeastern-Kansas rainfall conditions.
Chemical Properties
The chemistry of the minesoil is given in Table 21. The lowest depth sampled was 12-40 inches. Most routine soil-survey sampling in the United States is done to a depth of 40 inches. Also, where the soil has no B horizon, the control section is from 10-40 inches, especially if the soil is deep and has a subtle lower boundary (U.S. Department of Agriculture, Soil Conservation Service, 1962).
Table 21—Chemical analysis of minesoil.
| Samplea Site |
Depth (inches) |
pH (1:1) |
Exchangeable Bases (meq/100g)b |
Exchangeable Acidity |
Cationc Exchange Capacity (meq/100g) |
Based Saturation (%) |
|||
|---|---|---|---|---|---|---|---|---|---|
| Ca | Mg | Na | K | ||||||
| A-2 | 0-6 | 5.2 | 6.3 | 3.2 | 1.0 | 0.2 | 6.7 | 17.4 | 61 |
| 6-12 | 5.4 | 6.4 | 3.6 | 1.3 | 0.2 | 4.7 | 16.2 | 71 | |
| 12-40 | 4.5 | 5.2 | 3.4 | 0.9 | 0.2 | 7.2 | 16.9 | 57 | |
| A-3 | 0-6 | 4.9 | 8.4 | 2.6 | 0.4 | 0.3 | 6.3 | 18.0 | 65 |
| 6-12 | 5.2 | 3.4 | 1.9 | 0.3 | 0.2 | 6.8 | 12.6 | 46 | |
| 12-40 | 4.5 | 7.2 | 4.5 | 0.6 | 0.2 | 7.6 | 20.1 | 62 | |
| A-4 | 0-6 | 6.1 | 18.3 | 3.8 | 0.3 | 0.4 | 6.1 | 28.9 | 79 |
| 6-12 | 5.1 | 16.4 | 5.2 | 0.5 | 0.3 | 6.8 | 29.2 | 77 | |
| 12-30 | 5.6 | 18.9 | 5.9 | 0.5 | 0.3 | 12.5 | 38.1 | 67 | |
| 30-40 | 5.5 | 11.6 | 4.5 | 0.4 | 0.3 | 8.2 | 25.0 | 67 | |
| A-8 | 0-6 | 4.9 | 10.1 | 3.8 | 0.2 | 0.3 | 8.8 | 23.3 | 62 |
| 6-12 | 4.9 | 5.2 | 2.0 | 0.2 | 0.2 | 9.6 | 17.2 | 44 | |
| 12-40 | 4.9 | 5.7 | 2.5 | 0.2 | 0.2 | 9.7 | 18.3 | 47 | |
| A-11 | 0-6 | 5.8 | 14.6 | 3.2 | 0.8 | 0.2 | 3.3 | 22.1 | 85 |
| 6-12 | 5.9 | 12.3 | 3.8 | 1.0 | 0.2 | 3.6 | 20.9 | 83 | |
| 12-40 | 6.0 | 10.7 | 3.6 | 1.0 | 0.2 | 5.3 | 20.8 | 74 | |
| (a) Auger samples. (b) Milliequivalents/100 grams of soil. (c) Sum of exchangeable bases and acidity. (d) (∑ Ca, Mg, Na, K) / CEC) × 100. |
|||||||||
Overall, the data show variation among sites and within sites, except for potassium. Calcium was higher in the 0-6 inch depth than at lower depths at sites (A-2, A-3, and A-4) in limed fields. Calcium concentration in the 6-12 and 12-30 inch depths at site A-4 was comparable to that of the 0-6 inch depth, reflecting the larger application and deeper incorporation of lime in this area of Field 2. Sites A-8 and A-11 were in fields that were not limed. At these 2 sites calcium concentrations were also higher in the 0-6 inch depth, probably because of chemical and physical weathering of the recently exposed primary minerals. Magnesium showed no definite pattern with depth at sites in both limed and unlimed fields. The average magnesium concentration of all sites was approximately one-third the average calcium concentration. Sodium varied among the sites, but varied little within a site. Potassium varied least among sites and showed essentially no variation within a site.
The pH's of the 0-6 and 6-12 inch depths at sites A-2, A-3, and A-4 were higher than in the 12-40 inch depth, directly reflecting lime incorporation to 12 inches. Sites A-8 and A-11, which were not limed, showed a more uniform pH distribution with depth. The exchangeable acidity at sites A-2, A-3, and A-4 also reflected liming. Lower values were found in the 0-6 and 6-12 inch depths, compared to higher values in the 12-40 inch depth. However, not all the exchangeable acidity data correlated well with pH, because pH is a measure of present or active acidity in the soil solution, whereas exchangeable acidity is a measure of present acidity and reserve acidity, that due mainly to the hydrolysis of exchangeable aluminum.
Base saturation, a measure of the soil exchange sites occupied by the exchangeable bases (Ca, Mg, Na, and K), and used as a general indicator of the clay mineralogy of a soil, was calculated only to show the overall variation of exchangeable bases among and within sites. The base saturation was higher in the 0-6 inch depth than in the 6-12 and 12-40 inch depths at sites A-2, A-3, and A-4, due to the greater amounts of calcium present in the 0-6 inch depth from the addition of lime. The cation exchange capacity, which is more a function of the clay mineralogy of the soil, varied among sites, but varied little within sites. The cation exchange capacity was slightly higher in the 0-6 inch depth because of the weathering of shale particles and subsequent increase in the amount of clay and also because of the oxidation of organic matter.
The more extensive chemistry of the Parsons soil given in Table 22 also shows changes with depth similar to those shown by the more generalized core-site chemistry (Table 13). The depth of accumulation for exchangeable calcium, magnesium, potassium, and acidity extends from the 15-20 inch depth to the 52-63 inch depth, with maximum concentration occurring in the 20-27 inch depth. The higher potassium content in the 0-7 inch depth, compared to the 7-11 and 11-15 inch depths, was presumed to be from fertilizer applications. Exchangeable sodium also shows accumulation from the 15-20 inch depth to the 52-63 inch depth, but the maximum accumulation occurs in the 52-63 inch depth.
Table 22—Chemical data for Parsons Soil, Bourbon County.a
| Samplea Site |
Depth (inches) |
pH (1:1) |
Exchangeable Bases (meq/100g)b |
Exchangeable Acidity |
Cationc Exchange Capacity (meq/100g) |
Based Saturation (%) |
|||
|---|---|---|---|---|---|---|---|---|---|
| Ca | Mg | Na | K | ||||||
| AP | 0-7 | 5.4 | 10.3 | 1.6 | 0.1 | 0.4 | 6.8 | 19.2 | 65 |
| A21 | 7-11 | 5.4 | 5.9 | 1.4 | 0.1 | 0.2 | 6.8 | 14.4 | 53 |
| A22 | 11-15 | 5.4 | 5.2 | 1.7 | 0.2 | 0.2 | 6.1 | 13.4 | 54 |
| B21t | 15-20 | 5.0 | 12.8 | 4.8 | 0.8 | 0.5 | 13.6 | 32.5 | 58 |
| B22t | 20-27 | 5.1 | 16.1 | 5.9 | 1.4 | 0.6 | 13.4 | 37.4 | 64 |
| B3 | 27-39 | 5.5 | 15.1 | 5.5 | 1.4 | 0.5 | 8.5 | 31.0 | 73 |
| C1 | 39-52 | 6.0 | 13.4 | 5.0 | 1.6 | 0.4 | 5.6 | 26.0 | 78 |
| C2 | 52-63 | 6.6 | 12.9 | 4.8 | 2.2 | 0.4 | 4.6 | 24.9 | 82 |
| (a) Auger samples. (b) Milliequivalents/100 grams of soil. (c) Sum of exchangeable bases and acidity. (d) (∑ Ca, Mg, Na, K) / CEC) × 100. |
|||||||||
The pH does not show a significant change until the 39-52 inch depth, where it increases. Although pH increases in the 39-52 inch depth, the exchangeable acidity increases substantially in the 15-20, 20-27, and 27-39 inch depths, with a maximum in the 15-20 and 20-27 inch depths. The reason for the lack of a correlation between pH and exchangeable acidity was discussed earlier, and was attributed to exchangeable aluminum.
The cation-exchange capacity, calculated from the exchangeable bases and acidity, is higher from the 15-20 inch depth to the 52-63 inch depth, with a maximum in the 20-27 inch depth due to the accumulation of clay at this depth (Table 17). The higher cation-exchange capacity in the 0-7 inch depth compared to the 7-11 and 11-15 inch depths was attributed to the accumulation and oxidation of organic matter and weathering of primary minerals.
The base saturation, calculated from the exchangeable bases (Ca, Mg, Na, and K) and the cation-exchange capacity are higher from the 15-20 inch depth to the 52-63 inch depth with a maximum in the 52-63 inch depth, which is also the depth of the maximum concentration of sodium. The higher base saturation of the 0-7 inch depth, compared to the 7-11 and 11-15 inch depths, was attributed to a high calcium concentration from liming.
Based on data in Tables 21 and 22, the major differences between the chemical properties of the Parsons soil and the minesoil are essentially in the chemical distribution. Table 23 is a comparison of the chemistry of the Parsons soil and minesoil averaged over the 0-39 inch and 0-40 inch depths respectively. Besides being the logical cut-off point for comparison purposes, 39 inches is also approximately the lower limit of the control section for the Parsons soil.
Table 23—Comparison of chemical properties of Parsons soil and cropped minesoil.
| Property | Parsons Soila | Minesoilb | |
|---|---|---|---|
| pH (1:1) | 5.3 | 5.3 | |
| Exchangeable Bases (meq/100g)c | |||
| Ca | 10.9 | 9.6 | |
| Mg | 3.5 | 3.5 | |
| Na | 0.7 | 0.6 | |
| K | 0.4 | 0.2 | |
| Exchangeable Acidity (meq/100g) | 9.2 | 7.0 | |
| Cation Exchange Capacity (meq/100g) | 24.6 | 20.1 | |
| Base Saturation (%) | 61 | 65 | |
| (a) Average for 0-30 inch depth (AP-B3 horizons), Table 22. (b) Average of auger sites A-2, 3, 4, 8, and 11 for the 0-40 inch depth (C-1, 2, and 3 horizons), Table 21. (c) Milliequivalents/100 grams of soil. |
|||
As expected, the averages show the Parsons soil and minesoil to be quite comparable chemically. The Parsons soil has a slightly higher calcium content (10.9 meq/100 grams of soil) than the minesoil (9.6 meq/100 grams). Also, the Parsons soil has a slightly higher potassium content (0.4 meq/100 grams) than the minesoil (0.2 meq/100 grams). The higher contents of calcium and potassium are reflected in the greater base saturation of the Parsons soil compared to the minesoil. The differences in the calcium and potassium contents of the 2 soils are probably a result of the fertilizer management history of the soils. It is probable that, if the 2 soils had the same fertilizer management history, the calcium and potassium contents would have been identical.
The minesoil has a more favorable exchangeable acidity than the Parsons soil, because of the high exchangeable acidity in the 15-20 and 20-27 inch depths of the Parsons soil (Table 22). The cation exchange capacity of the minesoil was 19 percent less than that of the Parsons soil. As discussed earlier, the cation-exchange capacity is more a function of the mineralogy of a soil.
The particle-size analysis of the <2 mm size fraction of the minesoil (Table 15) showed the minesoil has more sand and less silt, but essentially the same amount of clay as the Parsons soil. The greater amount of sand in the minesoil is probably the reason for the difference in the cation-exchange capacities.
Because reclamation results in a soil with a more uniform distribution of chemical properties with depth, the growth of most crops, under similar management practices, should be somewhat better on the minesoil than on the Parsons soil.
Fertility
Analyses of minesoil spade sample sites for fertility evaluation are given in Table 24. Sites S-1, S-2, S-3, and S-4 were in Field 1 and represent minesoil after 1 year of cropping. The data show the minesoil was quite variable within the same field. Also, the data of sites S-3 and S-4 confirm the acid condition in the north part of the field. Sites S-3 and S-4 had lime requirements of 11,000 and 22,000 pounds per acre, compared to 1,500 and 3,000 lb/ac for samples S-1 and S-2; and pHis of 4.0 and 3.2 compared to a pH of 5.4 for both samples S-1 and S-2. Smith and others (1976) recommend that, if the lime requirement of coal mine spoils exceeds 10,000 lb/ac, the spoil should be considered toxic and should not be placed on or near the surface. The acid condition at sites S-3 and S-4 was also reflected in the greater amounts of DTPA-extractable zinc, iron, and manganese at these sites, compared to sites S-1 and S-2.
To compare the fertility status of the Parsons soil to that of the 1-year-old cropped minesoil, the data of the 0-16 inch depth of the Parsons soil (Table 13) averaged from the 3 cores were compared to those of minesoil averaged from spade sample sites S-1, S-2, S-3, and S-4 (Table 24). The results (Table 25) show the minesoil differs markedly from the Parsons soil. The pH of the minesoil was 4.5 compared to 5.4 for the Parsons soil. The liming requirement of the minesoil was greater than that of the Parsons soil by 3,875 lb/ac. The lower pH and higher lime requirement of the minesoil were attributed to the oxidation of pyrite contained in shale fragments that were observed in the surface of the minesoil.
Table 24—Chemical analysis of minesoil for fertility evaluation. (Analysis by the Soil Testing Laboratory, Kansas State University.)
| Samplea site |
pH (1:1) |
Lime Requirement (lbs/ac ECC)b |
Avail. P (lbs/A)c |
Exchangeable Bases (meq/100g)d |
|||
|---|---|---|---|---|---|---|---|
| Ca | Mg | Na | K | ||||
| S-1 | 5.4 | 1,500 | 33 | 3.6 | 2.8 | 0.4 | 0.3 |
| S-2 | 5.4 | 3,000 | 26 | 3.8 | 3.6 | 0.5 | 0.4 |
| S-3 | 4.0 | 11,000 | 16 | 3.4 | 9.5 | 0.3 | 0.3 |
| S-4 | 3.2 | 20,000 | 50 | 4.7 | 4.8 | 0.2 | 0.2 |
| Sample Site |
Organic Matter (wt %) |
DTPAe (ppm)f | Avail. N (ppm N) | Avail. Bg (ppm) |
||||
|---|---|---|---|---|---|---|---|---|
| Zn | Fe | Cu | Mn | NH4 | NO3 | |||
| S-1 | 0.9 | 2.0 | 29 | 1.7 | 32 | 2.5 | 0.3 | 0.5 |
| S-2 | 0.8 | 2.3 | 60 | 2.8 | 64 | 3.1 | 9.2 | 0.2 |
| S-3 | 1.4 | 15.1 | 116 | 1.6 | 535 | 7.3 | 0.8 | 0.5 |
| S-4 | 1.3 | 4.6 | 353 | 0.6 | 431 | 7.6 | 1.4 | 1.0 |
| (a) Spade samples. (b) Pounds/acre of effective CaCO3 (ECC) to raise pH to 6.8. (c) Pounds/acre. (d) Milliequivalents/100 grams of soil. (e) Diethylenetriaminepentaacetic acid method. (f) (see f on Table 13) (g) Hot-water-soluble boron. |
||||||||
Table 25—Comparison of fertility properties of Parsons soil and 1-year-old cropped minesoil.
| Property | Parsons Soila | Minesoilb | |
|---|---|---|---|
| pH | 5.4 | 4.5 | |
| Lime Requirement (lb/ac ECC) | 5000 | 8875 | |
| Available P (lb/ac) | 17 | 31 | |
| Available N (ppm)c | |||
| NH4 | 9.0 | 5.1 | |
| NO3 | 3.8 | 2.9 | |
| Available B (ppm) | 0.3 | 0.5 | |
| Exchangeable Bases (meq/100g) | |||
| Ca | 3.2 | 3.9 | |
| Mg | 1.1 | 5.2 | |
| Na | 0.2 | 0.4 | |
| K | 0.2 | 0.3 | |
| DTPA Extractable (ppm) | |||
| Zn | 5.3 | 6.0 | |
| Fe | 89.2 | 139.9 | |
| Cu | 1.4 | 1.7 | |
| Mn | 26.5 | 265.8 | |
| Organic Matter (%) | 1.3 | 1.1 | |
| (a) Average of 3 sites (0-16 inches), C-1, 2, and 3, Table 13. (b) Minesoil (Field 1) cropped to hard red winter wheat, no lime applied; average of 4 sites (0-6 inches), S-1, 2, 3, and 4, Table 24. (c) Parts per million (µg/g) on an oven-dry (105° C) soil weight basis. |
|||
The average concentration of available ammonium nitrogen of the Parsons soil was 9.0 ppm compared to 5.4 ppm for the minesoil. The higher ammonium concentration in the Parsons soil was attributed to organic-matter accumulation in the surface horizon. Mining disturbed this natural accumulation and the organic matter was redistributed with depth when the spoil banks were leveled. The concentration of ammonium was greater than the concentration of nitrate in both the Parsons soil and the minesoil. The ratios of ammonium to nitrate were 2.3 for the Parsons soil and 1.7 for the minesoil.
Nitrogen usually accumulates as nitrate in most mineral soils. The conversion of organic nitrogen to nitrate takes place largely in 2 steps, ammonification and nitrification. Ammonification is the release of nitrogen in organic matter and its conversion to ammonium. Nitrification is the oxidation of ammonium to nitrate, which is the form of nitrogen most readily used by higher plants. The conversion of ammonium to nitrate is affected by chemautotrophic bacteria that obtain their energy from the oxidation of inorganic salts and carbon from the carbon dioxide of the surrounding soil atmosphere. The range of pH over which nitrification takes place has generally been found to be between 5.5 and 10.0, with optimum at around 8.5 (Alexander, 1977). The pH of the Parsons soil was 5.4, which is on the low side of the range, and the pH of the minesoil was 4.5, below the lowest pH at which nitrification normally occurs.
The available phosphorus concentration of the minesoil was 31 Lb/ac compared to 17 lb/ac for the Parsons soil. The greater amount of phosphorus in the minesoil reflects phosphorus added as fertilizer. Except for magnesium, exchangeable-cation concentrations of the minesoil and the Parsons soil were not appreciably different. In most mineral soils exchangeable calcium is usually much greater than exchangeable magnesium, especially if the soil has been limed. Cummins and others (1965) reported that magnesium was more abundant than calcium in the mine spoils they sampled. The average minesoil magnesium concentration of Field 1, which was not limed in the fall of 1974, was 5.2 meq/100 grams of soil compared to 1.1 meq/100 grams for the Parsons soil. This difference was attributed to the weathering of shale fragments in the minesoil, with the subsequent release of magnesium from clay crystal lattices.
The weathering of shale particles also contributed to the greater concentration of DTPA-extractable iron and manganese found in the minesoil. Average minesoil concentrations were 139.9 meq/100 grams of soil for iron and 265.8 meq/100 grams for manganese, compared to Parsons concentrations of 89.2 meq/100 grams for iron and 26.5 meq/100 grams for manganese. There were no appreciable differences in DTPA-extractable zinc and copper concentrations between the minesoil and Parsons soil, possibly because shales are much lower in zinc and copper than in iron and manganese (Krauskopf, 1972).
The average available boron concentration of the minesoil was 0.5 ppm compared to 0.3 ppm for the Parsons soil. The higher amount of boron in the minesoil was also attributed to the weathering of the shale fragments. Shales in general have high concentrations of boron, with boron residing principally in the clay minerals (Krauskopf, 1972). Dissolved boron derived from the weathering of shale occurs chiefly as boric acid (H3BO3). Boron compounds in soil are all quite soluble, and thus are easily leached to greater depths, especially in acid soils. This could explain the small amount of boron found in the surface of the minesoil, compared to magnesium, iron, and manganese (Table 24). Iron and manganese are quite insoluble compared to boron, and in young minesoil, where weathering occurs mostly in the surface horizon, these elements would be expected to have higher concentrations in the surface than in the subsoil.
Summary
Morphology
The most prominent morphological characteristics of the minesoil were the absence of well-developed and contrasting horizons and the presence of large amounts of rock fragments. The structure of the minesoils was mostly clods with many visible voids present in the 6-12 and 12-40 inch depths. The only pedogenic development observed in the minesoil was the physical weathering of surface shale fragments.
Physical Properties
The particle-size distribution of the minesoil varied within and among sites, reflecting the mixing of soil and overburden that occurred as a result of the mining and releveling operations.
The minesoil had greater amounts of material in all particle-size ranges, except for the <0.074 mm fraction. The greatest difference was found in the 2-0.074 mm range. The minesoil contained 85 percent (by weight) material <2 mm, whereas in the Parsons soil nearly all the material (98-99 percent) was <2 mm. Silt and clay were more uniformly distributed with depth in the minesoil. However, when averaged over depth, the amounts of clay in the minesoil and Parsons soil were essentially identical, whereas the amount of silt in the minesoil was less than that of the Parsons soil.
The bulk density of the minesoil was found to decrease with depth, whereas that of the Parsons soil increased with depth. The bulk density of the 0-12 inch depth of the minesoil was higher than the 12- 40 inch depth, and was attributed to the filling of void spaces with fine materials during the smoothing of the minesoil and the tilling of the minesoil for planting.
Estimates show that the surface 12 inches of the minesoil contained 35 percent (by weight) less plant-available water than the Parsons soil. However, the moisture data indicate, and the high yields tend to confirm, that the minesoil supplied available moisture sufficient for the growth of wheat under typical southeast Kansas rainfall conditions. It was assumed that the moisture deficit found in the surface 12 inches of the minesoil was effectively overcome by an overall increase in the amount of plant-available water in the minesoil, due in part to the deeper rooting zone of the minesoil, and also to the moisture present in shale particles.
Chemical Properties
In general the chemistry of the minesoil showed variations within and among sites, reflecting, as did the particle-size distribution, the mixing of soil and overburden from the mining and releveling operations.
The chemistry of the minesoil and Parsons soil averaged over depth showed the 2 soils to be quite comparable. Essentially, the only differences were that the minesoil had less exchange acidity and cation-exchange capacity. These differences were attributed to the larger amount of sand-size material in the <2 mm size fraction of the minesoil.
Fertility
The fertility of 1-year-old cropped minesoil differed markedly from that of the Parsons soil. The pH of the minesoil was lower and thus the acidity was higher than that of the Parsons soil. Additionally, the liming requirement of the minesoil was greater. There was more available phosphorus in the minesoil due to fertilizer additions. The amount of exchangeable magnesium was 5 times greater in the minesoil. The respective concentrations of extractable iron and manganese were 1.5 and 10 times greater in the minesoil. Except for phosphorus, all these differences were attributed to the weathering of pyrite-containing shale particles in the surface of the minesoil.
Prev Page—Coal || Next Page—Water
Kansas Geological Survey, Geology
Placed on web Oct. 25, 2018; originally published 1982.
Comments to webadmin@kgs.ku.edu
The URL for this page is http://www.kgs.ku.edu/Publications/Bulletins/MRS7/05_soil.html