![]()
Prev Page--Water Quality || Next Page--Future Outlook and Studies, References
Quality of Water for Irrigation
Hydrologic Cycle
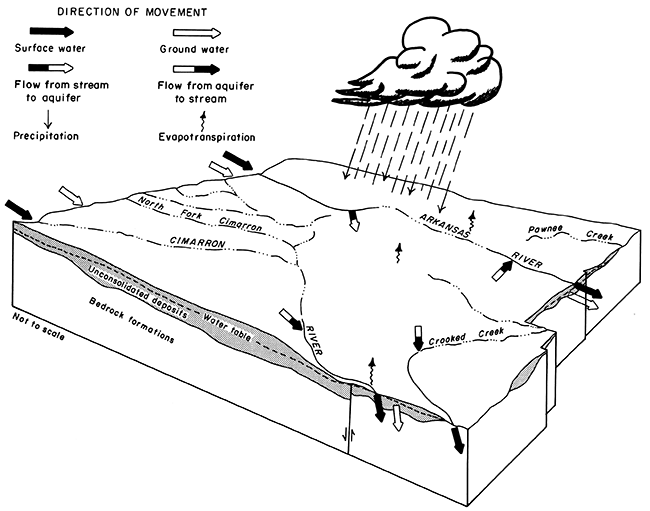
The natural geohydrologic cycle in southwestern Kansas is depicted by a generalized block diagram (fig. 9). Water enters the aquifers by underflow from the west; by seepage from streams, especially in times of high flow; and by recharge of precipitation within the area. Water is discharged to the east and south by underflow, by seepage to perennial streams, and by evapotranspiration where the water table is shallow. This natural cycle has been modified by man's activities to include discharge from the aquifer by pumpage from wells and recharge to the aquifer from deep percolation of applied irrigation water.
Figure 9--Natural geohydrologic features.
Precipitation
The mean annual precipitation ranges from 15.82 inches at Johnson in Stanton County to 22.53 inches at Cimarron in Gray County, according to the records of the National Weather Service (U.S. Dept. of Commerce , 1975). Mean annual precipitation near the center of the area at Sublette is 19.45 inches. About three-fourths of the total annual precipitation falls during the growing season (April-October). Showers and thunderstorms in southwestern Kansas are often of high intensity and short duration and vary in areal distribution so that significant amounts fall in one area while nearby areas receive little or no rainfall.
Owing to summer heat, low humidity, and high wind movement, most precipitation returns rapidly to the atmosphere through evaporation and transpiration by plants. A total potential evaporation of 66.13 inches was measured at the Garden City Experiment Station from May through October 1974. Potential transpiration probably averages 0.70 times the total potential evaporation or about 46 inches (Crippen, 1965).
Recharge
As reported in the Finney County study (Meyer and others, 1970), recharge from precipitation on irrigated areas is significantly greater than from precipitation on nonirrigated areas. In irrigated areas, it is common practice to pump sufficient ground water to maintain soil moisture for crop use and for leaching of salts. Therefore, precipitation that is in excess of the amount needed to overcome soil-moisture deficiencies can percolate to the water table. In nonirrigated areas, vegetation generally utilizes all precipitation supplied to the soil so that excess water for percolation below the root zone is available only during periods of abnormally high rainfall. For this report, estimates of recharge from precipitation during the growing season (April-October) are assumed to be 10 percent of precipitation on irrigated land and 1 percent of the precipitation on nonirrigated land (Gutentag and Stu1lken, 1976).
Recharge to the aquifer is calculated for 6,600 square miles, which is the part of the area that is underlain by sufficient saturated material to support irrigation. From the following section on "Annual Withdrawals," records for 1975 show that about 1,400,000 acres were irrigated; the remaining 2,824,000 acres were not irrigated. Annual recharge to the aquifer, based on about 15 inches of precipitation during the growing season, is computed to be 210,000 acre-feet (175,000 acre-feet in the irrigated area and 35,000 acre-feet in the nonirrigated area).
Runoff of precipitation to streams also is a source of recharge to the aquifer in southwestern Kansas. The streams generally have sandy channels and are underlain by permeable deposits of sand and gravel. Water infiltrates the channel sides and bottom during periods of flow after heavy rains, and much of this water percolates to the water table. Some of the runoff that collects in shallow depressions of the land surface also percolates to the water table and recharges the ground-water reservoir. However, the bottoms of the depressions often are filled with clayey soils that retard infiltration; consequently, most of the water evaporates. The amount of annual recharge from runoff into surface depressions and streams is assumed to be included with the total estimate of recharge from precipitation.
An additional 163,500 acre-feet per year of water enters the area as streamflow in the Arkansas and Cimarron Rivers (U.S. Geological Survey, 1975).
Water also enters the area as subsurface inflow from the north and west. Based on the hydraulic gradient, the cross-sectional area of saturated deposits, and an average hydraulic conductivity, the inflow is calculated to be about 8,400 acre-feet per year.
Discharge
Outflow through the subsurface and seepage to streams compri se the primary modes of natural discharge of ground water from the area. Subsurface outflow, which is principally to the east, is calculated in a manner similar to that of subsurface inflow to be about 15,300 acre-feet per year.
The ground-water contribution to streamflow is considered as ground-water discharge. Parts of three streams in the area, the Arkansas River, the Cimarron River, and Crooked Creek, receive flow from ground-water seepage. As reported by Busby and Armentrout (1965), the 20-year average base flow (groundwater contribution) of the Cimarron River at Mocane, Okla. (Station No. 07157000), is 46.1 ft3/s or 33,400 acre-feet per year, and the base flow of Crooked Creek near Nye, Kans. (Station No. 07157500), is 12.2 ft3/s or 8,800 acre-feet per year. Figures reported in Meyer and others (1970) and in McGovern and Long (1974) indicate that about 11,300 acre-feet per year of ground water leaves the area as base flow in the Arkansas River.
Discharge from the unconsolidated aquifer by evapotranspiration is negligible in southwestern Kansas because the water table in most of the area is too far below the land surface to be affected by evaporation and transpiration.
Annual Withdrawal
Withdrawals by wells far exceed all other discharges of ground water in southwestern Kansas. Based on records of the U.S. Department of Agriculture as discussed in the section "Ground-Water Development," it was estimated that pumpage for irrigation of 1,400,000 acres during 1975 was between 2.1 and 2.8 million acre-feet.
Some of the water withdrawn by wells and applied for irrigation is returned to the aquifer. Figures experimentally derived by Meyer and others (1970) for irrigated land in Finney County showed that about 20 percent of the water applied to irrigated land in southwestern Kansas was returned to the aquifer by percolation below the root zone. Based on the average annual withdrawal by wells for irrigation of 2.1 to 2.8 million acre-feet, calculations suggest that about 420,000 to 560,000 acre-feet per year returns to the ground-water reservoir. On the basis of 1975 data, the net withdrawal of water by wells for irrigation in southwestern Kansas is estimated to be 1.7 to 2.2 million acre-feet annually.
Measurements of natural-gas consumption by 119 wells show that an average of 7,000 cubic feet of gas is required to pump 1 acre-foot of water. Based on this figure, the volume of natural gas required to pump the estimated total withdrawal of 2.1 to 2.8 million acre-feet of water would amount to 1.5 X 10¹⁰ to 2.0 X 10¹⁰ cubic feet. Data from the Kansas Corporation Commission in 1974 showed that the 5,768 natural gas wells in southwestern Kansas produced 7.95 X 10¹¹ cubic feet of natural gas or 1.38 X 10⁸ cubic feet per well. Therefore, the natural gas consumed for withdrawal of ground water in southwestern Kansas in 1974 was about 2 to 2.5 percent of the total natural gas production, or the production from 116 to 152 gas wells.
Ground-water Development
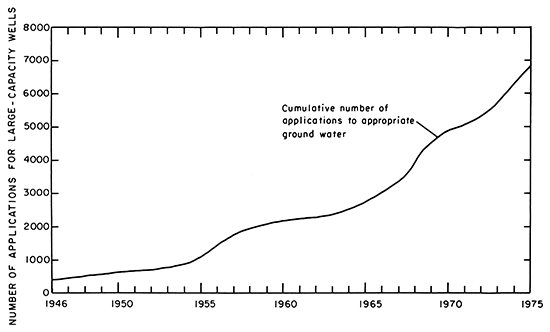
The number of irrigation wells in southwestern Kansas, as indicated by the records of the Division of Water Resources, Kansas State Board of Agriculture (fig. 10), increased from about 420 in January 1946 to about 7,000 in January 1975. The rate at which wells were installed increased during the mid-1950's and again during the mid-1960's, primarily in response to periods of below normal precipitation. Irrigators have continued to install wells as a means of providing an additional water supply during future dry periods, assuring a maximum crop production, and increasing production of milo and corn for use in cattle feeding.
Figure 10--Cumulative number of applications to appropriate ground water.
Records from the Agricultural Stabilization and Conservation Service and the Soil Conservation Service, U.S. Department of Agriculture, showed that about 1,400,000 acres were irrigated by ground water in 1975. If it is assumed that the application rate ranged from 1.5 to 2.0 feet per acre, as commonly reported by irrigators in the area, the total pumpage would be between 2.1 and 2.8 million acre-feet per year.
Records from the Division of Water Resources, Kansas State Board of Agriculture, also showed that about 150,000 acre-feet, or an additional 5 percent of the water withdrawn in southwestern Kansas, were pumped by municipalities, feedlots, and industries.
The locations of all large-capacity wells (yielding more than 100 gal/min) in southwestern Kansas, March 1975, are shown on plate 2.
Effects of Development
Water-Level Declines
Water-level declines in the unconsolidated aquifer since 1940 (pl. 3), which have resulted principally from irrigation withdrawals, range from a few feet to about 135 feet. The greatest declines of about 130 to 135 feet have occurred in Grant County near Ulysses in T. 30 S., R. 37 W., and T. 28 S., R. 37 W. Declines of greater than 50 feet also have occurred in Finney. Haskell, and Stanton Counties. About 10 percent of the study area has experienced 50 feet or more of water-level decline. The median water-level decline for the entire study area is 13 feet.
Water in most of the unconsolidated aquifer in southwestern Kansas is unconfined. Thus, water-level declines generally represent actual dewatering of part of the aquifer. In some of the deep zones, confined aquifer conditions were indicated by previous tests (Fader and others, 1964). However, continued pumping from these zones has lowered the head and reduced the confining effect of the upper layers.
The amount of water removed from storage in the unconsolidated aquifer can be estimated by determining the volume of aquifer dewatered, from plate 3, and multiplying by the average specific yield of the aquifer. An average specific yield of 15 percent was assumed for the aquifer, including those areas where confinement still prevails. The volume of ground water in storage was reduced by about 14 million acre-feet during 1940-75. The net withdrawal in the 1974 irrigation season, based on 1975 data, was estimated to be 1.7 to 2.2 million acre-feet.
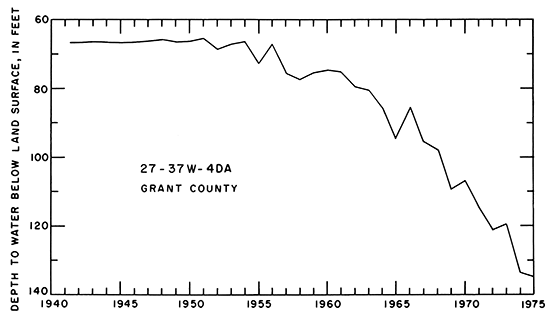
Hydrographs from four wells, constructed from data provided by the Di vision of Water Resources, Kansas State Board of Agriculture, are shown on figures 11 through 14. The hydrograph of well 27-37W-4DA (fig. 11) illustrates the longterm effects of increasingly heavy development on water levels in an unconfined aquifer. This well is screened only in the upper part of the unconsolidated aquifer. The water level during 1941-51 was stable, which is indicative of minimal early development in an area where recharge to and discharge from the aquifer were about equal. Increased development is shown by a net decline in the water level during 1951-64. The water level has continued to decline at a fairly steady rate from 1964 through 1975.
Figure 11--Hydrograph of observation well 27-37W-4DA.
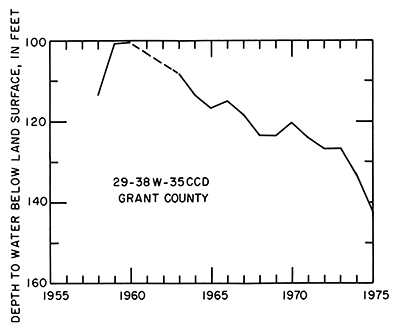
Wells 27-38W-32BCC (fig. 12) and 29-38W-35CCD (fig. 13), located in the same highly developed area as well 27-37W-4DA (fig. 11), are screened opposite all water-bearing materials in the unconsolidated aquifer, including the lower confined beds. Similar water-level declines in the three wells from 1969 to 1975 indicate that nearly equal changes have occurred over broad areas as a result of irrigation withdrawals from different parts of the aquifer.
Figure 12--Hydrograph of observation well 27-38W-32BCC.
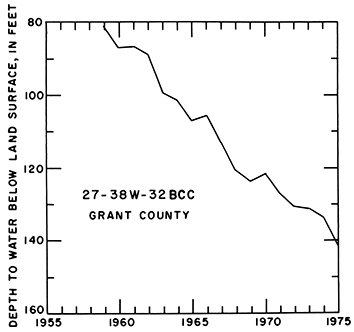
Figure 13--Hydrograph of observation well 29-38W-35CCD.
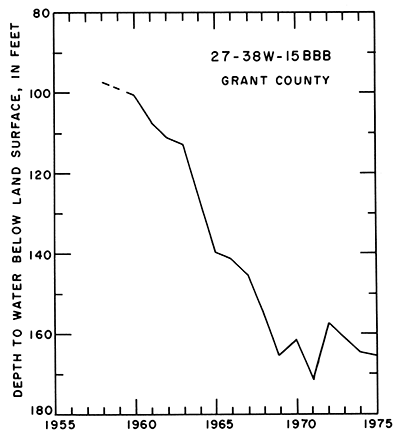
Well 27-38W-1SBBB (fig. 14), located outside the boundary of the unconsolidated aquifer, produces water only from the sandstone aquifer. However, a hydraulic connection between the two aquifers is indicated because the hydrograph of water levels in the sandstone aquifer shows the effect of pumping from the adjacent unconsolidated aquifers.
Figure 14--Hydrograph of observation well 27-38W-15BBB.
A comparison of well locations, shown on plate 2, and the water-level declines shown on plate 3, suggests the cause and effect relationship between well density and water-level changes. The areas of greatest well densi ty generally correspond to the areas of greatest withdrawals and water-level declines.
Depletion of Ground Water in Storage
Depletion of ground water in storage or ground-water mining is indicated by water-level declines resulting from irrigation development. The relation of long-term irrigation withdrawals to changes in ground-water storage (1940- 75) also may be shown (see plate 3) as a percentage decrease in saturated thickness.
The reduction in saturated thickness between 1940 and 1975 ranged from less than 10 percent to almost 60 percent, with a median of 8 percent. In about 5 percent of the area encompassed within the unconsolidated aquifer, the saturated thickness has decreased 40 percent or more since 1940.
Water levels in well 27-37W-4DA and well 27-38W-32BCC have declined about 70 feet and 90 feet, respectively, since 1940. The decrease in saturated thickness of the aquifer from 1940 to 1975 at both locations (pl. 3) is about 30 percent. During the same period, the water level in well 29-38W-35CCD declined about 80 feet, and the saturated thickness decreased about 20 percent. A1 though areas of greatest dec1 ines generally coincide with areas of greatest pumping, these examples indicate that simi1ar amounts of water-level decline indifferent areas may not represent similar percentages of ground-water depletion. The most significant changes since 1940 are in northern Finney and northern Morton Counties where water-level declines of less than 50 feet have reduced saturated thickness by as much as 50 percent.
Further increases in the rate of withdrawals may shorten significantly the economic life of the aquifer. Those areas that have declines of 40 percent or more have already experienced a large reduction in well yields and a large increase in the cost of pumping.
Prev Page--Water Quality || Next Page--Future Outlook and Studies, References
Kansas Geological Survey, Geohydrology
Placed on web July 28, 2013; originally published 1981.
Comments to webadmin@kgs.ku.edu
The URL for this page is http://www.kgs.ku.edu/Publications/Bulletins/IRR7/06_cycle.html