![]()
Prev Page--Geologic framework || Next Page--Water Quality
Hydrology
Ground-Water Occurrence
Bedrock Aquifers
The bedrock aquifers are the gypsum aquifer in Upper Permian rocks, the sandstone aquifer in the Upper Jurassic and Lower Cretaceous rocks, and the chalk aquifer in Upper Cretaceous rocks. These aquifers differ from the unconsolidated aquifer in that they generally lie at a greater depth, are more difficult to drill, contain water that generally is under artesian head, commonly contain more highly mineralized water, and generally will not sustain large yields.
Gypsum Aquifer--The gypsum aquifer is defined here as the highly permeable zones within the Upper Permian Day Creek Dolomite. In Morton County, the gypsum aquifer consists of locally cavernous white to pink anhydrite and gypsum that are interbedded with dark-red shale. The presence of cavities commonly is indicated by a sudden drop of the drill stem and a loss in circulation of fluid during drilling. Stock and irrigation wells, which tap the Day Creek, pump from water-filled solution cavities in the evaporite deposits. Depth of the Day Creek below land surfaces ranges from about 200 feet in the southwestern part of Morton County near the Cimarron River to about 800 feet in northeastern Morton County. The gypsum aquifer has been tapped only in central Morton County, where solution cavities yield 300 to 1,000 gal/min. Because water from wells in the Day Creek is highly mineralized, utilization of this water for irrigation is limited (see section on "Quality of Water for Irrigation").
Sandstone Aquifer--The sandstone aquifer, as used in this report, refers to the permeable sandstone beds contained throughout the Upper Jurassic and Lower Cretaceous rocks in southwestern Kansas. The sandstone beds within the two rock units are discontinuous, and thicknesses differ greatly from one area to another.
Upper Jurassic rocks consist chiefly of red siltstone interbedded with buff, green, and white sandstone. The rocks are similar in lithology and probably are equivalent to the Entrada Sandstone and Morrison Formation of southeastern Colorado (Voegeli and Hershey, 1965).
Lower Cretaceous rocks, which contain the sandstone aquifer, are comprised of the Cheyenne Sandstone, the Kiowa Formation, and the Dakota Formation. The Cheyenne Sandstone consists of a white to rust-colored fine-to coarse-grained quartzose sandstone. The Kiowa Formation generally consists of a dark-gray to black silty shale containing calcareous shale lenses and interbedded sandy siltstone, fine sandstone, and tan calcareous shale. Where the Kiowa Formation consists predominantly of sandstone beds, it is difficult to distinguish from the underlying Cheyenne Sandstone or the overlying sandstone beds of the Dakota Formation. The Dakota Formation in most areas consists of fine- to medium-grained reddish-brown to yellowish-brown ferruginous sandstone that contains yellow and gray silty shale beds.
Only the loose to slightly cemented sandstone beds in the sandstone aquifer contain significant amounts of recoverable water. Locally, the silty or tightly cemented sandstone beds yield only enough water to wells in the aquifer for domestic or stock supplies. In areas where the sandstone beds are loosely cemented, such as northeastern Finney County, yields of more than 1,000 gal/min have been obtained from the aquifer by irrigation wells. In other areas of Grant, Morton, and Stanton Counties, many multiple-aquifer wells obtain part of their yield from the sandstone aquifer.
Chalk Aquifer--The chalk aquifer is defined as that part of the Niobrara Chalk that contains saturated fractures and solution openings. Because the occurrences of fractures and solution openings are irregular, it is difficult to predict the occurrence of water. A well drilled in limestone or chalk must penetrate a sufficient amount of water-filled fractures or solution openings to provide an adequate yield. Therefore, it is commonly necessary to drill several test holes to locate a well that will yield enough water for the intended use.
In northern Finney County and eastern Kearny County, about 45 irrigation wells produce water, solely or in part, from several zones of fractures and solution openings in the Fort Hays Limestone Member (lower unit of the Niobrara Chalk). In the area where the zones of fractures and solution openings are productive, the Fort Hays subcrops beneath the Tertiary and Quaternary deposits. These 1- to 2-foot zones occur approximately 20 feet and 40 feet above the contact with the underlying Carlile Shale. It is possible that similar saturated fractures and solution openings in the Fort Hays Limestone Member also may be found near the Fort Hays-Carlile contact in northern Hamilton and Kearny Counties. However, the potential for large yields is not indicated in these areas.
Initial yields (1968-72) of 500 to 2,500 gal/min were available to wells from the Fort Hays Limestone Member in northern Finney and eastern Kearny Counties. Because of irrigation development and lowering water levels, well yields (1976) have been reduced 100 to 2,000 gal/min.
The data indicate that the fractures and solution openings in the Niobrara Chalk are limited both in thickness and in areal extent and that water is transported only short distances. The fractures and solution openings are hydraulically connected and obtain their water supply from the overlying thinly saturated (less than 10 feet) Ogallala and undifferentiated Pleistocene deposits.
Unconsolidated Aquifer
The saturated part of the Ogallala Formation of Pliocene age, the undifferentiated Pleistocene deposits, and the Quaternary alluvium are defined here as the unconsolidated aquifer. These unconsolidated deposits, which comprise the aquifer in southwestern Kansas, consist of a heterogeneous assortment of alluvial sediments. Individual beds of silt, clay, sand, gravel, and caliche may be correlated with confidence only for short distances.
Yields differ from one area to another owing to the water-producing zones within the aquifer. Coarse sand and gravel deposits, which probably represent channel-fill of a large stream, commonly yield 1,000 to 2,500 gal/min to wells, and yields of as much as 3,000 gal/min have been measured. Coarse sand and gravel interbedded with silt and clay probably represent deposits of numerous streams as they migrated laterally across an ancient flood plain. Yields to wells from these deposits may range from about 100 to 1,000 gal/min. In the Arkansas and Cimarron River valleys, very coarse gravel and cobbles interbedded with silt and clay layers yield about 500 to 1,000 gal/min. In the Pawnee River valley, medium to coarse gravel, interbedded with silt and clay layers, yields about 50 to 500 gal/min to wells.
Potentiometric Surface--The configuration of the potentiometric surface, which may reflect water levels in unconfined or confined layers of the aquifer, is shown on plate 2. Data on water levels were obtained during the winter (January 1975) when effects of seasonal pumping for irrigation were at a minimum. Many hydrologic features are shown by the shape and slope indicated by contours on this surface. Contours are not shown in areas where water levels are at or near the bedrock surface or are isolated from the main part of the unconsolidated aquifer.
Ground water in the unconsolidated aquifer occurs predominantly under unconfined conditions, although confined conditions may occur locally. When water is withdrawn from a confined layer in the aquifer during the irrigation season, the head declines. Owing to the differences in head, water leaks through the confining layer and results in a water-level decline in the overlying unconfined layer of the aquifer (Gutentag and others, 1972). In the nonirrigation season, the head in the confined layer of the aquifer is increased as water moves into the pumped area from surrounding areas of little or no pumping. In response to the increase in head, water levels rise in the unconfined layer of the aquifer. The difference in heads in the two aquifer layers can be indirectly related to the intensity of withdrawal during the previous pumping season, the vertical hydraulic conductivity and extent of the confining layer, and the duration of time available for recovery during the nonpumping season.
In much of southwestern Kansas, the alluvial deposits are lenticular and heterogeneous. The potentiometric surfaces have not been differentiated with respect to individual aquifer layers because most wells tap all the water-yielding material at a given location. In some areas, wells also may have a contribution from the underlying sandstone aquifer where it is in contact with the unconsolidated aquifer. Water-level data from multiple-aquifer wells used in this study tend to indicate trends in the unconsolidated aquifer because most of the yields are from the unconsolidated aquifer.
The water surface slopes generally eastward across the study area at about 10.5 feet per mile, and the water movement is in that direction. Flattening of the gradient, as indicated by widely spaced contours, probably results from a high hydraulic conductivity of the material through which the water is moving and an increased thickness of water-bearing materials. Areas defined by widely spaced contours, such as southeastern Haskell County, generally are well suited for development of large-capacity wells. An area of apparently flat gradient north of Garden City, however, is the result of a distorted flow pattern caused by very intensive pumping in a localized area.
Closely spaced contours in the study area indicate a steep slope of the potentiometric surface caused by low hydraulic conductivity and reduced thickness of water-bearing materials. A belt of closely spaced contours extends across parts of Grant, Haskell, Seward, and Stevens Counties. Water-well drillers report that fine-grained deposits of low hydraulic conductivity commonly occur in the same areas as those shown by closely spaced contours.
The Cimarron River from the U.S. Highway 83 bridge to the Kansas-Oklahoma State line and the Arkansas River in Gray County are examples of gaining streams because they intercept the water table. Thus, the upstream flexures of the contours show flow toward the streams. The lack of upstream flexures in other areas where contour lines cross stream valleys indicates that the water table lies below the streambed and that the streams receive no contribution from ground water in those reaches.
Saturated Thickness--The area of the unconsolidated aquifer underlain by sufficient saturated material to support irrigation is about 6,600 square miles, or about 75 percent of the total 8,900 square miles in southwestern Kansas. This area of saturated material is referred to as the main part of the unconsolidated aquifer, as shown on plate 3. In other parts of the area, the unconsolidated aquifer is extremely thin or absent.
The saturated thickness of the unconsolidated deposits is shown on plate 3. Within the main part of the unconsolidated aquifer, the saturated thickness ranges from less than 50 feet to about 630 feet, with a median saturated thickness of 284 feet. Generally, the areas of greatest saturated thickness coincide with areas where unconsolidated deposits overlie the deepest channels in the bedrock surface. An example is the area in southwestern Seward County.
Saturated thickness may be used as an approximation in locating a possible well site. However, the collective thickness, degree of sorting, and hydraulic conductivity of water-yielding materials within the saturated section are important considerations in developing an irrigation supply. In test drilling for a well site, contractors commonly estimate discharge from the well by assigning arbitrary values of yield per foot of water-yielding material.
The unconsolidated aquifer, in general, has a specific yield (storage coefficient) that reflects unconfined conditions. Results of aquifer tests in in Finney County (Meyers and others, 1970) indicate a range in specific yield of 0.05 to 0.22 and in Haskell County (Gutentag and Stullken, 1976) indicate a range of 0.15 to 0.20.
In some areas of relatively great saturated thickness, the water-yielding layers are separated by numerous fine-grained layers, which result in confined conditions. Early in the development of irrigation in Grant and Stanton Counties, aquifer tests in the principal water-yielding layers indicated storage coefficients that ranged from 0.001 to 0.0001 (Fader and others, 1964). As pumpage for irrigation greatly increased, however, water-level declines reduced the confining effects of the upper layers. Subsequent tests probably would indicate a storage coefficient nearly equal to that of an unconfined aquifer.
It is estimated that the specific yield for the principal water-yielding zones ranges from 0.15 to 0.20 and that the weighted average for the unconsolidated aquifer would be about 0.15.
The amount of ground water stored in the unconsolidated aquifer in southwestern Kansas was determined by computing the area of each saturated thickness interval shown on plate 3, multiplying by the average thickness of each interval, summing the products, and multiplying their summation (total volume) by the specific yield. Assuming that the average specific yield is 0.15 for the whole saturated thickness, the total volume of water in storage in southwestern Kansas is computed to be about 150 million acre-feet as of January 1975. Assuming that only 70 percent of the total volume of water is economically recoverable by wells, approximately 105 million acre-feet are available for pumping.
Potential Yield--The potential yield, as used in this report, is the calculated quantity that could be pumped from a well when the water-level drawdown is equivalent to 70 percent of the effective thickness of the unconsolidated aquifer. The effective thickness, or aggregate thickness of water-yielding material in the saturated part of the aquifer, probably is the most important factor in estimating well yield.
The map showing the potential yield to wells (fig. 5) was drawn on the basis of driller's well-production tests during which drawdowns were measured at different stages of increasing discharge. The computed potential yield to irrigation wells in the unconsolidated aquifer ranges from less than 100 gal/min to as much as 3,000 gal/min. Potential yields of more than 1,000 gal/min are very speculative, owing to a deficiency in the data available and the method of computing values from well-production tests. The actual yield of an individual well depends on many factors including well construction, method of completion, density of well development in the surrounding area (mutual interference), and transmissivity of the water-yielding deposits at the well site. Because wells normally are designed for irrigation requirements and pump efficiency rather than aquifer potential, the estimated yields are useful chiefly as a general guide in planning. Before selecting a site for installation of a large-capacity well, test drilling is a requisite to ensure the greatest yield for the least pumping lift.
Figure 5--Potential yield of the unconsolidated aquifer, 1975. [Larger version available as an Acrobat PDF file.]
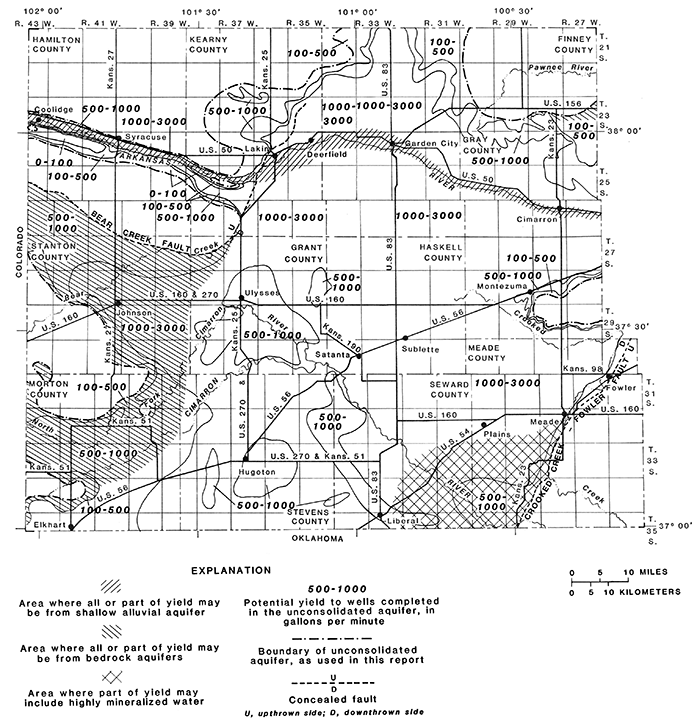
The area delineated as the shallow alluvial aquifer along the Arkansas River indicates the location of Quaternary alluvium where large quantities of ground water may be obtained in addition to the quantities indicated for the principal part of the unconsolidated aquifer.
In southwestern Meade and southeastern Seward Counties, the potenti al yield ranges for 500 to 3,000 gal/min. However, it may be necessary to restrict well yields from the unconsolidated aquifer because mineralized water commonly is present in the deep water-yielding layers. In these areas, extreme caution shoul d be used in developing the potential yield of water. It is suggested that test drilling be done and electric logs be run to determine the probable water quality in the deep parts of the aquifer. At some sites, it may be desirable to install test wells and collect water samples to determine the water quality.
Prev Page--Geologic framework || Next Page--Water Quality
Kansas Geological Survey, Geohydrology
Placed on web July 28, 2013; originally published 1981.
Comments to webadmin@kgs.ku.edu
The URL for this page is http://www.kgs.ku.edu/Publications/Bulletins/IRR7/04_hydro.html