![]()
Prev Page--Hydrology || Next Page--Hydrologic Cycle
Quality of Water for Irrigation
The chemical quality of water in southwestern Kansas generally is the result of conditions within the hydrologic system. The quality of surface-water inflow, as shown by the analyses listed in table 2, is largely controlled by the effects of stream regulation and return flow from irrigation use occurring outside the study area. The quality of surface-water outflow, which is contributed mostly from ground-water storage, is dependent on geohydrologic conditions within the area. The quality of ground water in the various geologic formations, as shown by the analyses listed in table 3, is a result of the quantity and quality of recharge and the interaction with chemical constituents in each aquifer system.
In this report, water is classified by type according to the principal constituents and by general categories in terms of dissolved-solids concentrations in milligrams per liter (mg/L). Freshwater is defined as having less than 1,000 mg/L dissolved solids; saline water, as having 1,000 to 10,000 mg/L; brackish water, as having 10,000 to 35,000 mg/L; and saltwater or brine, as having more than 35,000 mg/L dissolved solids.
Table 2--Chemical analyses of surface water in southwestern Kansas. [Concentrations in milligrams per liter]
| Location | Site number |
Date of collection |
Discharge (ft3/s) |
Temp. (°C) |
Dissolved silica (SiO2) |
Dissolved calcium (Ca) |
Dissolved magnesium (Mg) |
Dissolved sodium (Na) |
Dissolved potassium (K) |
Carbonate (CO3) |
Bicarbonate (HCO3) |
|---|---|---|---|---|---|---|---|---|---|---|---|
| Arkansas River gaging stations | |||||||||||
| Near Coolidge | 01/08/1976 | 21 | 1.0 | 15 | 440 | 180 | 640 | 12 | 0 | 329 | |
| At Dodge City | 01/06/1976 | 2.2 | 1.0 | 14 | 130 | 42 | 96 | 6.8 | 0 | 320 | |
| Cimarron River sampling sites | |||||||||||
| 32 33W 21CCA | 2 | 11/14/1974 | .01 | 3.0 | 20 | 94 | 31 | 61 | 5.0 | 0 | 390 |
| 32 33W 36BDA | 3 | 11/14/1974 | .35 | 6.0 | 15 | 78 | 30 | 36 | 5.5 | 0 | 300 |
| 33 32W 20ACD | 4 | 11/14/1974 | 11.5 | 8.5 | 20 | 77 | 24 | 43 | 3.8 | 0 | 260 |
| 33 32W 25ACC | 5 | 11/14/1974 | 19.1 | 10.0 | 20 | 83 | 23 | 50 | 4.0 | 0 | 240 |
| 34 30W 31BBC | 7 | 11/14/1974 | 41.9 | 11.5 | 20 | 93 | 34 | 120 | 0 | 240 | |
| 34 31W 15CBA | 6 | 11/14/1974 | 39.6 | 10.5 | 19 | 88 | 27 | 86 | 4.5 | 0 | 260 |
| 35 29W 08DDC | 10 | 11/14/1974 | 57.7 | 11.0 | 20 | 93 | 37 | 380 | 5.8 | 0 | 230 |
| 35 29W 10BCD | 11 | 11/14/1974 | 56.5 | 6.0 | 20 | 94 | 42 | 410 | 5.8 | 0 | 240 |
| 35 30W 09CCB | 8 | 11/14/1974 | 56.3 | 6.0 | 21 | 86 | 32 | 140 | 5.2 | 0 | 240 |
| 35 30W 13BBB | 9 | 11/14/1974 | 55.7 | 9.0 | 21 | 96 | 38 | 370 | 5.2 | 0 | 250 |
| Location | Site number |
Dissolved sulfate (SO4) |
Dissolved chloride (Cl) |
Dissolved fluoride (F) |
Dissolved nitrate (NO3) |
Dissolved solids (residue at 180° C) |
Hardness | Sodium adsorption ratio |
Specific conductance (µmhos/cm at 25°C) |
pH | |
|---|---|---|---|---|---|---|---|---|---|---|---|
| (Ca,Mg) | Non- carbonate |
||||||||||
| Arkansas River gaging stations | |||||||||||
| Near Coolidge | 2,500 | 200 | 0.6 | 10.2 | 4,510 | 1,800 | 1,600 | 6.5 | 5,000 | 8.8 | |
| At Dodge City | 370 | 43 | .8 | 30.5 | 903 | 500 | 240 | 1.9 | 1,320 | 7.6 | |
| Cimarron River sampling sites | |||||||||||
| 32 33W 21CCA | 2 | 140 | 23 | .8 | 0.2 | 566 | 360 | 42 | 1.4 | 900 | 7.8 |
| 32 33W 36BDA | 3 | 120 | 19 | .8 | 0.4 | 452 | 320 | 72 | 0.9 | 720 | 7.9 |
| 33 32W 20ACD | 4 | 140 | 21 | .8 | 5.4 | 461 | 290 | 74 | 1.1 | 730 | 7.9 |
| 33 32W 25ACC | 5 | 150 | 40 | .8 | 6.2 | 492 | 300 | 110 | 1.3 | 780 | 7.6 |
| 34 30W 31BBC | 7 | 150 | 190 | .8 | 5.2 | 739 | 370 | 170 | 2.7 | 1,260 | 8.1 |
| 34 31W 15CBA | 6 | 150 | 98 | .8 | 4.8 | 608 | 330 | 120 | 2.1 | 1,010 | 7.9 |
| 35 29W 08DDC | 10 | 180 | 620 | .8 | 4.6 | 1,460 | 380 | 190 | 8.4 | 2,590 | 7.9 |
| 35 29W 10BCD | 11 | 180 | 650 | .8 | 4.2 | 1,520 | 410 | 210 | 8.9 | 2,650 | 7.9 |
| 35 30W 09CCB | 8 | 150 | 220 | .8 | 4.4 | 772 | 350 | 150 | 3.3 | 1,340 | 7.8 |
| 35 30W 13BBB | 9 | 170 | 580 | .8 | 4.0 | 1,400 | 400 | 190 | 8.1 | 2,460 | 8.0 |
Table 3--Chemical analyses of ground water in southwestern Kansas. [Concentrations in milligrams per liter] [(1) Geologic source: QA, Quaternary alluvium; QU, undifferentiated Pleistocene deposits; TO, Ogallala Formation; KN, Niobrara Chalk; KD, Dakota Formation; KJ, Upper Jurassic-Lower Cretaceous rocks; PW, Whitehorse Formation; PO, Day Creek Dolomite.]
| Finney County | |||||||||||
|---|---|---|---|---|---|---|---|---|---|---|---|
| Local well number |
Well depth (ft) |
Geologic source (1) |
Date of collection |
Temp. (°C) |
Dissolved silica (SiO2) |
Total iron (Fe) |
Dissolved manganese (Mn) |
Dissolved calcium (Ca) |
Dissolved magnesium (Mg) |
Sodium (Na) |
Potassium (K) |
| 21 32W 20CB | 203 | QU,TO | 10/12/1960 | 31 | 0.01 | 0.00 | 38 | 36 | 61 | ||
| 22 27W 14BD | 485 | KD | 07/15/1970 | 18.0 | 6.1 | .06 | .02 | 11 | 1.1 | 176 | 5.4 |
| 23 32W 20DC | 261 | QU,TO | 11/19/1960 | 24 | .01 | .00 | 73 | 34 | 34 | ||
| 23 34W 26CCC | 309 | QU,TO | 05/19/1969 | 14.5 | .10 | .00 | 248 | 91 | 121 | 12 | |
| 24 32W 18CC | 280 | TO | 03/10/1961 | 17 | .01 | 83 | 21 | 46 | |||
| 24 33W 12CB | 45 | QA | 05/07/1964 | 14.5 | 17 | .00 | .00 | 360 | 134 | 351 | 17 |
| 25 31W 02A | 300 | QU,TO | 07/31/1970 | 15.5 | 1.5 | .05 | 107 | 34 | 73 | 7.1 | |
| 26 32W 26CD | 205 | QU,TO | 04/29/1963 | 17 | .09 | .00 | 50 | 9.0 | 12 | 3.2 | |
| 26 33W 19DAC | 22 | QU,TO | 04/10/1968 | 16.0 | 19 | .02 | .00 | 61 | 6.8 | 9.3 | 3.2 |
| Local well number |
Carbonate (CO3) |
Bicarbonate (HCO3) |
Dissolved sulfate (SO4) |
Dissolved chloride (Cl) |
Dissolved fluoride (F) |
Dissolved nitrate (NO3) |
Dissolved solids (residue at 180° C) |
Hardness | Sodium adsorption ratio |
Specific conductance (µmhos/cm at 25°C) |
pH | |
|---|---|---|---|---|---|---|---|---|---|---|---|---|
| (Ca,Mg) | Non- carbonate |
|||||||||||
| 21 32W 20CB | 0 | 261 | 109 | 27 | 3.6 | 0.0 | 434 | 243 | 29 | 1.7 | 760 | |
| 22 27W 14BD | 0 | 244 | 106 | 77 | 2.3 | 1.8 | 508 | 32 | 0 | 14 | 820 | 7.8 |
| 23 32W 20DC | 0 | 239 | 138 | 31 | 1.0 | 12 | 465 | 322 | 126 | .8 | 790 | |
| 23 34W 26CCC | 0 | 181 | 912 | 117 | .8 | 10 | 1,680 | 993 | 845 | 1.7 | 2,100 | 7.5 |
| 24 32W 18CC | 0 | 183 | 199 | 20 | .7 | 6.6 | 484 | 294 | 144 | 1.2 | 790 | 7.9 |
| 24 33W 12CB | 0 | 334 | 1,620 | 168 | 1.8 | 38 | 2,870 | 1,450 | 1,170 | 4.0 | 3,530 | |
| 25 31W 02A | 0 | 224 | 308 | 38 | 1.0 | 15 | 728 | 406 | 222 | 1.6 | 1,030 | 7.7 |
| 26 32W 26CD | 0 | 185 | 20 | 7.0 | .3 | 4.9 | 214 | 162 | 10 | .4 | 370 | |
| 26 33W 19DAC | 0 | 200 | 16 | 11 | .3 | 7.1 | 232 | 180 | 16 | .3 | 380 | 7.6 |
| Grant County | |||||||||||
|---|---|---|---|---|---|---|---|---|---|---|---|
| Local well number |
Well depth (ft) |
Geologic source (1) |
Date of collection |
Temp. (°C) |
Dissolved silica (SiO2) |
Total iron (Fe) |
Dissolved manganese (Mn) |
Dissolved calcium (Ca) |
Dissolved magnesium (Mg) |
Sodium (Na) |
Potassium (K) |
| 27 37W 11AB | 340 | QU,TO | 05/07/1964 | 23 | 0.00 | 0.00 | 70 | 35 | 75 | 5.5 | |
| 28 35W 15BB | 220 | QU,TO | 10/28/1941 | 16.5 | .68 | .00 | 55 | 12 | 45 | ||
| 28 36W 13AC | 438 | QU,TO | 05/04/1964 | 19 | .00 | .00 | 67 | 28 | 46 | 4.4 | |
| 28 37W 21DAA | 300 | QU,TO | 03/20/1968 | 22 | .16 | .00 | 67 | 30 | 54 | 4.8 | |
| 28 38W 04CC | 285 | QU,TO | 07/20/1959 | 15.5 | 25 | .09 | .00 | 89 | 58 | 86 | |
| 29 35W 15AB | 460 | QU,TO | 05/25/1960 | 18.5 | 23 | .03 | .00 | 75 | 27 | 51 | |
| 29 36W 04BAB | 645 | TO,KJ | 08/14/1975 | 25 | .13 | .00 | 51 | 23 | 102 | 4.8 | |
| 29 36W 04BCC | 380 | QU,TO | 08/14/1975 | 22 | .19 | .00 | 74 | 27 | 32 | 4.0 | |
| 30 38W 05BB | 310 | QU,TO | 05/14/1964 | 15 | .01 | .00 | 60 | 19 | 35 | 3.3 | |
| 30 38W 13CC | 560 | QU,TO | 05/14/1964 | 17 | .00 | .00 | 54 | 24 | 46 | 3.8 | |
| Local well number |
Carbonate (CO3) |
Bicarbonate (HCO3) |
Dissolved sulfate (SO4) |
Dissolved chloride (Cl) |
Dissolved fluoride (F) |
Dissolved nitrate (NO3) |
Dissolved solids (residue at 180° C) |
Hardness | Sodium adsorption ratio |
Specific conductance (µmhos/cm at 25°C) |
pH | |
|---|---|---|---|---|---|---|---|---|---|---|---|---|
| (Ca,Mg) | Non- carbonate |
|||||||||||
| 27 37W 11AB | 0 | 288 | 193 | 24 | 2.0 | 26 | 596 | 318 | 82 | 1.8 | 850 | 7.5 |
| 28 35W 15BB | 0 | 190 | 104 | 11 | .5 | 4.1 | 327 | 186 | 30 | 1.4 | ||
| 28 36W 13AC | 0 | 254 | 137 | 15 | 1.2 | 18 | 461 | 282 | 74 | 1.2 | 670 | 7.6 |
| 28 37W 21DAA | 0 | 205 | 191 | 24 | 1.5 | 19 | 514 | 290 | 122 | 1.4 | 780 | 7.8 |
| 28 38W 04CC | 0 | 227 | 349 | 57 | 2.1 | 15 | 793 | 460 | 274 | 1.7 | 1,220 | |
| 29 35W 15AB | 0 | 242 | 171 | 16 | 1.2 | 8.0 | 491 | 298 | 100 | 1.3 | 790 | |
| 29 36W 04BAB | 0 | 217 | 210 | 30 | 1.2 | 3.3 | 557 | 222 | 44 | 3.0 | 870 | 7.6 |
| 29 36W 04BCC | 0 | 193 | 107 | 67 | 1.1 | 9.2 | 438 | 296 | 138 | .8 | 760 | 7.6 |
| 30 38W 05BB | 0 | 190 | 110 | 26 | .9 | 7.5 | 371 | 228 | 72 | 1.0 | 570 | 7.7 |
| 30 38W 13CC | 0 | 217 | 129 | 13 | 1.0 | 13 | 408 | 233 | 55 | 1.3 | 600 | 7.7 |
| Gray County | |||||||||||
|---|---|---|---|---|---|---|---|---|---|---|---|
| Local well number |
Well depth (ft) |
Geologic source (1) |
Date of collection |
Temp. (°C) |
Dissolved silica (SiO2) |
Total iron (Fe) |
Dissolved manganese (Mn) |
Dissolved calcium (Ca) |
Dissolved magnesium (Mg) |
Sodium (Na) |
Potassium (K) |
| 24 29W 23BAA2 | 200 | QU,TO | 06/07/1967 | 16.5 | 36 | 0.05 | 0.00 | 53 | 25 | 22 | 5.2 |
| 24 30W 01BCB | 170 | QU,TO | 05/07/1970 | 15.0 | 45 | .11 | .00 | 58 | 25 | 30 | 6.3 |
| 26 28W 060 | 80 | QA | 07/06/1970 | 14.5 | 21 | .02 | .00 | 130 | 40 | 45 | 7.6 |
| 26 29W 08B | 246 | QU,TO | 05/12/1970 | 15.5 | 16 | .05 | .00 | 56 | 11 | 19 | 3.8 |
| 27 27W 10DCB | 100 | QU,TO | 07/28/1964 | 20 | .00 | .00 | 60 | 9.8 | 17 | 4.1 | |
| 29 28W 28CDC | 204 | QU,TO | 05/08/1964 | 19 | .04 | .00 | 57 | 11 | 16 | 3.0 | |
| 29 30W 36C | QU,TO | 05/21/1970 | 16.0 | 18 | .04 | .00 | 45 | 7.7 | 14 | 3.0 | |
| Local well number |
Carbonate (CO3) |
Bicarbonate (HCO3) |
Dissolved sulfate (SO4) |
Dissolved chloride (Cl) |
Dissolved fluoride (F) |
Dissolved nitrate (NO3) |
Dissolved solids (residue at 180° C) |
Hardness | Sodium adsorption ratio |
Specific conductance (µmhos/cm at 25°C) |
pH | |
|---|---|---|---|---|---|---|---|---|---|---|---|---|
| (Ca,Mg) | Non- carbonate |
|||||||||||
| 24 29W 23BAA2 | 0 | 217 | 65 | 22 | 1.2 | 20 | 356 | 235 | 57 | 0.6 | 550 | 7.6 |
| 24 30W 01BCB | 0 | 215 | 84 | 22 | 2.7 | 15 | 396 | 248 | 72 | .8 | 600 | 7.7 |
| 26 28W 060 | 0 | 278 | 284 | 35 | .8 | 26 | 740 | 489 | 261 | .9 | 1,060 | 7.5 |
| 26 29W 08B | 0 | 215 | 26 | 9.0 | .4 | 12 | 270 | 184 | 8 | .6 | 430 | 7.6 |
| 27 27W 10DCB | 0 | 232 | 17 | 7.0 | .3 | 9.3 | 259 | 190 | 0 | .6 | 410 | 7.4 |
| 29 28W 28CDC | 0 | 210 | 26 | 10 | .5 | 10 | 256 | 187 | 15 | .5 | 172 | 7.7 |
| 29 30W 36C | 0 | 183 | 14 | 4.0 | .3 | 11 | 206 | 144 | 0 | .5 | 340 | 7.7 |
| Hamilton County | |||||||||||
|---|---|---|---|---|---|---|---|---|---|---|---|
| Local well number |
Well depth (ft) |
Geologic source (1) |
Date of collection |
Temp. (°C) |
Dissolved silica (SiO2) |
Total iron (Fe) |
Dissolved manganese (Mn) |
Dissolved calcium (Ca) |
Dissolved magnesium (Mg) |
Sodium (Na) |
Potassium (K) |
| 21 42W 03CB | KD | 06/21/1972 | 15 | 1.1 | 0.00 | 4.8 | 2.0 | 220 | 5.2 | ||
| 23 42W 26DCA | 70 | QA | 04/30/1964 | 25 | .00 | .00 | 472 | 127 | 505 | 21 | |
| 23 43W 26BCC | 22 | QA | 09/02/1960 | 22 | .20 | .00 | 276 | 116 | 352 | ||
| 24 43W 10DD | 60 | QU,TO | 11/26/1940 | 14.5 | .7 | 167 | 48 | 37 | |||
| 26 41W 36CCD | QU,TO | 04/29/1964 | 16.0 | 25 | .13 | .00 | 105 | 39 | 54 | 7.7 | |
| 24 39W 35CBA | 90 | QU,TO | 04/23/1962 | 25 | .01 | .00 | 200 | 35 | 140 | 7.2 | |
| Local well number |
Carbonate (CO3) |
Bicarbonate (HCO3) |
Dissolved sulfate (SO4) |
Dissolved chloride (Cl) |
Dissolved fluoride (F) |
Dissolved nitrate (NO3) |
Dissolved solids (residue at 180° C) |
Hardness | Sodium adsorption ratio |
Specific conductance (µmhos/cm at 25°C) |
pH | |
|---|---|---|---|---|---|---|---|---|---|---|---|---|
| (Ca,Mg) | Non- carbonate |
|||||||||||
| 21 42W 03CB | 0 | 398 | 121 | 38 | 2.8 | 0.4 | 598 | 20 | 0 | 21 | 960 | 8.2 |
| 23 42W 26DCA | 0 | 295 | 2,040 | 311 | 1.0 | 10 | 3,660 | 1,700 | 1,460 | 5.3 | 4,500 | 7.4 |
| 23 43W 26BCC | 0 | 254 | 1,480 | 122 | 1.4 | 16 | 2,510 | 1,170 | 958 | 4.5 | 3,310 | |
| 24 43W 10DD | 0 | 320 | 215 | 56 | .7 | 159 | 843 | 616 | 354 | .7 | ||
| 26 41W 36CCD | 0 | 234 | 291 | 25 | 1.5 | 14 | 678 | 422 | 230 | 1.1 | 970 | |
| 24 39W 35CBA | 0 | 220 | 620 | 84 | .5 | 19 | 1,250 | 650 | 470 | 2.4 | 1,800 | |
| Haskell County | |||||||||||
|---|---|---|---|---|---|---|---|---|---|---|---|
| Local well number |
Well depth (ft) |
Geologic source (1) |
Date of collection |
Temp. (°C) |
Dissolved silica (SiO2) |
Total iron (Fe) |
Dissolved manganese (Mn) |
Dissolved calcium (Ca) |
Dissolved magnesium (Mg) |
Sodium (Na) |
Potassium (K) |
| 27 31W 11CBB | 250 | QU,TO | 05/04/1966 | 16.0 | 18 | 0.00 | 0.00 | 53 | 7.8 | 20 | 3.4 |
| 28 33W 04A | 620 | QU,TO | 04/30/1970 | 17.0 | 18 | .08 | .00 | 53 | 5.9 | 16 | 2.4 |
| 28 33W 36D | 590 | QU,TO | 04/30/1970 | 18 | .09 | .00 | 43 | 11 | 24 | 2.8 | |
| 28 34W 15DAB | 408 | QU,TO | 04/30/1970 | 17.0 | 19 | .12 | .00 | 51 | 13 | 19 | 2.8 |
| 29 32W 26CB2 | 384 | QU,TO | 08/04/1964 | 16 | .00 | .00 | 48 | 11 | 27 | 3.2 | |
| 30 31W 140B | 270 | QU,TO | 05/05/1964 | 17 | .00 | .00 | 51 | 11 | 20 | 2.7 | |
| 30 34W 28ABB | 532 | QU,TO | 04/30/1970 | 18.0 | 25 | .13 | .00 | 62 | 30 | 41 | 5.2 |
| Local well number |
Carbonate (CO3) |
Bicarbonate (HCO3) |
Dissolved sulfate (SO4) |
Dissolved chloride (Cl) |
Dissolved fluoride (F) |
Dissolved nitrate (NO3) |
Dissolved solids (residue at 180° C) |
Hardness | Sodium adsorption ratio |
Specific conductance (µmhos/cm at 25°C) |
pH | |
|---|---|---|---|---|---|---|---|---|---|---|---|---|
| (Ca,Mg) | Non- carbonate |
|||||||||||
| 27 31W 11CBB | 0 | 205 | 23 | 8.0 | 0.4 | 14 | 249 | 164 | 0 | 0.7 | 400 | 7.7 |
| 28 33W 04A | 0 | 176 | 26 | 10 | .4 | 12 | 230 | 156 | 12 | .6 | 360 | 7.7 |
| 28 33W 36D | 0 | 185 | 36 | 8.0 | .6 | 6.2 | 245 | 152 | 0 | .9 | 380 | 7.7 |
| 28 34W 15DAB | 0 | 181 | 31 | 20 | .8 | 11 | 258 | 180 | 32 | .6 | 420 | 7.8 |
| 29 32W 26CB2 | 0 | 198 | 47 | 14 | .6 | 1.8 | 266 | 165 | 3 | .9 | 430 | 7.4 |
| 30 31W 140B | 0 | 200 | '36 | 7.0 | .6 | 4.3 | 248 | 172 | 8 | .7 | 390 | 7.8 |
| 30 34W 28ABB | 0 | 210 | 154 | 20 | 1.1 | 9.7 | 465 | 278 | 106 | 1.1 | 690 | 7.7 |
| Kearny County | |||||||||||
|---|---|---|---|---|---|---|---|---|---|---|---|
| Local well number |
Well depth (ft) |
Geologic source (1) |
Date of collection |
Temp. (°C) |
Dissolved silica (SiO2) |
Total iron (Fe) |
Dissolved manganese (Mn) |
Dissolved calcium (Ca) |
Dissolved magnesium (Mg) |
Sodium (Na) |
Potassium (K) |
| 21 35W 27CCA | 163 | KN | 05/22/1967 | 28 | 1.4 | 0.00 | 51 | 27 | 42 | 6.8 | |
| 22 37W 34DD | 154 | QU,TO | 11/07/1940 | 15.0 | 2.4 | 64 | 22 | 43 | |||
| 23 35W 25BBB2 | 320 | QU,TO | 05/08/1964 | 15.0 | 18 | .01 | .00 | 251 | 4Q | Q5 | 11 |
| 24 35W 22CCC | 65 | QA | 05/07/1964 | 14.5 | 13 | .0 | .00 | 354 | 101 | 362 | 17 |
| 24 36W 23CBB2 | 280 | QA,TO | 04/26/1963 | 16.0 | 19 | .07 | .18 | 210 | 100 | 164 | 13 |
| 25 36W 03CCD | 40 | QA | 09/21/1960 | 14.5 | 12 | .02 | .00 | 346 | 115 | 416 | |
| 25 36W 18ACC | 150 | QU,TO | 09/21/1960 | 14.5 | 10 | .01 | .00 | 367 | 94 | 401 | |
| 26 37W 21DDD | 330 | QU,TO | 04/26/1963 | 16.5 | 19 | .07 | 56 | 24 | 35 | 5.0 | |
| 26 38W 06BCC | 300 | KD | 04/26/1963 | 18.0 | 18 | .12 | .00 | 29 | 26 | 41 | 5.5 |
| Local well number |
Carbonate (CO3) |
Bicarbonate (HCO3) |
Dissolved sulfate (SO4) |
Dissolved chloride (Cl) |
Dissolved fluoride (F) |
Dissolved nitrate (NO3) |
Dissolved solids (residue at 180° C) |
Hardness | Sodium adsorption ratio |
Specific conductance (µmhos/cm at 25°C) |
pH | |
|---|---|---|---|---|---|---|---|---|---|---|---|---|
| (Ca,Mg) | Non- carbonate |
|||||||||||
| 21 35W 27CCA | 0 | 234 | 76 | 28 | 1.4 | 23 | 399 | 238 | 46 | 1.2 | 610 | 8.0 |
| 22 37W 34DD | 0 | 185 | 144 | 20 | .9 | 13 | 402 | 255 | 103 | 1.2 | ||
| 23 35W 25BBB2 | 0 | 200 | 678 | 110 | .5 | 15 | 1,330 | 828 | 664 | 1.5 | 1,800 | 7.2 |
| 24 35W 22CCC | 0 | 256 | 1,660 | 116 | 1.1 | 17 | 2,770 | 1,300 | 1,090 | 4.4 | 3,330 | 7.2 |
| 24 36W 23CBB2 | 0 | 246 | 022 | 92 | 1.0 | 8.4 | 1,650 | 935 | 733 | 2.3 | 2,180 | |
| 25 36W 03CCD | 0 | 268 | 1,750 | 131 | 1.4 | 11 | 2,920 | 1,340 | 1,120 | 5.0 | 3,810 | 7.3 |
| 25 36W 18ACC | 0 | 166 | 1,760 | 139 | .8 | 10 | 2,870 | 1,300 | 1,170 | 4.8 | 3,810 | 7.2 |
| 26 37W 21DDD | 0 | 251 | 74 | 16 | .9 | 10 | 363 | 238 | 32 | 1.0 | 590 | |
| 26 38W 06BCC | 22 | 200 | 35 | 15 | 2.4 | 5.3 | 298 | 180 | 0 | 1.3 | 480 | |
| Meade County | |||||||||||
|---|---|---|---|---|---|---|---|---|---|---|---|
| Local well number |
Well depth (ft) |
Geologic source (1) |
Date of collection |
Temp. (°C) |
Dissolved silica (SiO2) |
Total iron (Fe) |
Dissolved manganese (Mn) |
Dissolved calcium (Ca) |
Dissolved magnesium (Mg) |
Sodium (Na) |
Potassium (K) |
| 31 28W 23AC | 290 | QU,TO | 09/10/1964 | 19 | 0.00 | 0.00 | 58 | 14 | 15 | 3.2 | |
| 32 29W 27AAB | 583 | PW | 12/17/1974 | 8.3 | .86 | .22 | 320 | 120 | 87 | 10 | |
| 32 29W 27AAB2 | 468 | TO | 11/22/1974 | 22 | 1.6 | .00 | 59 | 15 | 27 | 4.8 | |
| 33 28W 29BC | 120 | TO | 07/28/1964 | 21 | .00 | .00 | 58 | 15 | 63 | 4.2 | |
| 34 30W 27BBB | 720 | PW | 11/21/1974 | 10 | .88 | .00 | 1,500 | 470 | 10,800 | 38 | |
| 34 30W 27BBB2 | 504 | TO | 11/20/1974 | 20 | .36 | .00 | 83 | 21 | 48 | 4.5 | |
| 35 30W 09ABC | 260 | QU,TO | 05/11/1966 | 17.0 | 22 | .01 | .00 | 50 | 20 | 38 | 4.2 |
| Local well number |
Carbonate (CO3) |
Bicarbonate (HCO3) |
Dissolved sulfate (SO4) |
Dissolved chloride (Cl) |
Dissolved fluoride (F) |
Dissolved nitrate (NO3) |
Dissolved solids (residue at 180° C) |
Hardness | Sodium adsorption ratio |
Specific conductance (µmhos/cm at 25°C) |
pH | |
|---|---|---|---|---|---|---|---|---|---|---|---|---|
| (Ca,Mg) | Non- carbonate |
|||||||||||
| 31 28W 23AC | 0 | 222 | 30 | 9.0 | 0.8 | 12 | 271 | 202 | 20 | 0.5 | 430 | 7.4 |
| 32 29W 27AAB | 0 | 66 | 1,400 | 16 | .9 | 1.4 | 1,960 | 1,300 | 54 | 1.1 | 2,300 | 7.4 |
| 32 29W 27AAB2 | 0 | 200 | 73 | 18 | .8 | 3.5 | 319 | 210 | 48 | .8 | 500 | 8.0 |
| 33 28W 29BC | 0 | 220 | 52 | 79 | .8 | 3.5 | 405 | 206 | 26 | 1.9 | 670 | 7.4 |
| 34 30W 27BBB | 0 | 78 | 2,800 | 18,200 | 1.0 | .3 | 33,800 | 5,800 | 5,600 | 62 | 57,300 | 7.6 |
| 34 30W 27BBB2 | 0 | 190 | 200 | 21 | .9 | 6.3 | 494 | 290 | 140 | 1.2 | 750 | 7.9 |
| 35 30W 09ABC | 0 | 212 | 85 | 29 | 1.0 | 5.8 | 369 | 229 | 55 | 1.1 | 580 | 7.7 |
| Morton County | |||||||||||
|---|---|---|---|---|---|---|---|---|---|---|---|
| Local well number |
Well depth (ft) |
Geologic source (1) |
Date of collection |
Temp. (°C) |
Dissolved silica (SiO2) |
Total iron (Fe) |
Dissolved manganese (Mn) |
Dissolved calcium (Ca) |
Dissolved magnesium (Mg) |
Sodium (Na) |
Potassium (K) |
| 31 43W 20CBB | 157 | QU,TO | 04/25/1963 | 13.0 | 18 | 0.05 | 0.00 | 62 | 30 | 30 | 3.6 |
| 32 39W 18AA | 170 | QU,TO | 10/13/1939 | 15.5 | 1.5 | 74 | 47 | 67 | |||
| 32 41W 28DB | 600 | PD | 04/09/1962 | 19.0 | 25 | .03 | .00 | 597 | 97 | 58 | 5.0 |
| 32 42W 14CCC | 187 | QU,TO | 04/24/1963 | 16.5 | 25 | .05 | .00 | 38 | 40 | 44 | 4.2 |
| 33 39W 16ABB | 422 | QU,TO | 04/25/1963 | 14.5 | 25 | 1.8 | .00 | 61 | 37 | 48 | 5.5 |
| 33 43W 15AAC | 260 | QU,TO | 04/25/1963 | 18.0 | 25 | 1.5 | .00 | 39 | 38 | 49 | 6.6 |
| 34 42W 05BDC | 75 | QU | 04/04/1962 | 25 | .02 | .00 | 450 | 95 | 83 | 5.2 | |
| 35 40W 03BBB | 385 | QU,TO | 04/25/1963 | 25 | .17 | .00 | 114 | 42 | 56 | 4.2 | |
| 35 43W 24AA | 270 | QU,TO | 04/12/1965 | 23 | .00 | .00 | 64 | 28 | 59 | 5.8 | |
| Local well number |
Carbonate (CO3) |
Bicarbonate (HCO3) |
Dissolved sulfate (SO4) |
Dissolved chloride (Cl) |
Dissolved fluoride (F) |
Dissolved nitrate (NO3) |
Dissolved solids (residue at 180° C) |
Hardness | Sodium adsorption ratio |
Specific conductance (µmhos/cm at 25°C) |
pH | |
|---|---|---|---|---|---|---|---|---|---|---|---|---|
| (Ca,Mg) | Non- carbonate |
|||||||||||
| 31 43W 20CBB | 0 | 205 | 98 | 44 | 1.3 | 11 | 399 | 278 | 110 | 0.8 | 670 | |
| 32 39W 18AA | 0 | 242 | 270 | 24 | 1.9 | 6.2 | 613 | 380 | 182 | 1.5 | ||
| 32 41W 28DB | 0 | 163 | 1,780 | 10 | 2.3 | 8.0 | 2,670 | 1,890 | 1,750 | .6 | 2,920 | |
| 32 42W 14CCC | 0 | 244 | 118 | 12 | 3.6 | 9.7 | 415 | 260 | 60 | 1.2 | 660 | |
| 33 39W 16ABB | 0 | 229 | 183 | 24 | .6 | .4 | 498 | 304 | 116 | 1.2 | 790 | |
| 33 43W 15AAC | 0 | 259 | 114 | 13 | 2.8 | 11 | 426 | 254 | 42 | 1.4 | 670 | |
| 34 42W 05BDC | 0 | 159 | 1,480 | 11 | 2.2 | 8.0 | 2,230 | 1,510 | 1,380 | .9 | 2,520 | |
| 35 40W 03BBB | 0 | 217 | 367 | 16 | .5 | 6.6 | 738 | 457 | 279 | 1.2 | 1,050 | |
| 35 43W 24AA | 0 | 349 | 99 | 14 | .6 | 5.8 | 471 | 274 | 0 | 1.6 | 740 | 7.4 |
| Seward County | |||||||||||
|---|---|---|---|---|---|---|---|---|---|---|---|
| Local well number |
Well depth (ft) |
Geologic source (1) |
Date of collection |
Temp. (°C) |
Dissolved silica (SiO2) |
Total iron (Fe) |
Dissolved manganese (Mn) |
Dissolved calcium (Ca) |
Dissolved magnesium (Mg) |
Sodium (Na) |
Potassium (K) |
| 31 32W 03DAD | 412 | QU,TO | 05/07/1974 | 23 | 0.20 | 0.00 | 66 | 15 | 33 | 3.8 | |
| 31 33W 06CBD | 347 | QU,TO | 05/08/1974 | 24 | .00 | .00 | 66 | 25 | 40 | 4.4 | |
| 31 34W 18BBB | 375 | QU,TO | 05/07/1974 | 23 | .02 | .00 | 59 | 31 | 58 | 5.6 | |
| 32 31W 26CAA | 341 | QU,TO | 05/07/1974 | 22 | .05 | .00 | 56 | 18 | 33 | 4.2 | |
| 32 31W 31ACC | 386 | QU,TO | 05/07/1974 | 24 | .11 | .00 | 69 | 26 | 52 | 4.6 | |
| 32 34W 10DA | 350 | QU,TO | 05/07/1974 | 23 | .08 | .00 | 51 | 26 | 33 | 4.4 | |
| 32 34W 17DCC | 335 | QU,TO | 05/07/1974 | 26 | .03 | .00 | 62 | 26 | 36 | 4.0 | |
| 33 32W 28CDD | 465 | PW | 10/10/1974 | 14 | 1.8 | .00 | 3,600 | 1,800 | 6,100 | 680 | |
| 33 32W 28CDD2 | 205 | QU | 10/10/1974 | 23 | 1.5 | .00 | 80 | 25 | 82 | 4.5 | |
| 34 31W 30BBB | 705 | PW | 10/18/1974 | 33 | 1.0 | .00 | 1,300 | 640 | 5,000 | 320 | |
| 34 31W 30BBB2 | 460 | TO | 10/22/1974 | 11 | .81 | .00 | 150 | 50 | 670 | 12 | |
| 34 31W 30BBB3 | 250 | QU | 07/22/1975 | 16.0 | 25 | .05 | .00 | 70 | 17 | 41 | 3.2 |
| 34 34W 16DAA | 458 | QU,TO | 05/07/1974 | 31 | .02 | .00 | 77 | 17 | 24 | 3.2 | |
| 34 34W 17DDD | 562 | JU | 10/16/1974 | 29 | 1.3 | .00 | 70 | 23 | 32 | 3.2 | |
| 35 33W 16BCA | 383 | QU,TO | 05/07/1974 | 33 | .03 | .00 | 53 | 24 | 27 | 3.2 | |
| Local well number |
Carbonate (CO3) |
Bicarbonate (HCO3) |
Dissolved sulfate (SO4) |
Dissolved chloride (Cl) |
Dissolved fluoride (F) |
Dissolved nitrate (NO3) |
Dissolved solids (residue at 180° C) |
Hardness | Sodium adsorption ratio |
Specific conductance (µmhos/cm at 25°C) |
pH | |
|---|---|---|---|---|---|---|---|---|---|---|---|---|
| (Ca,Mg) | Non- carbonate |
|||||||||||
| 31 32W 03DAD | 0 | 220 | 78 | 23 | 0.9 | 12 | 363 | 230 | 46 | 1.0 | 570 | 7.8 |
| 31 33W 06CBD | 0 | 220 | 108 | 37 | .9 | 21 | 432 | 270 | 92 | 1.1 | 690 | 7.6 |
| 31 34W 18BBB | 0 | 259 | 158 | 19 | 1.1 | 5.8 | 488 | 270 | 62 | 1.5 | 740 | 7.7 |
| 32 31W 26CAA | 0 | 210 | 87 | 15 | .8 | 7.3 | 345 | 210 | 44 | 1.0 | 540 | 7.7 |
| 32 31W 31ACC | 0 | 220 | 171 | 20 | .8 | 12 | 48 | 280 | 99 | 1.4 | 730 | 7.6 |
| 32 34W 10DA | 0 | 220 | 98 | 15 | 1.1 | 9.1 | 370 | 230 | 52 | 1.0 | 570 | 7.8 |
| 32 34W 17DCC | 0 | 220 | 116 | 23 | .8 | 8.0 | 411 | 260 | 80 | 1.0 | 630 | 7.6 |
| 33 32W 28CDD | 0 | 156 | 1,260 | 20,300 | .1 | .2 | 33,800 | 16,380 | 6,300 | 21 | 7.9 | |
| 33 32W 28CDD2 | 0 | 220 | 150 | 96 | .7 | 9.3 | 577 | 300 | 120 | 2.1 | 950 | 8.0 |
| 34 31W 30BBB | 0 | 140 | 1,100 | 11,000 | .4 | 1.0 | 19,500 | 5,800 | 5,700 | 28 | 7.7 | |
| 34 31W 30BBB2 | 0 | 95 | 200 | 1,300 | 1.1 | 2.9 | 2,420 | 580 | 510 | 12 | 4,500 | 8.1 |
| 34 31W 30BBB3 | o | 212 | 77 | 55 | .4 | 9.6 | 403 | 244 | 70 | 1.1 | 700 | 7.7 |
| 34 34W 16DAA | 0 | 190 | 120 | 17 | .4 | 12 | 396 | 260 | 107 | .6 | 580 | 7.6 |
| 34 34W 17DDD | 0 | 190 | 140 | 15 | .5 | 15 | 423 | 270 | 120 | .9 | 660 | 8.4 |
| 35 33W 16BCA | 0 | 220 | 67 | 22 | .7 | 10 | 350 | 230 | 46 | .8 | 530 | 7.7 |
| Stanton County | |||||||||||
|---|---|---|---|---|---|---|---|---|---|---|---|
| Local well number |
Well depth (ft) |
Geologic source (1) |
Date of collection |
Temp. (°C) |
Dissolved silica (SiO2) |
Total iron (Fe) |
Dissolved manganese (Mn) |
Dissolved calcium (Ca) |
Dissolved magnesium (Mg) |
Sodium (Na) |
Potassium (K) |
| 27 39W 13AC | 508 | KD | 04/22/1964 | 24 | 0.00 | 0.00 | 86 | 39 | 51 | 6.1 | |
| 27 40W 26BA | 343 | QU,TO | 04/22/1964 | 17 | .00 | .00 | 69 | 17 | 29 | 4.2 | |
| 27 42W 11DBD | 252 | QU | 07/08/1964 | 14 | .00 | .00 | 69 | 18 | 26 | 4.1 | |
| 27 42W 31CCC | 400 | TO,KJ | 04/27/1964 | 14 | .00 | .00 | 54 | 13 | 30 | 3.3 | |
| 28 39W 08BC | 290 | QU | 04/24/1960 | 18 | .11 | .00 | 70 | 19 | 28 | 4.0 | |
| 29 42W 24CC | 515 | KJ | 08/26/1960 | 16.5 | 27 | .24 | .00 | 55 | 23 | 54 | |
| 30 39W 23BB | 405 | QU,TO | 04/26/1964 | 16 | .00 | .00 | 44 | 19 | 29 | 3.1 | |
| Local well number |
Carbonate (CO3) |
Bicarbonate (HCO3) |
Dissolved sulfate (SO4) |
Dissolved chloride (Cl) |
Dissolved fluoride (F) |
Dissolved nitrate (NO3) |
Dissolved solids (residue at 180° C) |
Hardness | Sodium adsorption ratio |
Specific conductance (µmhos/cm at 25°C) |
pH | |
|---|---|---|---|---|---|---|---|---|---|---|---|---|
| (Ca,Mg) | Non- carbonate |
|||||||||||
| 27 39W 13AC | 0 | 256 | 237 | 21 | 1.2 | 4.9 | 596 | 375 | 165 | 1.2 | 870 | 7.5 |
| 27 40W 26BA | 0 | 185 | 132 | 15 | .8 | 6.6 | 382 | 242 | 90 | .8 | 570 | 7.7 |
| 27 42W 11DBD | 0 | 190 | 124 | 12 | .8 | 5.8 | 367 | 246 | 90 | .7 | 550 | 7.2 |
| 27 42W 31CCC | 0 | 178 | 84 | 11 | .7 | 6.2 | 304 | 188 | 42 | 1.0 | 470 | 7.8 |
| 28 39W 08BC | 0 | 190 | 130 | 16 | 1.0 | 9.7 | 389 | 252 | 96 | .8 | 590 | 7.6 |
| 29 42W 24CC | 0 | 240 | 118 | 15 | 1.6 | 7.1 | 419 | 232 | 35 | 1.5 | 690 | |
| 30 39W 23BB | 0 | 207 | 62 | 13 | 1.3 | 7.5 | 297 | 188 | 18 | .9 | 480 | 7.7 |
| Stevens County | |||||||||||
|---|---|---|---|---|---|---|---|---|---|---|---|
| Local well number |
Well depth (ft) |
Geologic source (1) |
Date of collection |
Temp. (°C) |
Dissolved silica (SiO2) |
Total iron (Fe) |
Dissolved manganese (Mn) |
Dissolved calcium (Ca) |
Dissolved magnesium (Mg) |
Sodium (Na) |
Potassium (K) |
| 31 35W 26DCC | 420 | QU,TO | 05/09/1974 | 23 | 0.08 | 0.00 | 54 | 29 | 37 | 4.8 | |
| 31 36W 27BCB | 450 | QU,TO | 05/09/1974 | 23 | .02 | .00 | 43 | 25 | 40 | 4.0 | |
| 31 38W 17CDA | 400 | QU,TO | 05/10/1974 | 28 | .00 | .00 | 70 | 49 | 54 | 5.2 | |
| 32 35W 08DDD | 495 | QU,TO | 05/09/1974 | 23 | .02 | .00 | 46 | 29 | 42 | 4.4 | |
| 32 37W 10DCC | 480 | QU,TO | 05/10/1974 | 34 | .08 | .00 | 50 | 19 | 22 | 3.8 | |
| 33 38W 20DDB | 405 | QU,TO | 05/09/1974 | 29 | .02 | .00 | 62 | 19 | 28 | 3.0 | |
| 34 35W 07BCC | 456 | QU,TO | 05/09/1974 | 30 | .02 | .00 | 77 | 14 | 19 | 3.2 | |
| 34 35W 18BCA | 470 | TO | 10/09/1974 | 8.7 | 1.8 | .00 | 40 | 13 | 26 | 3.0 | |
| 34 39W 14DDD | 540 | TO | 08/08/1974 | 25 | 2.2 | .00 | 74 | 25 | 28 | 4.3 | |
| 35 36W 01AAA | QU,TO | 05/08/1974 | 32 | .00 | .00 | 66 | 19 | 20 | 3.0 | ||
| 35 39W 10CAD | 530 | QU,TO | 05/09/1974 | 31 | .03 | .00 | 83 | 18 | 26 | 2.8 | |
| Local well number |
Carbonate (CO3) |
Bicarbonate (HCO3) |
Dissolved sulfate (SO4) |
Dissolved chloride (Cl) |
Dissolved fluoride (F) |
Dissolved nitrate (NO3) |
Dissolved solids (residue at 180° C) |
Hardness | Sodium adsorption ratio |
Specific conductance (µmhos/cm at 25°C) |
pH | |
|---|---|---|---|---|---|---|---|---|---|---|---|---|
| (Ca,Mg) | Non- carbonate |
|||||||||||
| 31 35W 26DCC | 0 | 220 | 107 | 27 | 1.1 | 10 | 401 | 250 | 74 | 1.0 | 640 | 7.7 |
| 31 36W 27BCB | 0 | 220 | 97 | 13 | 1.3 | 4.0 | 356 | 210 | 34 | 1.2 | 570 | 7.6 |
| 31 38W 17CDA | 0 | 220 | 242 | 32 | 1.6 | 12 | 600 | 380 | 200 | 1.2 | 880 | 7.7 |
| 32 35W 08DDD | 0 | 222 | 114 | 16 | .9 | 10 | 394 | 230 | 52 | 1.2 | 620 | 7.7 |
| 32 37W 10DCC | 0 | 220 | 46 | 17 | .5 | 5.1 | 307 | 200 | 21 | .7 | 480 | 7.7 |
| 33 38W 20DDB | 0 | 180 | 100 | 19 | .3 | 26 | 376 | 230 | 82 | .8 | 550 | 7.7 |
| 34 35W 07BCC | 0 | 193 | 79 | 32 | .3 | 10 | 360 | 250 | 92 | .5 | 560 | 7.6 |
| 34 35W 18BCA | 0 | 120 | 65 | 26 | .7 | 4.5 | 246 | 150 | 56 | .9 | 400 | 7.9 |
| 34 39W 14DDD | 0 | 190 | 170 | 12 | .4 | 8.6 | 437 | 288 | 130 | .7 | 660 | 7.5 |
| 35 36W 01AAA | 0 | 193 | 90 | 20 | .4 | 11 | 357 | 240 | 84 | .6 | 550 | 7.5 |
| 35 39W 10CAD | 0 | 180 | 155 | 17 | .4 | 9.8 | 431 | 280 | 135 | .7 | 630 | 7.6 |
Surface Water
Most of the streamflow into the area is diverted for irrigation use or percolates to the underlying aquifer. Surface-water outflow generally represents ground-water contributions to the stream from the unconsolidated aquifer.
Arkansas River
The quality of surface water entering the area during medium to low flow commonly is saline. Analyses of samples collected from the Arkansas River at Coolidge, Kans., show that the water contains dissolved solids ranging from 2,000 to 5,000 mg/L and is a mixed type containing sodium, calcium, magnesium, and sulfate. Monthly streamflow records indicate that the water in Hamilton County "...moves from the river to the alluvium during periods of high flow and moves from the alluvium to the river during periods of low flow..." (Lobmeyer and Sauer, 1974). Thus, the chemical quality of surface water and ground water in the river valley are similar in the reach where streamflow normally occurs in Hamilton and western Kearny Counties.
During years of normal to above-normal precipitation, ground water contributes flow to the Arkansas River downstream from the Finney-Gray County line. The quantity of inflow to the stream is greatest during the nongrowing season and decreases as irrigation use and evapotranspiration increase. The analysis of samples collected from the Arkansas River at Dodge City, Kans. (about 10 miles east of the Gray County line), indicates that the quality of surface water leaving the area is fresh (dissolved solids range from about 500 to 1,000 mg/L) and is a mixed type containing calcium, magnesium, sulfate, and bicarbonate.
Cimarron River
Miscellaneous discharge and chemical-quality measurements were made, during November 1974, on a reach of the Cimarron River from a site near the point where flow began (between sites 1 and 2) to about 4 miles upstream from the Oklahoma-Kansas State line (site 11). The locations of measurement sites are shown on plate 3, and the data are listed in table 4. Site 10, included in the list of measurements, is the U.S. Geological Survey gage on the Cimarron River near Forgan, Okla. (Station No. 07156900). The measurements were made after a killing frost to reduce the effects of evapotranspiration on ground-water inflow and during a period when there was no surface-water inflow to the river between sites.
Table 4--Miscellaneous discharge and chemical-quality measurements on Cimarron River, Meade and Seward Counties, Kansas.
| Location | Site number |
Date (1974) |
Discharge (ft3/s) |
Time (c.s.t.) |
Temp. (°C) |
Specific conductance (µmhos/cm at 25°C) |
Dissolved chloride (mg/L) |
|---|---|---|---|---|---|---|---|
| 32 33W 18AAA | 1 | Nov. 14 | 0 | 0900 | |||
| 32 33W 21CCA | 2 | Nov. 14 | .01 | 0925 | 3.0 | 900 | 23 |
| 32 33W 36BDA | 3 | Nov. 14 | .35 | 1025 | 6.0 | 735 | 19 |
| 33 32W 20ACD | 4 | Nov. 14 | 11.5 | 1025 | 8.5 | 730 | 21 |
| 33 32W 25ACC | 5 | Nov. 14 | 19.1 | 1145 | 10.0 | 760 | 40 |
| 34 31W 15CBA | 6 | Nov. 14 | 39.6 | 1230 | 10.5 | 1010 | 98 |
| 34 30W 31BBC | 7 | Nov. 14 | 41.9 | 1535 | 11.0 | 1200 | 186 |
| 35 30W 09CCB | 8 | Nov. 14 | 56.3 | 1100 | 6.0 | 1340 | 215 |
| 35 30W 13BBB | 9 | Nov. 14 | 55.7 | 1330 | 9.0 | 2400 | 580 |
| 35 29W 08DDC | 10 | Nov. 14 | 57.7 | 1410 | 11.0 | 2600 | 620 |
| 35 29W 10BCD | 11 | Nov. 14 | 56.5 | 1610 | 10.0 | 2650 | 650 |
The relation of stream discharge to distance in river miles is shown graphically (fig. 6A). The discharge increases progressively from site 3 (sec. 36, T. 32 S., R. 33 W.) to site 8 (sec. 9, T. 35 S., R. 30 W.) and becomes relatively steady from site 8 to site 11 (sec. 10, T. 35 S., R. 29 W.). Thus, most of the ground-water inflow from the aquifer to the river occurs upstream from site 8.
Figure 6--Relation of distance in miles along Cimarron River to (A) discharge and (8) dissolved chloride on November 14, 1974.
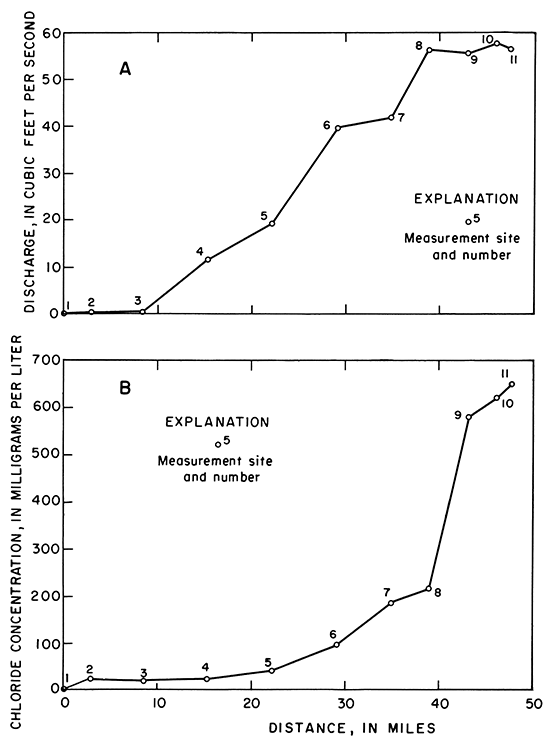
A water sample was collected at each measurement site for analysis and for an indication of changes in the chemical quality of ground-water inflow to the river. The quality of water being discharged from the study area by the river is saline (about 1,400 mg/L) and is a sodium chloride type.
The concentration of chloride also is related to distance in river miles (fig. 6B). Chloride concentrations increased gradually from site 3 to site 8 and increased rapidly between sites 8 and 9. Thus, most of the ground-water inflow was contributed upstream from site 8, but the greatest increase in chlorides occurred between sites8 and 9. Much of the chloride increase probably is attributable to a spring that yields salty water to the river in the NE sec. 16, T. 35 S., R. 30 W. The chloride concentration of the spring water is not known, but water samples from nearby wells in the Whitehorse Formation show concentrations ranging from 10,000 to 20,000 mg/L.
Unconsolidated Aquifers
Water quality in the unconsolidated deposits differs chiefly as a result of the source, quantity, and quality of recharge and by association with water in other geologic formations in the subsurface. In general, the chemical quality of water in the unconsolidated aquifer, listed in table 3 and shown by plate 3, improves from west to east.
Quaternary Alluvium
The quality of water in the alluvium of the Arkansas River valley is the cumulative result of saline-water recharge and the concentration of dissolved solids by evapotranspiration. Most soils in the valley are saline because they have been affected by flooding, a shallow water table, and by surface- and ground-water irrigation. Thus, chemical constituents in water percolating to the aquifer are the result of selective precipitation of salts. The concentration of salts in the aquifer also are increased by evaporation from the shallow water table and transpiration by abundant vegetation, such as cottonwood and salt cedar.
Ground water in the alluvium from Coolidge to Garden City contains high concentrations of calcium, magnesium, sodium, and sulfate (pl. 3), and dissolved solids decrease downgradient from about 3,700 to 2,900 mg/L. In Gray County, water in the alluvium contains increased concentrations of calcium and bicarbonate and decreased concentrations of magnesium, sodium, and sulfate. According to McGovern and Long (1974), dissolved solids in the alluvial aquifer "...decrease from 1,600 mg/L at the western county line to about 500 mg/L at the eastern county line."
Ogallala Formation and Undifferentiated Pleistocene Deposits
The quality of water in the unconsolidated deposits commonly is fresh (dissolved solids range from 200 to 600 mg/L) and may be either a calcium bicarbonate type or a mixed type containing calcium, magnesium, sodium, bicarbonate, and sulfate. The chemical quality of water differs from area to area and may differ significantly with depth. These differences probably result from the source and quality of recharge, the depth, thickness, and character of sediments in the aquifer, and the association with water or soluble minerals in the bedrock formations.
In the eastern part of the unconsolidated aquifer (pl. 3), water is a calcium bicarbonate type. In the western and southern parts, magnesium, sodium, and sulfate also are principal constituents. Because precipitation is the major source of recharge within the study area, the chemical constituents in ground water probably were derived from dissolution of minerals within the aquifer and from adjacent bedrock formations. The abundance of calcium carbonate in the unconsolidated deposits provides an ample source for these constituents throughout the area. Jurassic and Cretaceous rocks that underlie the western part of the aquifer, as well as some of the unconsolidated deposits derived from these formations, provide increased percentages of sodium, magnesium, and sulfate.
In parts of northern Kearny and Finney Counties, the chemical quality of water in the aquifer has been affected by the addition of dissolved minerals derived from Upper Cretaceous rocks. The water is fresh (200 to 500 mg/L) and commonly contains sodium, magnesium, and sulfate in combination with calcium bicarbonate. Water in the aquifer north of the Arkansas River valley (pl. 3) also shows the result of extensive surface-water irrigation. Because di vers ions from the river have been used for many years, this source of saline water has become a significant part of the recharge. Thus, water in the aquifer, especially at shallow depths, may contain dissolved solids as high as 1,000 to 2,000 mg/L.
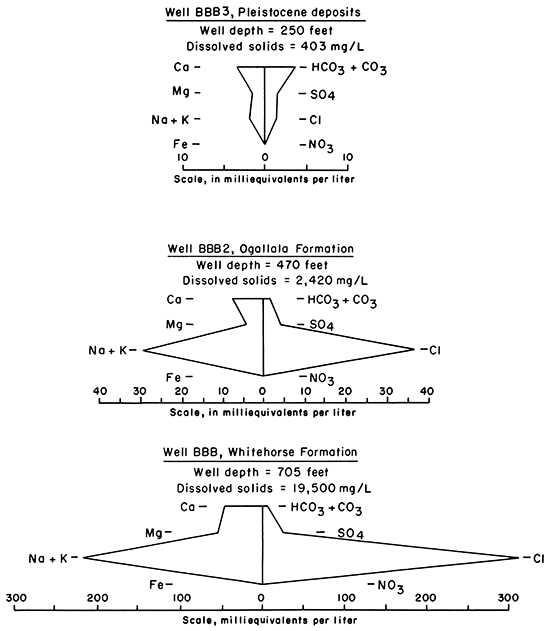
In some parts of southern Meade and Seward Counties, saline water occurs near the base of the unconsolidated aquifer. Water samples from three wells, located in the same 10-acre tract of sec. 30, T. 34 S., R. 30 W., indicate that the chemical quality in the aquifer has been affected by highly mineralized water from the underlying Whitehorse Formation. As shown by the diagrams in figure 7, the chemical characteristics of the saline water in the lower part of the aquifer are different from those of the freshwater in the upper part but are similar to those of the brackish water in the bedrock formation.
Figure 7--Chemical characteristics in water from three wells in sec. 30, T. 34 S., R. 30 W. in Seward County.
Bedrock Aquifers
Whitehorse Formation
Near the Cimarron River in southwestern Meade County and southeastern Seward County, wells in the Whitehorse Formation yield brackish water with concentrations of dissolved solids as high as 33,900 mg/L. Analyses of samples (table 3) show the water to be a mixed sodium calcium magnesium chloride in central Seward County and a sodium chloride in southwestern Meade County. Water from wells in these areas is not usable for most purposes. Electric logs indicate that the water in the Whitehorse may not be as highly mineralized in northwestern Meade County.
Day Creek Dolomite
The oldest formation in southwestern Kansas that yields usable supplies of water is the Day Creek Dolomite. Water from permeable zones in the formation (gypsum aquifer) is saline, with dissolved solids of about 2,700 mg/L, and is a calcium sulfate. Water from the formation has been used for irrigation in Morton County, although continued use tends to accumulate gypsum in the soil and to rapidly corrode aluminum distribution pipe.
Undifferentiated Upper Jurassic and Lower Cretaceous Rocks
Wells in southern Hamilton County and in Stanton and Morton Counties commonly are screened in all available water-producing sandstones in the undifferentiated Upper Jurassic and Lower Cretaceous rocks and in the unconsolidated deposits. Therefore, the quality of water from those wells is similar to that from wells screened only in the unconsolidated aquifer in the same general area. Where well yields are obtained only from the sandstones, the water has a slightly higher concentration of sodium and sulfate than water from nearby wells in the unconsolidated aquifer.
In northeastern Finney County, the upper part of the sandstone aquifer (Dakota Formation) yields water that is fresh, with dissolved solids ranging from 400 to 600 mg/L, and that is a mixed sodium bicarbonate sulfate. Geophysical logs from oil tests in this area indicate that water in the lower part of the sandstone aquifer (Cheyenne Sandstone) is highly mineralized.
Niobrara Chalk
An analysis of water from the Niobrara Chalk by Latta (1944) shows that the chalk aquifer yields a mixed calcium magnesium bicarbonate water similar to that in the overlying unconsolidated aquifer. The composition of water and concentration of dissolved solids generally may be correlated with surficial conditions rather than with the mineralogical composition of the aquifer. In Finney County, Hill and others (1967) showed the constituents in water from the Fort Hays Limestone Member to be almost entirely calcium carbonate.
Suitability of Water for Irrigation
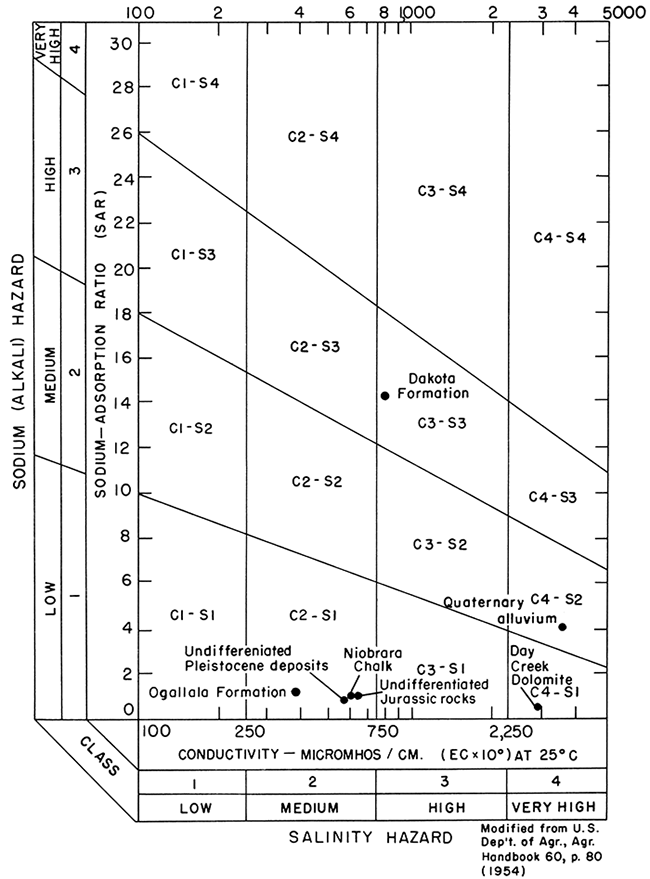
When irrigation water is applied to the land, it is necessary to consider the effects on the salinity and alkalinity of the soils. The most important chemical characteristics in evaluating the suitability of water for irrigation are the total concentration of soluble salts, expressed in terms of electrical conductivity (EC), and the relative proportion of sodium to other principal cations, expressed as the sodium-adsorption-ratio (SAR). The suitability of water from various geologic formations is shown in a diagram (fig. 8) and described according to the classification of the U.S. Salinity Laboratory Staff (1954).
Water from the Ogallala Formation and the undifferentiated Pleistocene deposits generally has a low-sodium and medium-salinity hazard. Water from undifferentiated Jurassic rocks, Lower Cretaceous rocks, and the Niobrara Chalk, which probably is derived indirectly from the unconsolidated aquifer, has similar characteristics. This type of water may be used on most soils and with crops that tolerate moderate amounts of salt.
Water from the Quaternary alluvium and from the Day Creek Dolomite have medium- and low-sodium hazards, respectively, and a very high salinity hazard. These types of water may be used on salt-tolerant crops grown in permeable, coarse-textured soils, but only by utilizing additives and special farming practices.
In the northern part of the area, water from the Dakota Formation has a high-sodium and high-salinity hazard. This water may produce harmful levels of exchangeable sodium in most soils and will require good drainage, leaching, and special additives.
Figure 8--Classification of irrigation water.
Prev Page--Hydrology || Next Page--Hydrologic Cycle
Kansas Geological Survey, Geohydrology
Placed on web July 28, 2013; originally published 1981.
Comments to webadmin@kgs.ku.edu
The URL for this page is http://www.kgs.ku.edu/Publications/Bulletins/IRR7/05_qual.html