![]()
Prev Page--Fluctuations of Water Table || Next Page--Ground-water Discharge
Ground-water Recharge
Recharge is the term used to denote the addition of water to the ground-water reservoir, and may be accomplished in several ways. The ultimate source of all ground water of quality suitable for ordinary uses in this area is precipitation in the area or in nearby areas. Once the water becomes a part of the ground-water body it moves in the direction of the slope of the water table, later to be discharged at some point downgradient.
The underground reservoir beneath this area is recharged principally from precipitation on the area, but some water is added by seepage from streams and by subsurface flow from nearby areas. In some of the oil fields of the area highly saline oil-field brines have been allowed to seep into the freshwater-bearing formations; this constitutes another source of water added to the aquifers, although the quantity of water involved probably is very small compared to that received from rainfall and other sources, and the highly saline character of the water renders it very undesirable as a source of recharge.
Recharge From Precipitation
According to data compiled by the United States Weather Bureau (Table 1) the normal annual precipitation in this area ranges from 28.29 inches at Mt. Hope to 31.25 inches at Newton. The amount of precipitation has ranged from 15.57 inches in 1921 at McPherson to 48.69 inches in 1922 at Newton, but the normal annual precipitation for the entire area here under consideration is about 29 inches.
Of the total precipitation, a part runs off the land surface to streams, a part is dissipated by evaporation, a part is transpired by plants from the zone of soil moisture, and a part percolates downward to the zone of saturation. Although this report is concerned mainly with that part of the precipitation that reaches the water table, a brief summary of the disposition of those parts that do not necessarily contribute to ground-water recharge seems to be in order.
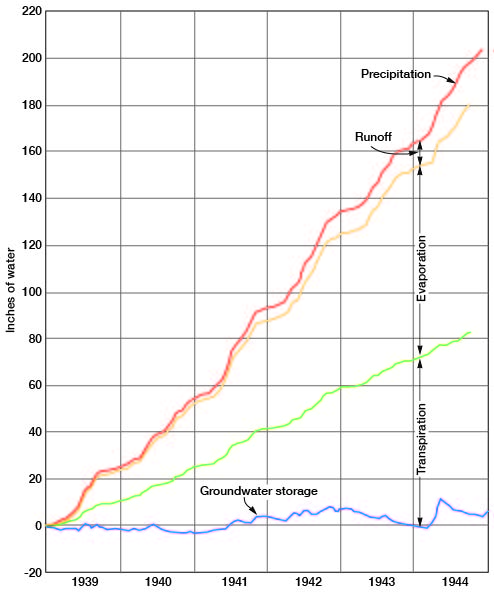
A study was made during the course of this investigation of the ultimate division of rainfall in the area roughly bounded by Burrton, Halstead, Valley Center, and Patterson. Figure 14 shows the magnitude of the natural disbursement of precipitation. It should be noted that ground water ultimately contributes to some of the divisions shown on the chart. Curve A shows the total cumulative precipitation at Sedgwick from January 1, 1939, to December 31, 1944. The discharge of the Little Arkansas River has been measured at the gaging station at Valley Center, Kansas, and curve B was plotted by subtracting the runoff in inches from curve A. Runoff in inches, as reported by the United States Geological Survey and Kansas State Board of Agriculture, is computed as the average runoff for the entire drainage basin. This figure probably is not the exact value for runoff from the smaller area studied but probably is of the right order of magnitude. The vertical distance between curves A and B represents approximately the cumulative total runoff, that is, both surface runoff and ground-water runoff. The distance between curves B and C is an approximation of the cumulative losses to rainfall caused by evaporation from the land surface in this area. The value for evaporation was computed by using United States Weather Bureau records of mean monthly temperature at Newton and monthly precipitation at Sedgwick, Kansas, and by applying these data to Meyer's evaporation curve (Meyer, 1928, p. 455-457). Curve D represents the cumulative change in storage in 10 observation wells not affected by pumping in this area, in inches of water. The distance above the zero line and below curve D represents cumulative additions to storage from precipitation; that is, the excess of ground-water recharge from precipitation over ground-water discharge included in the other graphs. The distance between curves C and D represents that part of the precipitation not otherwise accounted for and is believed to represent approximately the losses through transpiration.
Figure 14--Mass curves showing precipitation, runoff, evaporation, transpiration, and change in ground-water storage from Jan. 1, 1939, to Dec. 31, 1944, in the Wichita well-field area.
The amount of the annual precipitation that percolates downward to the water table and recharges the ground-water reservoir is dependent on several factors, including the amount and distribution of annual rainfall, the physical character and the composition of the soil and subsoil, the proximity of the water table to the land surface, the condition of the soil before rainfall (moisture content, cultivation, etc.), and the number and depth of roots, animal burrows, and openings or cracks in the soil such as may be observed following drought. Some measure of the amount of recharge from precipitation may be gained from study of the fluctuations of water levels in wells if the specific yield of the water-bearing material is known.
Recharge in areas underlain by shale of Permian age.--Several different types of soils have been formed in this area, owing to the differences in the parent materials from which they are derived. The soils in areas underlain by Permian and Cretaceous shales are of such composition that water percolates slowly through them and only a small part of the annual rainfall reaches the water table. The fluctuations of water levels in wells 160, 161, and 202, which penetrate Permian shale, are shown on Figure 15. Well 160 has shown a steady rise of about 10 feet in response to normal and above-normal precipitation from 1938 through 1944. This area had experienced a prolonged drought in the years preceding the period of record, and water levels were at an abnormally low stage. The rise in water levels in wells 160 and 202 has been somewhat greater than the rise would have been had the preceding years been more nearly normal. Fluctuations of water level in well 202 have been of greater amplitude than those observed in well 160, but the rise in water level for the period of record has been nearly the same as in well 160. As shown in Figure 12 well 202 reflects very efficiently changes in atmospheric pressure. The water level in well 161 has not risen as much as in other wells, for it is a much shallower well and derives water in part from shale and in part from a thin layer of sand and silt above the shale. The shale is saturated only in the upper few feet at this well and the water table fluctuates through a range comparatively close to the land surface. The specific yield of the shale and material derived from shale at wells 160, 161, and 202 was not determined, but is known to be very low in comparison with coarser materials; hence, the 10-foot rise in water level in well 160 shown on the hydrograph does not represent nearly the amount of recharge that would be indicated by a similar rise of water level in a well penetrating sand and gravel.
Figure 15--Hydrographs showing fluctuations of water levels in five wells in McPherson county and monthly precipitation at McPherson.
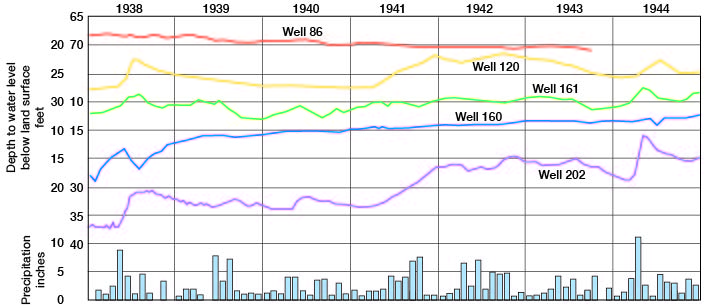
Recharge near McPherson.--An irregular area, extending several miles north, south, and west from McPherson, in which the depth to water ranges from 40 to 80 feet below land surface, is shown on Plate 5. This area is underlain by a deposit of silt, which ranges in thickness from several feet to about 75 feet. Although this material is, in general, more permeable than shale, it is much less permeable than sand and gravel, and water moves slowly through it; hence, recharge from precipitation takes place very slowly and is reflected in wells by a gradual rise in water level. Test drilling in this area revealed some very porous unsaturated zones where the silt contains many large nodules of calcium carbonate. This unusual porosity probably has occurred through the action of secondary processes. Where porous zones occur at or near the surface, however, much more water may reach the zone of saturation than is possible elsewhere.
During the growing season much of the water that enters the silt after rains is evaporated and transpired by plants before reaching a depth beyond which it cannot be affected by these processes. If the silt were more permeable, water would move more rapidly through the zone of aeration and more water would reach the zone of saturation. The water levels observed in well 86 are shown graphically in Figure 15. This well penetrates a considerable thickness of silt and ends in sand and gravel. The hydrograph of well 86 shows that water was added to the underground reservoir at about the same rate at which it was discharged, although the decline of 2.5 feet shown on the hydrograph indicates that discharge exceeded recharge during the 6-year period of record. This well is situated within the area of pumping influence of the McPherson city water wells and the lowering observed probably was caused by pumping. The fact of principal interest indicated by this hydrograph is that the water level does not fluctuate greatly nor quickly in response to increased or decreased precipitation, differing in this respect from the fluctuation of water level in wells in areas underlain by materials having greater permeability. The depth to water level at well 86 is also a factor in producing the nearly smooth hydrograph, owing to the lag in the rise of water level in response to precipitation.
Recharge in sand-dune areas.--Sand dunes cover most of the area between the Little Arkansas River and United States Highway 505 in the west-central part of the mapped area, and subdued sand dunes occur in smaller areas near Halstead and south and southeast of Burrton (Pl. 1) constituting areas important for ground-water recharge.
Water added to the ground-water reservoir in the sand-hills area is derived largely from precipitation. Because of the relatively high porosity and permeability of the dune sand and the presence of many undrained basins that serve as catchment areas for rainfall, a large percentage of the rain water percolates downward to the zone of saturation. Contours representing the shape of the ground-water surface (Pl. 1) indicate that the underground reservoir beneath the sand-hills area receives more recharge than neighboring areas. A part of the ground water derived from rainfall on this area moves downgradient southward toward the area underlain by terrace deposits and a part moves northward and eastward toward the Little Arkansas River where it is discharged and contributes to the flow of that stream. Similarly in the sand-dune area east of the Little Arkansas River a large percentage of the precipitation reaches the water table and is a source of water for the Newton city wells. This water also contributes to the flow of the stream.
Recharge in areas underlain by sandstone.--Partly cemented sandstones in the Kiowa shale crop out (Pl. 1) in some places in the northeastern and northwestern parts of the area studied. In these places a very sandy soil is developed on the parent rock and a large percentage of the precipitation enters the sandstone. The shale of the Kiowa beneath the sandstone is relatively impermeable and definitely limits the amount of recharge that the ground-water reservoir can accommodate. When the water level is raised after rains, ground water moves laterally and emerges as springs at points where erosion has dissected the terrain and the land surface intersects the sandstone beds (Pl. 13B).
Recharge in the Arkansas River valley.--There is little difference, hydrologically, between the alluvium of Arkansas and Little Arkansas rivers and the McPherson formation which are shown separately on Plate 1. The soil developed on the alluvium and the McPherson ranges from sandy loam to loam over most of the area, but is very sandy in places near the Arkansas River and in other places where remnants of old sand dunes exist and in some localities very porous sand and gravel occur near the land surface (Pl. 16A). In general, the character of the soil, topography, depth to water level, and other factors are favorable for recharge from precipitation.
The fluctuations of water level have been observed from 1938 through 1944 in many wells that penetrate the deposits of permeable sand and gravel occurring in the alluvium and McPherson formation.
The hydrographs of well 557 which is equipped with an automatic water-stage recorder and the average water level in 10 wells (nos. 358, 445, 502, 511, 544, 549, 557, 558, 560, and 563) are shown on Figure 16. The similarity between the hydrographs and the graph of the cumulative departure from normal precipitation at Sedgwick is noteworthy.
Figure 16--Hydrographs showing the fluctuations of water level in well 557 near Valley Center, the average water level in 10 wells in the Wichita well-field area not affected by pumping, the cumulative departure from normal monthly precipitation at Sedgwick, and the monthly precipitation at Sedgwick.
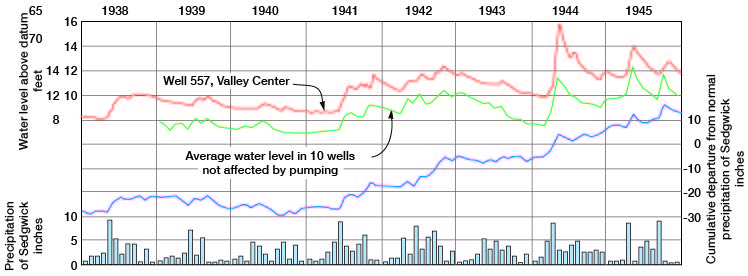
There was no accumulated deficiency of rainfall for the middle division of Kansas, which includes this area, on December 31, 1926, calculated for all stations in the division since January 1, 1887 (Jones, 1936, Fig. 21). Shown in Figure 16 is the graph of the cumulative departure from normal precipitation at Sedgwick since December 31, 1937, calculated from December 31, 1926. The 10 wells numbered above are measured monthly and were referred to an arbitrary datum and given a stage of 10 feet above this datum on December 1, 1938. The 10 wells were chosen primarily for their length of record, freedom from observable effects from pumping, and geographic location with reference to the new Wichita well field. These wells are believed to represent nearly average non-pumping hydrologic conditions in the well-field area.
A tendency toward a rather close correlation between the hydrographs and the curve showing cumulative departure from normal precipitation is observable in Figure 16. There are some lags observable in the hydrographs as compared to the rainfall curve and the magnitude of the rises and declines seemingly is not constant in the two curves; however, the trends are comparable. The curves are nearly the same through the years 1938 to 1942 inclusive. Near the end of 1942 water levels had reached the highest stages recorded in response to above-normal precipitation in 1941 and 1942. During 1943 precipitation was approximately normal, but was not great enough to maintain water levels at the high stages attained previously and the graphs show that ground-water discharge exceeded ground-water recharge. In 1944 precipitation at Sedgwick was 144 percent of normal. In April 1944 a flood inundated the entire floodplain upon which well 557 is located. The water levels again rose, reaching record high stages in May; indeed, water levels in some wells were near the maximum possible stage. During the last part of 1944 discharge again exceeded recharge, and, although precipitation was greater than normal during this period, it was not great enough to maintain the exceptionally high stages attained in May.
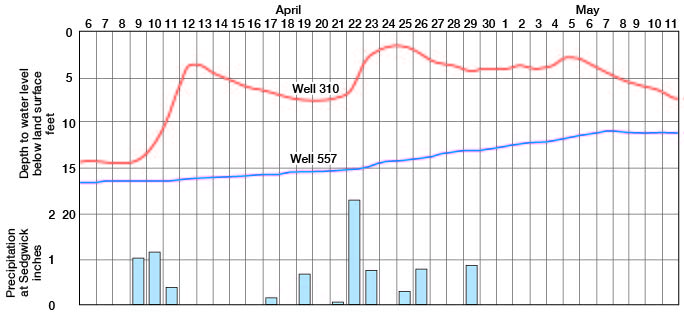
The hydrographs of wells 310 and 557 shown on Figure 17 illustrate the differences in fluctuation of water levels that may be exhibited by different wells in the same general area during the same period. Well 310 (Pl. 5) is situated near the edge of the floodplain of the Little Arkansas River. Well 557 is similarly located on the floodplain of the Little Arkansas River. Peaks of the spring floods of 1944 occurred on April 12 and 23 and on May 4. The hydrograph of well 557 shows the rise in water level following excessive precipitation in April 1944. The rise in water level in response to precipitation was nearly steady in well 557 in contrast to the several fluctuations of the water level shown by the hydrograph for well 310. It is believed that the character of the material at and near the surface at well 557 inhibits rapid infiltration and thus retards the rate of recharge and prolongs the effect of recharge. The net change in water level from April 6 to May 6 was about 10 feet in well 310 and about 5 feet in well 557. From May 6 to 11 the water level declined in well 310, whereas it remained nearly constant in well 557.
Figure 17--Hydrographs showing the fluctuations of water level in wells 310 and 557 during parts of April and May 1944, and daily precipitation at Sedgwick during the same period.
The alluvium and McPherson formation underlying the Arkansas River valley were deposited by streams and the materials penetrated by wells are stratified, silt and clay being interbedded with or occurring as lenses in much more permeable sand and gravel. In order to observe differences in water-level fluctuations, if any, due to stratification, two or more wells were constructed at the same location within a few inches of each other but were cased to different depths. Water levels in wells thus grouped have been gaged periodically at several places in the Arkansas River valley since 1939.
Depth of casing at each location was determined by the position of beds or lenses of silt and clay with respect to coarser material observed in drilling.
The hydrographs of two groups of wells drilled to different depths at each location are shown on Figure 18. Wells 354, 355, and 356 are 1 mile north of Burrton (Pl. 5); well 355 is equipped with an automatic water-stage recorder. The log of the test hole drilled at this location is given at the end of this report and indicates the kinds of material penetrated. The hydrograph of well 354 shows fluctuations of water level of considerable magnitude during periods of increased precipitation, and in April and May 1944 the water level in this well was above land surface. The log indicates that the upper 5 feet of the material penetrated at this place consists of clay and silt. This layer produces an artesian condition in the underlying bed of sand and gravel when the water table is at high stages. Water was not standing at the surface of the ground during this period because the small amount of water seeping upward through the relatively impermeable clay was not in excess of the demands of evaporation and transpiration. The hydrographs of well 355 and 356 show the fluctuation of water levels following precipitation. The magnitude of the fluctuations in each of these two wells is nearly the same, although considerably less than in well 354. The depth to water level below land surface is different in all three wells. At the beginning of the records, the water level was about 5 feet below land surface in well 354, about 15 feet in well 355, and about 25 feet in well 356. These differences show that the clay and silt layers intervening between the three well screens are sufficiently impermeable to produce and maintain different hydrostatic heads in each layer of gravel penetrated. The proximity of the sand dunes to this location, an area receiving much recharge, probably accounts for the upper zone of saturation and for the fluctuations in well 354 following rainfall. The smoother hydrographs for wells 355 and 356 indicate that recharge occurs more slowly, probably from a greater distance. The fact that the hydrographs of these two wells show fluctuations of similar magnitude during the same periods indicates that the area of recharge probably is nearly the same for the two permeable intervals and that the intervening impermeable layer is continuous laterally for a distance sufficient to produce differences in water level, but that the permeable zones become coextensive near the area of recharge.
Figure 18--Hydrographs showing the fluctuations of the water levels in (A) three wells cased to different depths at the same location and (B) in two wells cased to different depths at another location. (C) Monthly precipitation at the USGS rain gage at Burrton.
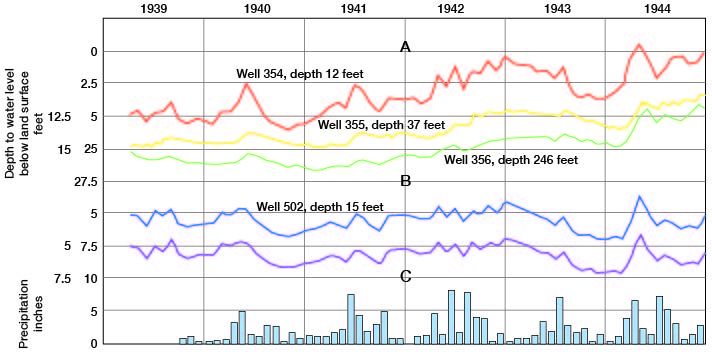
The hydrographs of wells 502 and 503 are shown on Figure 18B. These wells are situated about 4 miles southeast of Burrton (Pl. 5) and are cased to different depths, conditions of location and construction being similar to those described above. The beds of sand and gravel with which these wells communicate are separated by about 9 feet of silt, sandy silt, and clay. In contrast to the observations made above concerning hydrologic conditions at wells 354, 355, and 356, water levels in wells 502 and 503 are the same depth below land surface and fluctuate as one in response to rainfall and drought. The layers of low permeability which occur between beds of sand and gravel at this location seemingly are not extensive laterally and do not cause any of the differences noted in the first group of wells. The graphs presented above showing fluctuations in water level and departures from normal precipitation show that, in general, a relationship exists between the two phenomena. Further analysis of some of the data presented on Figure 19 is shown on Figure 20. The average monthly water-level stages in 10 wells in the new Wichita well-field area, described above, were averaged for each of the 12 months and the monthly departure from the 6-year monthly average thus obtained is shown in Figure 19A. Precipitation data, compiled by the United States Weather Bureau for the station at Sedgwick, were used in preparation of graph B. An average of the monthly precipitation during the same 6-year period as shown in Figure 19A was calculated, and the progressive monthly average of the cumulative departure from this 6-year average is shown on Figure 19B. This method of analysis eliminates effects of seasonal and other periodic variations in precipitation and illustrates the progressive and continuing correlation between variations in amount of precipitation and fluctuations in ground-water level.
Figure 19--Graphs showing (A) cumulative departure from 6-year average monthly water-level stage in 10 wells not affected by pumping; and (B) progressive monthly average of the cumulative departure from 6-year average monthly precipitation at Sedgwick.
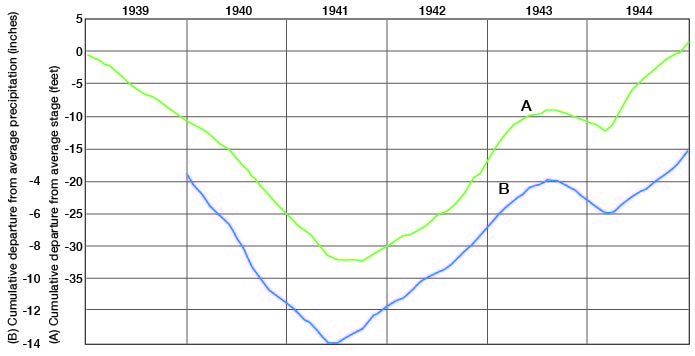
Figure 20--Graph showing the relationship between annual cumulative rise in water level 557 and annual precipitation at Sedgwick.
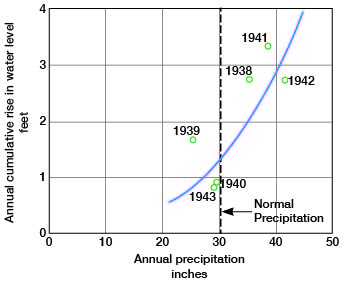
Quantitative estimate of recharge.--In an attempt to evaluate quantitatively the effect of precipitation on ground-water level shown above, the continuous water-level record for well 557 (Fig. 16) was analyzed and the annual cumulative rise in water level was determined. Well 557 was chosen for this purpose because the fluctuations in water level in it are similar to the average of the fluctuations in the 10 wells shown on Figure 16, and because it is equipped with an automatic water-stage recorder. The graph of annual cumulative rise in water level in this well plotted against annual precipitation is shown on Figure 20. Annual cumulative rise in water level is the sum of the rises in water level during each year. When ground-water levels rise following precipitation, recharge during that period exceeds discharge, but the rise is not a measure of the total amount of recharge because discharge proceeds concurrently with recharge.
The specific yield of the water-bearing material in the vicinity of the new Wichita well field is believed to be about 25 percent. If this value is nearly correct, a rise of water level of 1 foot in a well represents a net addition of 3 inches of water to the underground reservoir. Analysis of net recharge as computed from the record of water-level fluctuations in well 557 in relation to precipitation is given in Table 12. Calculation of the values given in column 6 indicates that the quantity of precipitation which is measurable as net recharge has averaged about 20 percent during the period of record. The similarity between the hydrographs for well 557 and for the average of the water levels in 10 wells shown on Figure 16 indicates that the values presented in Table 12 are applicable to the part of the Wichita well-field area not affected by pumping.
Table 12-- Relation of cumulative rise in water level in well 557 to annual precipitation at Sedgwick
| Year | Annual Precipitation (inches) (1) |
Annual cumulative rise in water level |
Cumulative annual precipitation (inches) (4) |
Accumulated cumulative rise in water level | ||
|---|---|---|---|---|---|---|
| Inches of water (2) |
Percentage of annual precipitation (3) |
Inches of water (5) |
Percentage of cumulative precipitation (6) |
|||
| 1938 | 35.42 | 8.25 | 23.3 | 35.42 | 8.25 | 23.3 |
| 1939 | 25.16 | 5.1 | 20.3 | 60.58 | 13.35 | 22.0 |
| 1940 | 29.55 | 2.82 | 9.6 | 90.13 | 16.17 | 18.0 |
| 1941 | 38.71 | 10.05 | 26.0 | 128.84 | 26.22 | 20.4 |
| 1942 | 41.45 | 8.25 | 19.9 | 170.29 | 34.47 | 20.2 |
| 1943 | 29.05 | 2.58 | 8.9 | 199.33 | 37.05 | 18.6 |
It is estimated, on the basis of the data in Table 12, that the average annual net recharge in the Arkansas River valley in this area during the period of record was equivalent to about 20 percent of the precipitation, although this percentage may have differed considerably locally. As the average precipitation at Sedgwick was nearly 35 inches during the period, or about 5 inches more than normal, the amount of water represented by the average annual cumulative rise in water level was nearly 7 inches, or about 365 acre-feet per year per square mile, or about 31,000 acre-feet per year in the 85 square-mile well-field area. This is a minimum figure because it does not take into account the ground-water discharge that was taking place at the same time that the rises in the water level were occurring.
Assuming that the figure of 20 percent of the precipitation holds during years of normal precipitation, the recharge in such years would be equivalent to about 6 inches of water, or 320 acre-feet per year per square mile, or about 27,000 acre-feet per year in the well-field area. It is not certain that the proportion of the precipitation that reaches the water table is as great during years of average precipitation as that during the period of record; in fact, the proportion is likely to be less - perhaps substantially less. However, because the actual recharge during the period of record, including that represented by discharge which took place while the rises in water level were occurring, probably was substantially greater than 20 percent of the precipitation during that period, it is believed that 20 percent of the normal precipitation is a reasonably conservative value.
C. V. Theis and C. E. Jacob, of the United States Geological Survey, have discussed with the authors some of the sources of error inherent in the methods of analysis outlined above. Theis (Personal communication, dated November 16, 1944) has noted that caution is advisable in ascribing rise and fall of the water table as measured in wells to ground-water recharge and discharge until the mechanics of the capillary fringe have been studied further. However, it is believed that inaccuracies of interpretation of water-level fluctuations caused by imperfect knowledge of capillary phenomena probably are minor when records of sufficient length and continuity are considered. Many of the graphs presented, especially those in Figure 19, seem to substantiate this belief.
Recharge From Streams
The Little Arkansas, Smoky Hill, and Ninnescah rivers, and most of the creeks and small tributaries in this area are gaining streams at normal stages, receiving water from the underground reservoir. The Arkansas River is nearly in equilibrium with the ground-water body at normal stages, neither receiving water from nor contributing to it. The gradient of the Arkansas River is nearly the same and is in the same direction as the slope of the water table (Pl. 1).
During periods of high water when the streams run bank-full or occupy the floodplains, some of the water flowing at the surface seeps downward to the ground-water reservoir. When flood flow diminishes and streams resume their normal stages, the ground water temporarily stored in the alluvium is discharged slowly until ground-water levels again approach the normal stage. The quantity of water thus added temporarily to the ground-water reservoir each year is difficult to estimate, and such estimation has not been attempted in this study. Under natural conditions the temporary nature of recharge from flood water renders its estimation profitless, but in an area where a large quantity of water has been withdrawn from alluvium near a stream, and the withdrawal has resulted in greatly lowered ground-water level, knowledge of the amount of water salvageable from flood flow would be beneficial.
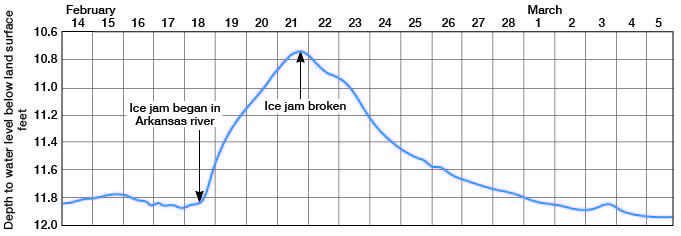
The Arkansas River, having nearly the same elevation as the water table in the adjacent alluvium, probably contributed water to the old Wichita well field, especially during periods when the rate of withdrawal was large. The hydrograph of well 674 (Fig. 21) shows that ground-water recharge from the Arkansas River is possible and has occurred in the vicinity of the old Wichita well field. An ice jam became effective as a dam in the channel of the Arkansas River about February 16, 1942. The effect of the resulting high stage in the river became noticeable at recorder well 674 on February 18 and continued until the ice jam was destroyed on February 21. By March 2 the water level in well 674 was at normal stage again. Prior to September 1, 1940, the water level in well 674 was 10 feet or more lower than in February 1942, owing to pumping of city wells nearby. At that time the gradient from the river to the wells probably was greater than the gradient at the time of the ice jam, and part of the surface flow of the river probably was diverted to the aquifer in the vicinity of the pumping wells.
Figure 21--Hydrograph of well 674 for parts of February and March 1942, showing the effect of an ice jam in the Arkansas River on the ground-water level nearby.
The aquifer in the new Wichita well field is not receiving water from the flow of the Little Arkansas River, although, as noted below, pumping may have decreased ground-water discharge at low river stages along part of the course of this stream. Withdrawal of water from the Newton city supply wells (wells 290-294 inclusive) may have resulted in recharge to the aquifer from the surface flow of Emma Creek during parts of each year, but no substantiating data are at hand. Part of the small seasonal flow of Kisiwa Creek, an intermittent stream throughout most of its course, probably contributes to the ground-water reservoir in the new Wichita well-field area.
Inflow From Adjacent Areas
Ground water moving from one area to another in the direction of the slope of the water table is sometimes referred to as inflow. The water-table contours shown on Plate 1 indicate that ground water derived from rainfall on some adjacent areas moves laterally into this area.
North of the Smoky Hill River ground water moves southward into McPherson County toward the river where it is discharged. Rain falling on southern Saline County seeps downward into Cretaceous sandstones and then moves laterally into the thin alluvial material above the Permian shale a short distance north of the Smoky Hill River, but much of this ground water is lost in transit before reaching the alluvium of the Smoky Hill River. Ground water derived from rainfall on a small area in northeastern Rice County moves eastward into McPherson County north of United States Highway 50N through Cretaceous rocks and weathered material above them. The quantity of this water is small and much is lost through transpiration and evaporation before reaching the channel deposits of the McPherson formation. Similarly, ground water moves westward into this area from parts of Marion and Harvey counties west of the Arkansas-Walnut drainage divide, but the quantity is small owing to the character of the material through which it moves.
Percolation of water through the terrace deposits and alluvium along the Arkansas River west and northwest of Hutchinson contributes to the supply of ground water in this area. Rain falling on the sand dunes that extend northwestward from Hutchinson into Rice County seeps downward to the water table and part of this water migrates southeastward into the Arkansas Valley. Similarly, part of the rain falling in the Arkansas Valley west of Hutchinson moves down the valley southeastward and becomes part of the ground water moving through deposits in this area.
The quantity of ground water derived from lateral flow into this area is not known, but it is small in comparison to the quantity derived from precipitation falling directly on the area.
Prev Page--Fluctuations of Water Table || Next Page--Ground-water Discharge
Kansas Geological Survey, South-central Kansas
Comments to webadmin@kgs.ku.edu
Web version April 2005. Original publication date July 1949.
URL=http://www.kgs.ku.edu/Publications/Bulletins/79/11_gwrecharge.html