![]()
Prev Page--Ground-water Recharge || Next Page--Recovery of Ground Water
Ground-water Discharge
When water derived from precipitation or other sources reaches the zone of saturation in the ways described above, it moves in the direction of the slope of the water table according to the conditions existing at the point of recharge; the water remains a part of the ground-water body until removed or discharged by some natural or artificial means. Water may be removed from the aquifer by evaporation, by transpiration, by seepage into streams, by discharge from springs, or by pumping from wells. These methods of discharge operate singly or in combination in all parts of this area. Over a period of years the quantity of ground-water discharge is approximately equal to the quantity of recharge.
Discharge by transpiration and evaporation.--Water may be taken into the roots of plants directly from the zone of saturation, or from the capillary fringe above it, and discharged from the plants by the process known as transpiration. The depth from which plants will lift ground water varies with different plant species and different types of soil. The limit, of lift by ordinary grasses and cultivated plants is not more than a few feet; however, alfalfa and certain types of desert plants have been known to extend their roots to depths of 60 feet or more to reach the water table (Meinzer, 1923, p. 82).
In this area the significant discharge of ground water by evaporation and transpiration occurs in the sub-areas in which tile depth to water is less than 20 feet. These sub-areas (shown on Pl. 5) comprise a large part of the total area mapped. Ground water is discharged by evaporation and transpiration in the Smoky Hill River valley; along Sharps Creek; in an area comprising about 100 square miles between Moundridge and Canton; in a narrow irregular area including many water-filled sink holes from Groveland south to the Little Arkansas River; in the sand-hills area; and in much of the Arkansas River valley, especially from Kisiwa Creek to the southwestern edge of the alluvium of the Arkansas River. A large quantity of ground water is evaporated and transpired along the course of Big Slough south of the Arkansas River.
No attempt has been made to estimate the quantity of ground water discharged by evaporation and transpiration, but it is believed that the quantity discharged through transpiration is larger than that discharged through any other means. Study of the several hydrographs showing fluctuations of water levels in wells presented above indicates that the quantity of ground-water discharge is approximately equal to the quantity of recharge over a complete climatic cycle, although records of most wells show that recharge has exceeded discharge for the period of record from 1938 through 1944. In general natural discharge occurs at a rate slower than recharge but it occurs over longer periods of time, especially in areas where the depth to water level is comparatively small.
Seepage into streams.--Streamflow at low stages in the Arkansas, Little Arkansas and Smoky Hill rivers, and the numerous small tributaries is maintained by ground-water discharge. Discharge into these streams occurs mainly through seeps along the stream channels and accounts for the moist banks commonly observable. Trees and other vegetation along the stream courses intercept much of the water that otherwise would be discharged into the streams. Indeed, the availability of ground water at shallow depth is the factor which sustains perennially the dense vegetal cover near these streams. Whenever the supply of ground water is greater than the amount required by plants along the stream courses, the excess contributes to the flow of the streams.
Discharge from springs.--There is no sharp distinction between seeps and springs, but some ground water is discharged through openings properly classed as springs in the area underlain by Cretaceous sandstone (Pl. 1). In 1944 many small springs were observed issuing from the base of the sandstone where it rests on relatively impermeable shale (Pl. 13B). Most of these springs are seasonal and cease to flow in late summer or fall. Some small springs are used to supply water to stock ponds, whereas others enter small streams through tributary gullies and part of the flow may reach Smoky Hill River or Gypsum Creek. Seeps and moist areas are observable in some places where the contact between the sandstone and shale is covered by rock material in transit downslope. Most of the ground water discharged at these places is evaporated or supports a luxuriant growth of water-loving grasses.
In the southeastern part of the area, north and east of Wichita, a few small springs occur at the contact of thin deposits of the McPherson formation with the Wellington shale at places where the land surface intersects this contact. Water from one such spring in sec. 27, T. 25 S., R. 1 E. has been bottled and sold commercially. The quantity of ground water discharged through springs in this area is very small in comparison to the total quantity discharged.
Discharge from wells.--Water is pumped for municipal, industrial, stock, domestic, and irrigation uses, listed in order of quantity pumped. The sub-areas in which largest withdrawals of ground water occur are the new Wichita municipal well-field area, situated west and south of Halstead, which supplies water to the residents and industries in and near Wichita; the business and industrial districts of Wichita and Hutchinson, where large quantities of ground water are used for cooling and air conditioning; the Newton well-field area, 2 miles east of Halstead, which supplies municipal and industrial needs at Newton; and the McPherson area, in which are located city and industrial wells. Ground water is pumped to supply most of the smaller cities in this area, but the quantity consumed is not great at any one place. Most of the farms are supplied with water from wells, but the quantity pumped at each farm for domestic and stock use is small; however, the aggregate quantity pumped from wells at farms in the whole of this area is considerable. There are few irrigation wells in this area. The quantity of water pumped for each of these uses, insofar as known, is presented in the section on water utilization.
Fluctuations in water level caused by pumping.--As soon as a pump begins discharging water from a well under water-table conditions, the ground-water level is lowered, thus establishing a hydraulic gradient toward the well. The water table soon assumes a form comparable to that of an inverted cone, the well being at the apex. For a short time most of the water that is pumped from a well is derived by unwatering materials close to it. As pumping is continued, more of the formation is gradually unwatered and a gradient is established sufficient that there may be transmitted to the well approximately the amount of water that is being pumped, most of the water being derived from ever increasing distances from the well. Thus, the cone of depression continues to expand and the water table within the cone continues to decline gradually. The development of the cone of depression may be halted if water is added to the formation by natural or artificial recharge.
After the discharge of a well has ceased, water continues to percolate toward the well for a time because the hydraulic gradient is still in that direction, but instead of being discharged at the surface the water refills the well and the adjacent material that was unwatered by pumping. As the formation near the well is refilled, the hydraulic gradient is gradually decreased and the recovery of the water level in the well becomes progressively slower. At a considerable distance from the well, the water level may continue to lower for a time after pumping has been stopped because water continues to move toward the well. In time there is a general equalization of water levels over the entire area affected, and the water table tends to assume its original form, although it may remain temporarily somewhat lower than before water was withdrawn.
In general, the hydrologic conditions near a group of pumping wells are comparable to the conditions for a single well discussed above. Pumping in the old Wichita well field affected water levels in the area bounded by the Arkansas and Little Arkansas rivers. The pumping since September 1, 1940, from 25 wells in the new Wichita well field has affected water levels beneath a large area in and around the well field. The area affected by pumping a single well or a group of wells is herein referred to as the area of influence.
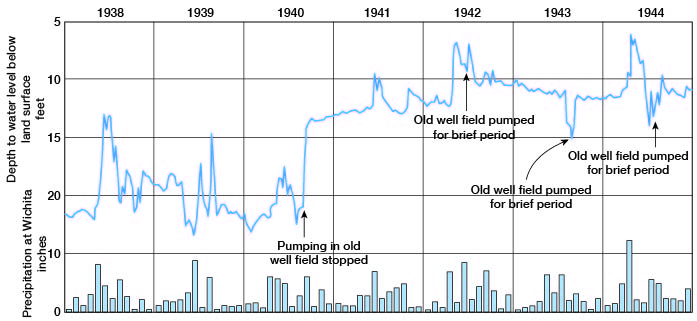
The effect of pumping on ground-water levels in the old Wichita well field is illustrated by the hydrograph of well 674, Figure 22. From January 1, 1938 to September 1, 1940, the depth to water level in well 674 averaged about 20 feet below land surface and the fluctuations caused by pumping and precipitation were mingled. When pumping ceased in this well field on August 31, 1940, the water level rose rapidly for a short time and continued to rise until a stage about 10 feet above the average pumping stage had been reached. Recharge from precipitation produced rises in water level, particularly in 1941, 1942, and 1944, as shown on the graph. In 1942, 1943, and 1944, the wells in the old well field were pumped for brief periods because of mechanical failure of the new facilities or because of short time demands for excessive quantities of water. The effects of pumping in the old well field during these periods are shown on Figure 22.
Figure 22--Hydrograph showing the fluctuations of water level in well 674 in the old Wichita well field, and the monthly precipitation at Wichita.
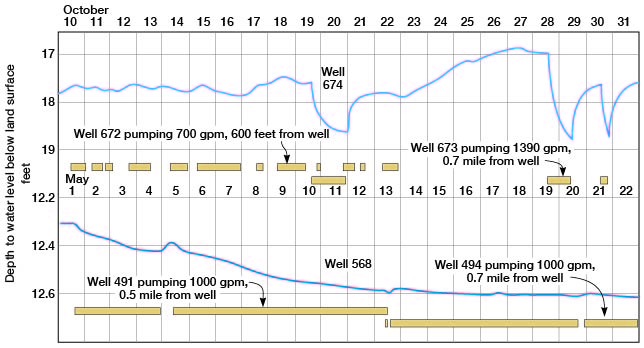
Fluctuations in water level in well 674 caused by pumping wells 672 and 673 in the old Wichita well field are shown by the hydrograph on Figure 23, which were taken from automatic recorder charts. Although pumping from most of the wells in the old Wichita well field affects the water level in well 674, the greatest fluctuations are caused by wells 672 and 673 which are located only 600 feet and 80 feet respectively from well 674 and were pumped at the rates of about 700 and 1,300 gallons a minute. The hydrograph shows this greater effect of the nearby wells superimposed upon the lowered water level caused by pumping all the wells in the well field. Examination of the hydrograph shows that pumping from well 673 causes a greater lowering of the water level in well 674 than does pumping from well 672, because well 673 is much closer to the observation well and it is pumped at a greater rate. Water levels continue to decline in observation wells some distance from pumped wells for varying periods of time after pumping ceases. Comparison of the hydrograph of well 674 with the bars designating the periods of pumping at wells 672 and 673 shows that the periods of water-level decline in the observation well extend beyond the pumping periods and that recovery begins a few hours later.
Figure 23--Hydrographs showing the fluctuations of water level in well 674 caused by pumping wells 672 and 673 in October 1937, and in well 568 causing by pumping wells 491 and 494 in May 1941.
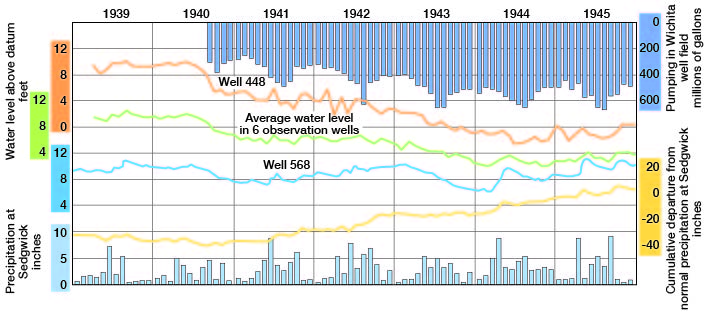
The new Wichita well field (Pl. 28) supplies the largest quantity of water discharged from any one of the sub-areas mentioned above. The quantity pumped during the period from September 1, 1940 to January 1, 1945 was 23,284 million gallons, an average of 448 million gallons a month or about 15 million gallons a day. The quantity of water pumped has ranged from 248 million gallons in February 1941 to 653 million gallons in July 1943 and August 1944. The quantity of water pumped monthly is given in the section on public supplies. Hydrographs showing the fluctuations caused by pumping and by natural processes, together with graphs showing the quantity of water pumped from the city wells and the precipitation at Sedgwick are presented in Figure 24. Well 448 is situated near the center of the well field and is affected by the pumping of several nearby wells; well 568 is about half a mile south of the south end of the well field and is affected only by the pumping of wells 491 and 494. Six wells, including the two above (Nos. 327, 414, 448, 470, 486, and 568), which are located an average of about half a mile from pumped wells and hence are affected by pumping, were selected for study and the hydrograph of the average monthly water level in these wells is shown on Figure 24. From September 1, 1940 to January 1, 1945 the water level in well 448 declined 7.99 feet, the average water level in six wells affected by pumping declined 6.02 feet, and the water level in well 568 declined 2.36 feet as the result of pumping from the city wells. The effect of recharge on the water levels in these wells seems to have been masked except in well 568, where the effect of pumping has been less than that of recharge, especially in 1942 and 1944. Figure 23 shows that pumping from either or both of wells 491 and 494 lowers the water level in the observation well (568), although the amount of lowering is small owing to the distance from the points of withdrawal.
Figure 24--Hydrographs showing the fluctuations of water levels in the new Wichita well-field areas, pumpage from the new Wichita well field, monthly precipitation at Sedgwick, and cumulative departure from normal precipitation at Sedgwick.
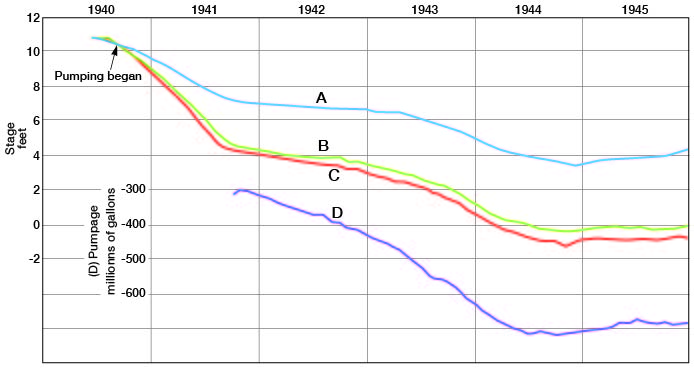
At the time the 25 new Wichita city-supply wells were constructed, observation wells were drilled 100 feet and 500 feet from each well. These observation wells have been measured at regular intervals since construction. The effects of pumping from the supply wells on the water level in these observation wells and on the water level in the six observation wells referred to above are shown on Figure 25, together with the monthly pumpage from the supply wells. The water levels in all of the observation wells were assigned a stage of 10 feet above an arbitrary datum on June 1, 1939. The average monthly water level in six comparable observation wells located about half a mile from the pumped wells, in the 25 wells located 100 feet from the pumped wells, and in the 25 wells located 500 feet from the pumped wells was computed for each of these three groups of wells, and a progressive average of average monthly water level was calculated for each group, based on the year June 1, 1939 through May 30, 1940. Similarly, a graph of the progressive average of the quantity of water pumped each month from the city supply wells was prepared, based on the year September 1, 1940 through August 31, 1941, the first year of pumping. The use of progressive averages results in smoother curves than those from data plotted directly and trends of water levels and pumpage are more readily discernible. An interesting fact shown by the similar curves is that as the rate of pumping increased, the average water level in all of the wells declined and that this decline ceased toward the end of 1944 when the pumping rate became nearly constant. The graphs indicate that water levels in wells 100 feet, 500 feet, and half a mile from the pumped wells probably will remain near the average levels attained at the end of 1944 if the rate of pumping remains nearly uniform and if comparable amounts of recharge are received.
Figure 25--Graphs showing one-year progresive averages of: (A) the average monthly stage of water levels in 6 observation wells located approximately one-half mile from supply wells; (B) the average monthly stage of water levels in 25 wells, each located 500 feet from supply wells; (C) average monthly stage of water levels in 25 wells located 100 feet from supply wells; and (D) monthly pumpage from 25 wells in the new Wichita well field.
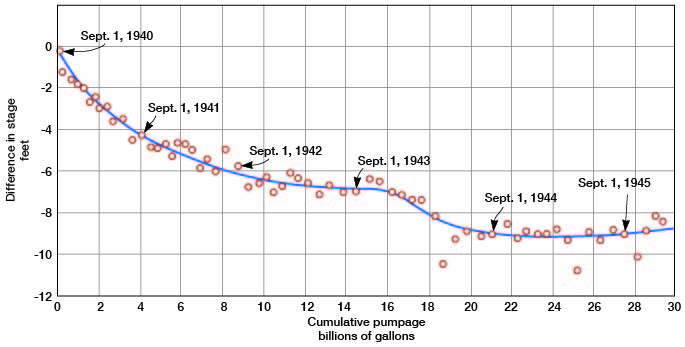
The effects of pumping on water levels shown on graphs above are superimposed upon natural fluctuations of water level caused by excess or deficient precipitation. In order to determine more nearly the effect of pumping alone, the difference between the average water level in 10 wells not affected by pumping and the average water level in six wells affected by pumping was calculated, and this difference in average monthly stage was plotted against cumulative pumpage from the Wichita city water-supply wells. The graph of the curve so obtained is shown on Figure 26. The 10 wells not affected by pumping are discussed above in the section concerning recharge and the 6 wells affected by pumping are discussed above in this section. All of the wells are in the new Wichita well-field area. The curve in Figure 26 shows the greater rate of lowering of water levels during the first year of pumping than in succeeding years, the nearly stabilized condition of the water levels at the end of the third year of pumping, the increase in rate of pumping in 1943 and 1944, the readjustment of water levels to the increased rate of pumping in 1944, and the seeming re-stabilization of water levels at the end of 1944.
Figure 26--Graph showing the relationship between the difference in average water levels in 10 wells not affected by pumping and 6 wells affected by pumping, and cumulative pumpage from the Wichita city water-supply wells.
A study of the effect of pumping from the new Wichita well field on water levels in the area of pumping influence has been made and additional maps and data are presented in the section relating to the perennial yield of the aquifer.
Prev Page--Ground-water Recharge || Next Page--Recovery of Ground Water
Kansas Geological Survey, South-central Kansas
Comments to webadmin@kgs.ku.edu
Web version April 2005. Original publication date July 1949.
URL=http://www.kgs.ku.edu/Publications/Bulletins/79/12_gwdischarge.html