![]()
Prev Page--Ground Water || Next Page--Ground-water Recharge
Fluctuations of the Water Table
General Considerations
The water table, shown by means of contours on Plate 1, does not remain static but fluctuates much like the water level of a surface reservoir. Whether the water table rises or declines depends upon the amount of recharge into the ground-water reservoir and the amount of discharge from it. If the inflow exceeds the draft, the water table will rise; conversely, if the draft exceeds the inflow into the ground-water reservoir the water table will decline. The amount of rainfall that penetrates the soil and descends to the zone of saturation is the principal factor that controls the rise of the water table. Discharge from wells, from seeps and springs, and through evaporation and transpiration are the principal factors that cause a decline in the water table. Fluctuations of the water table due to these causes are discussed and many hydrographs of observation wells are presented on succeeding pages.
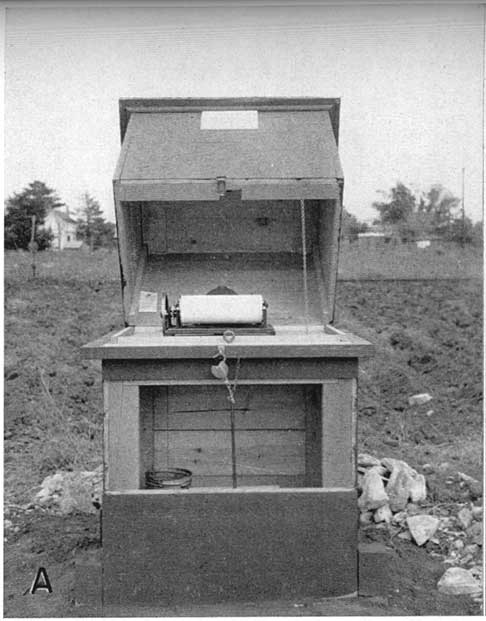
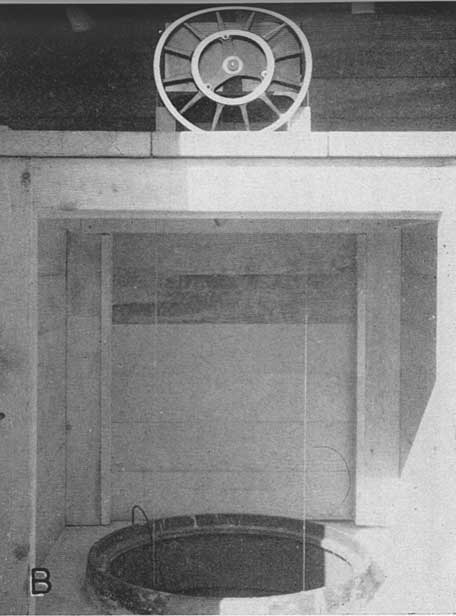
The fluctuations of the water table in McPherson, Harvey, and Sedgwick counties were determined by observing the water levels in wells. Measurements in many observation wells were begun in 1937 and are being continued at this time. Some wells are measured weekly, others are measured monthly or quarterly, while others are equipped with automatic water-stage recorders which yield a continuous record (Pl. 27). The water-level measurements have been made by G. H. Von Hein and C. K. Bayne.
Plate 27--Automatic water-stage recorders on observation wells. A, Well 86 near McPherson. B, Well 674 in old well field of Wichita Water Company. photographs by S. W. Lohman.
Water-level measurements made from 1937 through 1944 have been published annually in U.S. Geological Survey Water-Supply Papers 840, 845, 886, 908, 938, 946, 988, and 1018, and future measurements will be published in ensuing reports of this series. The well numbers used in this report and in the Water-Supply Papers are given in Table 11.
Table 11.--Observation wells in McPherson, Harvey, and Sedgwick Counties.
| Well No. in this report |
Well No. in Water-Supply Paper 840, 845, 886, 908, 938, 946, 988, and 1018 |
|---|---|
| McPherson County | |
| 20 | 260 |
| 33 | 249 |
| 58 | 262 |
| 79 | 243 |
| 86 | 19 |
| 104 | 250 |
| 160 | 310 |
| 161 | 311 |
| 166 | 1501a |
| 202 | 309 |
| Harvey County | |
| 223 | 72 |
| 246 | 249 |
| 299 | 888 |
| 300 | 889 |
| 305 | 854 |
| 309 | 507 |
| 310 | 506 |
| 311 | M-1 |
| 312 | M-1a |
| 313 | M-1b |
| 314 | M-2 |
| 315 | M-2a |
| 316 | M-2b |
| 317 | M-3 |
| 318 | M-3a |
| 319 | M-3b |
| 321 | 1192 |
| 322 | M-4 |
| 323 | M-4a |
| 324 | M-4b |
| 325 | 1112 |
| 327 | 872 |
| 328 | 873 |
| 329 | 874 |
| 330 | M-5 |
| 331 | M-5a |
| 332 | M-5b |
| 333 | M-6 |
| 334 | M-6a |
| 335 | M-6b |
| 339 | 87 |
| 340 | 86 |
| 354 | 875 |
| 355 | 877 |
| 356 | 876 |
| 358 | 325 |
| 395 | 701 |
| 400 | 831 |
| 401 | 832 |
| 402 | 1187 |
| 403 | 833 |
| 404 | 824 |
| 405 | 852 |
| 407 | 1174 |
| 411 | 817 |
| 414 | 821 |
| 415 | M-8 |
| 416 | M-8a |
| 417 | M-8b |
| 419 | M-10 |
| 420 | M-10a |
| 421 | M-10b |
| 423 | M-9 |
| 424 | M-9a |
| 425 | M-9b |
| 426 | 350 |
| 427 | 351 |
| 428 | 352 |
| 429 | M-11 |
| 430 | M-11a |
| 431 | M-11b |
| 432 | 3 |
| 433 | M-15 |
| 434 | M-15a |
| 435 | M-15b |
| 436 | M-12 |
| 437 | M-12a |
| 438 | M-12b |
| 439 | M-14b |
| 440 | M-16 |
| 441 | M-16a |
| 442 | M-16b |
| 445 | 853 |
| 446 | 1186 |
| 448 | 886 |
| 449 | 887 |
| 450 | M-14 |
| 451 | M-14a |
| 452 | M-17 |
| 453 | M-17a |
| 454 | M-17b |
| 455 | M-7 |
| 456 | M-7a |
| 457 | M-7b |
| 458 | 1189 |
| 459 | M-13 |
| 460 | M-13a |
| 461 | M-13b |
| 462 | 894 |
| 463 | 895 |
| 464 | 1188 |
| 465 | M-18 |
| 466 | M-18a |
| 467 | M-18b |
| 469 | 2 |
| 470 | 883 |
| 471 | 884 |
| 472 | 885 |
| 473 | M-21 |
| 474 | M-21a |
| 475 | M-21b |
| 476 | M-22 |
| 477 | M-22a |
| 478 | M-22b |
| 479 | M-19 |
| 480 | M-19a |
| 481 | M-19b |
| 486 | 839 |
| 487 | M-23 |
| 488 | M-23a |
| 489 | M-23b |
| 491 | M-24 |
| 492 | M-24a |
| 493 | M-24b |
| 494 | M-25 |
| 495 | M-25a |
| 496 | 878 |
| 497 | 879 |
| 502 | 880 |
| 503 | 881 |
| 511 | 890 |
| 516 | 891 |
| 517 | 892 |
| 518 | 893 |
| Sedgwick County | |
| 536 | 28 |
| 538 | 825 |
| 540 | 826 |
| 544 | 816 |
| 547 | 814 |
| 549 | 815 |
| 557 | 12 |
| 558 | 812 |
| 560 | 811 |
| 563 | 810 |
| 567 | M-25b |
| 568 | 307 |
| 572 | 840 |
| 575 | 842 |
| 578 | 870 |
| 582 | 830 |
| 588 | 834 |
| 593 | 838 |
| 606 | 809 |
| 609 | 502 |
| 619 | 800 |
| 627 | 804 |
| 628 | 805 |
| 634 | 807 |
| 636 | 806 |
| 637 | 808 |
| 642 | |
| 660 | 845 |
| 663 | 847 |
| 664 | 846 |
| 674 | 26 |
| 715 | 802 |
Fluctuations Caused by Changes in Atmospheric Pressure
In addition to the fluctuations of the water table caused by addition or withdrawal of water, minor fluctuations caused by changes in atmospheric pressure are observed in some wells. Wells that penetrate water-bearing formations having a relatively impervious bed above the zone of saturation may fluctuate inversely as the barometer fluctuates. The pressure on the water surface in a well increases directly as the increase in atmospheric pressure. If this increase in pressure is not transmitted uniformly to the ground-water body, but acts only on the exposed water surface in the well, the water level in the well fluctuates according to the changes in pressure. If the pressure is transmitted freely through the pore spaces of the soil to the water table, the water level will reflect no appreciable barometric effect.
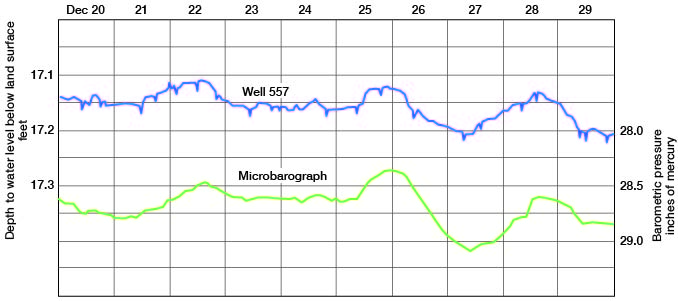
Hydrographs of wells 202, 310, and 557, obtained from automatic water-stage recorders and inverted barographs obtained from a recording micro-barograph in the same shelters are shown in Figures 12 and 13. Well 202 is the most efficient water barometer of the three shown. This well penetrates part of the Ninnescah shale and the water-bearing zone is overlain by nearby impervious shale. Well 310 penetrates sand and gravel of the McPherson formation, and the water-bearing bed is overlain by a comparatively thin bed of silt and clay. The gravel bed penetrated by well 557 is overlain by about 10 feet of clay and silt which acts as a confining bed, especially at high ground-water stages. The hydrograph of well 557 shows the effect of a nearby domestic well which is equipped with a small automatic pump and pressure tank. The hydrograph also shows the artesian effect produced by the clay bed above the saturated sand and gravel.
Figure 12--Water-level fluctuations in well 202 in 1938 and 310 in 1939 caused by changes in atmospheric pressure.
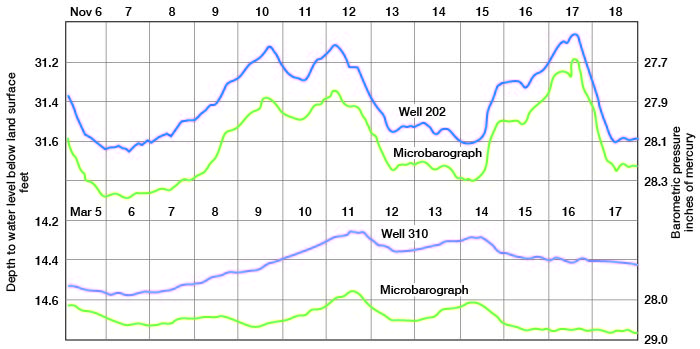
Figure 13--Water-level fluctuations in well 557 in 1938 caused by changes in atmospheric pressure.
Prev Page--Ground Water || Next Page--Ground-water Recharge
Kansas Geological Survey, South-central Kansas
Comments to webadmin@kgs.ku.edu
Web version April 2005. Original publication date July 1949.
URL=http://www.kgs.ku.edu/Publications/Bulletins/79/10_fluct.html