![]()
Prev Page--County Studies, continued || Next Page--Water Use
Aquifer parameters
Aquifer tests are useful in determining hydraulic properties of water-bearing layers and confining beds and can be used to estimate well yields. Data obtained from a pump test usually consist of a time series of water-level measurements in the pumped well and observation welles) after pumpage is initiated. The difference between the static water level and these water-level measurements is called the draw down in the well. Transmissivity T and the storage coefficient S are hydrologic properties determined from the drawdown data.
The ability of an aquifer to transmit water is measured by T, which is the rate at which water of the prevailing kinematic viscosity is transmitted through a unit width of saturated aquifer under a unit hydraulic gradient. The units of T are usually given in gallons per day per foot (gpd/ft) or in cubic feet per second per foot (ft3/s/ft or ft2/s). From the transmissivity the hydraulic conductivity K can be determined. K is commonly reported in velocity units of feet per second (ft/s) or gallons per day per foot squared (gpd/ft2). This parameter reflects the characteristics of the porous medium and of the fluid and is calculated by dividing the transmissivity by the aquifer thickness.
The storage coefficient S of an aquifer is defined as the volume of water that a unit volume of aquifer releases from storage under a unit decline in hydraulic head. The storage coefficient for an unconfined aquifer is the specific yield, which is defined as the ratio of the volume of water that a saturated material will yield by gravity to its own volume.
We analyzed aquifer test data for glacial, alluvial, and bedrock aquifers in northeastern Kansas using automated fitting techniques to obtain transmissivity and storage values. A number of computer programs were available to find the best fit for T and S values from the original pump-test drawdowns. For a more detailed discussion of these programs and the 80 northeastern Kansas pump-test analyses performed, see Miller (1987), and for discussions of the Theis and Leaky automated fitting techniques, see McElwee (1980) and Cobb et al. (1982).
Aquifer evaluations in glacial materials are shown in table 2. This table is a compilation of the information available but does not include pump tests that had major problems, such as an insufficient pumping rate for the aquifer, a test duration that was too short, or an insufficient number of drawdown measurements to define a curve. T and S values that are accompanied by question marks indicate that there was difficulty in the test evaluation (because of insufficient data or large errors in fitting techniques) and that these values are the best possible estimations.
Table 2--Pump-test data for glacial aquifers.
| County, city, and legal description |
Approximate transmissivity (gpd/ft) |
Approximate storage capacity |
Pump-test date |
Pumping rate (gpm) |
Number of observation wells |
Duration of test (min) |
Depth of test well (ft) |
Screened depth interval (ft) |
Screened materials |
|---|---|---|---|---|---|---|---|---|---|
| Atchison County | |||||||||
| Everest 5-18E-6ACC |
180,000 | - | Dec. 1968 | 302 | None | 270 | 59 | 44-59, gravel-packed |
Brown medium-grained sand and lime gravel |
| Horton 5-18E-6CDC |
7,500 | 0.0008 | May 1978 | Variable (60-100) |
4 | 1,440 | 40 | Unknown | 12 ft of medium- to coarse-grained sand |
| Lincoln Grain 6-20E-20 |
2,500 | - | Nov. 1967 | 75 | None | 330 | 70 | 53-58 and 65-70 |
Medium- to coarse-grained sand and gravel; medium to coarse gravel |
| Lincoln Grain 6-20E-20DBA |
145 | 0.11 (?) | July 1973 | 10-20 | None | 320 | 150 | 145-150 | Sandy clay; trace gravel; gray coarse- to medium- grained sand to fine-grained sand |
| Jefferson County | |||||||||
| RWD12 7-19E-32ADD |
25,000 | 0.002 | May 1973 | 90 | 4 | 1,440 | 127 | 110-120 | Pea gravel and fine-grained sand, cemented |
| RWD 12 7-19E-33 |
200,000 (?) |
0.01 | June 1973 | 90 | 2 | 1,515 | 105 | 95-105 | Coarse-grained sand; small and pea gravel |
| RWD 12 8-19E-5CBB |
1,500 | 0.0009 | June 1973 | 18.4 | 2 | 280 | 160 | 147-160 | Black clay and coarse-grained sand and gravel |
| Winchester 8-19E-26CBB |
3,500 | - | Oct. 1969 | Variable (40-60) |
None | 447 (?) |
125 | 41-46, 67-72, and 115-125 |
Silty clay, medium- to coarse-grained sand, some fine gravel; loose medium- to coarse-grained sand, some fine-grained; trace gravel; dense, weathered lime- stone and medium-grained shale and medium-grained gray sandstone |
| McLouth 9-20E-32CDD |
10,000 | 0.0004 | Apr. 1967 | Variable (10-20) |
3 | 1,400 | 27 | 22-27 | Brown medium- to coarse-grained, wet, loose sand |
| RWD 3 10-17E-3A |
100,000 | 0.0003 | Dec. 1977 | 500 | 3 | 1,500 | 82 | 62-82 | Brown medium- to coarse-grained sand with trace of fine-grained material and boulders |
| Nemaha County | |||||||||
| Oneida 1-13E-35CAC |
22,000 | 0.00002 | May 1966 | 25 | None | 510 | 40 | 35-40 | Brown medium- to coarse-grained sand and gravel, boulders |
| Centralia 4-11E-12ABCC |
361 (?) |
- | July 1960 | 30 | None | 480 | 54 | 38-54 | Medium- to coarse-grained sand and gravel and gray silty clay |
| Goff 4-13E-35ABC |
26,000 | Nov. 1966 | Variable (80-160) |
None | 360 | 122 | 106-122 | Medium- to coarse-grained sand | |
| RWD 3 5-11E-2BCC |
20,000 | - | Apr. 1072 | Variable (182-184) |
1 | 1,440 | 314 | Unknown and 298-314 |
20-30 ft of medium- to coarse- grained sand, gray coarse-grained sand, and gravel and chert gravel |
| Onaga 5-11E-10ADB3 |
15,000 | 0.0002 | Aug. 1977 | 190, 199-212 | 2 | 500 | 290 | 270-282 and unknown |
Gray medium- to coarse-grained sand and gravel with trace of fine- grained material and boulders |
| Corning 5-12E-1CBB |
7,500 | - | Jan. 1961 | Variable (27-66) |
1 | 180 | 54 | 41-48 and unknown |
Coarse-grained sand, medium- and fine-grained sand and large boulders |
| Wyandotte County | |||||||||
| Dub's Dread Golf Course 10-23E-33DAB |
28,000 and 55,000 |
0.04 and 0.0005 (?) |
July 1973 | 61 | 3 | 1,500 | 48 (?) |
22-37 and 37-48 |
Gravel and coarse-grained sand |
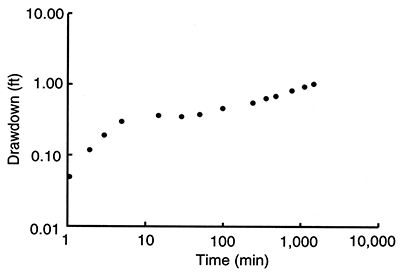
Glacial aquifers are seldom homogeneous in nature. Often they are characterized by lateral or layered heterogeneity; that is, their hydraulic conductivity can vary vertically or horizontally. The presence of clay lenses in these aquifers is also common and is sometimes indicated by a slight steepening of the data curve, which might be interpreted as a barrier boundary. Many of the glacial aquifer wells are screened in coarse-grained sand and gravel deposits that have materials of lower permeability, such as silty and clayey deposits, above them. Although the overlying materials have a lower hydraulic conductivity, they are usually saturated and contribute water as pumpage occurs. The shape of the curve in fig. 81 (data from the pump test in Wyandotte County) appears to reflect this situation. During the early part of the test, water was depleted from the coarser, screened aquifer material. As pumpage continued, the finer-grained overlying deposits were drained in a vertical direction; this delayed drainage depressed the drawdown curve. If the test had been continued for a long enough time period, a confining layer would have been reached and the curve would have responded by becoming steeper, as in the early part of the test.
Figure 81--Time versus drawdown for a pump test on well 10-23-33DAB, at the golf course, Wyandotte County.
Aquifer parameters in the major buried-valley system extending from Nemaha County to Atchison County include T values of 2,500-25,600 gpd/ft (31-318 m2/d) and S values of 0.00002-0.002. Transmissivities in the deepest region of the buried valley in southwestern Nemaha County were 15,000-20,000 gpd/ft (190-250 m2/d) and S values were very consistent--0.0001- 0.0002. These test wells were 290 ft (88 m) and 314 ft (95.7 m) in depth and were probably screened only in 10-20 ft (3-6 m) of basal sand and gravel.
Buried tributaries belonging to the major buriedvalley system had T values of 1,500-25,000 gpd/ft (19-310 m2/d). The deepest test well [160 ft (49 m)], located in a buried-valley tributary aquifer in Jefferson County, was screened in 13 ft (4.0 m) of blue clay, coarse-grained sand, and gravel. However, in the same area high T values were obtained from shallower wells [40-127 ft (12-38.7 m) in depth). The Everest and Horton tests were conducted in a northern buried drainage to the buried valley in Atchison County and yielded a T value of 7500 gpd/ft (93 m2/d) and an S value of 0.0008. Tests performed for Winchester and McLouth in Jefferson County were located in a broad glacial drift area. T values for these aquifers ranged from 3,500 gpd/ft to 10,000 gpd/ft (43-120 m2/d) and S was equal to 0.0004 in test wells that were 125 ft (38.1 m) and 127 ft (38.7 m) in depth.
The thickness of glacial sediments decreases eastward in the major buried valley. A 70-ft (21-m) test well in Atchison County was screened in 10 ft (3 m) of medium- to coarse-grained sand and gravel. The well was located in the middle of the buried valley, and a T value of 2,500 gpd/ft (31 m2/d) was determined.
Comparatively narrow buried valleys that are not part of the major buried-valley system had some of the highest T values of the glacial aquifers. The Jefferson County RWD 3 test well, located in a narrow buried channel [locally 500 ft (150 m) wide], is 82 ft (25 m) deep and has a T value of 100,000 gpd/ft (1,200 m2/d). A 48-ft (15-m) test well in Wyandotte County is located in a narrow buried valley [up to 0.5 mi (0.8 km) wide] that connects the Stranger Creek and Missouri River valleys. The transmissivity in this coarse-grained sand and gravel aquifer is 28,000 gpd/ft (350 m2/d). Storage values obtained for these tests are O.04-and 0.0005.
Relating glacial depositional environments to the type of glacial sediments may help to delineate areas of high transmissivity. Kehew and Boettger (1986) report that the most productive aquifers are present along the valley sides rather than in the valley centers for certain types of glacial buried valley in North Dakota. As discussed previously, the narrow buried channel in Jefferson County contains more than 100 ft (30 m) of glaciofluvial sands and gravels and was probably cut and buried quickly by water flowing at a high velocity and/or under a steep gradient; the buried valley in Wyandotte County may have originated in association with ice-marginal drainage.
Low-transmissivity boundaries affected drawdown data in most of the glacial aquifer tests. The distribution of coarse-grained materials in aquifer bodies varies widely, and coarse-grained layers may grade into finergrained materials horizontally within hundreds or even tens of feet. In a 1986 pump test for Nemaha County RWD 3, wells located in the major buried valley in southwestern Nemaha County had drawdowns that were affected within 50 minutes during the test by public water-supply wells operating 0.75 mi (1.2 km) away. These results suggest that the coarse-grained, hightransmissivity aquifer body is limited in its areal extent.
Aquifer tests for alluvial aquifers in northeastern Kansas were mainly for wells located in the Kansas and Missouri River valleys (table 3). Tests along the Kansas River were performed in Douglas, Jefferson, Johnson, Shawnee, and Wyandotte counties and had transmissivities of 50,000-600,000 gpd/ft (600-7,000 m2/d). Extensive tests were performed using various pumping rates [up to 1,100 gpm (0.069 m3/s)] and various durations for an industrial facility located along the Kansas River in Topeka. Transmissivities from these tests ranged from 350,000 gpd/ft to 670,000 gpd/ft (4,300-8,300 m2/d); and storage values were 0.03 and probably reflect semiconfined conditions. Many tests were conducted for Johnson County RWD 1 and along the Kansas River in Wyandotte County, and transmissivities ranged from 300,000 gpd/ft to 500,000 gpd/ft (4,000-6,000 m2/d). Transmissivities were generally lower in Douglas and Jefferson counties, although most of the test wells were located farther from the river and in terrace deposits.
Table 3--Pump-test data for alluvial aquifers.
| County, city, and legal description |
River | Transmissivity (gpd/ft) |
Pump storage |
Pumping test date |
Rate (gpm) |
Number of observation wells |
Duration of test (min) |
Depth of test well (ft) |
Screened depth interval (ft) |
Screened materials |
|---|---|---|---|---|---|---|---|---|---|---|
| Atchison County | ||||||||||
| St. Benedicts 5-21E-29BAA |
Missouri | 500,000 | - | May 1967 | 1,305 | 3 | 330 | - | - | No log |
| Midwest Solvent 55-37W-19CCA (in Missouri) |
Missouri | 300,000 | 0.00001 | July 1967 | 1,000-1,950 | None | 180 | 92 | 67-92 | Medium- to coarse-grained sand and gravel |
| Doniphan County | ||||||||||
| White Cloud 1-19E-15BBB |
Missouri | 26,000 | - | Aug. 1963 | 50-150 | None | 360 | 60 | 55-60 | Medium- to coarse-grained sand and gravel, boulders |
| Douglas County | ||||||||||
| Baldwin 13-20E-9 |
Kansas | 212,000 | 7.4 x 10⁻⁷ | July 1972 | 221 | 1 | 480 | 75 | 5 screened | - |
| Eudora 13-13-21E-5DB |
Kansas and Wakarusa |
117,000 | 4 x 10⁻⁸ | July 1974 | 459 | None | 240 | 71 | 10 screened | Coarse- to medium-grained sand and trace boulders |
| Jefferson County | ||||||||||
| Oskaloosa RWS 9-18E-31DBA |
Delaware | 8,000 | 4 x 10⁻⁴ | May 1967 | 30 | 2 | 420 | 50 | 33-46 | Coarse- to fine- grained sand and gravel |
| RWD 8 10-10-17E-27AAA |
Delaware/Rock Creek | 26,000 | - | Apr. 1969 | 15-45 | None | 360 | 53 | 15-19 | Medium- to coarse-grained sand and gravel, sandy clay, and gravel |
| RWD 15 11-17E-17CCC |
Kansas | 260,000 | - | Feb. 1979 | 280 | None | 480 | 67 | 47-67 | - |
| RWD 10-18E-19DAA |
Delaware | 5,000 | 4 x 10⁻⁴ | Dec. 1968 | 20 | 1 | 360 | 60.5 | 54-60 | Coarse- to medium-grained sand and gravel |
| New Ozawkie 9-17E-25DAC |
Delaware | 18,000 | 0.01 | Feb. 1966 | 50 | None | 1,440 | 54 | 44-54 | Medium- to coarse-grained sand and gravel |
| Perry 11-18E-22DAA |
Kansas | 460,000 | 2 x 10⁻⁸ | Apr. 1966 | 100-201 | None | 180 | 83 | 73-83 | Medium- to coarse-grained sand and gravel with boulders |
| Leavenworth County | ||||||||||
| Ft. Leavenworth 8-22E-13BAA |
Missouri | 600,000 | - | July 1974 | 860-1,750 | None | 720 | 93.5 | 45 screened | - |
| Shawnee County | ||||||||||
| Goodyear Tire and Rubber Co. 11-15E-13DAD and 13DAA |
Kansas | 300,000-600,000 | 0.0001 (?) | Apr. 1960 | 225-990 | 4 | -1,740 | 81 and 49 | - | - |
| Wyandotte County | ||||||||||
| Inland Underground Storage 11-24E-27BAC |
Kansas | 360,000 | - | Jan. 1965 | 200-500 | None | 240 | 64 | 44-64 | - |
| Johnson County | ||||||||||
| RWD 1 11-24E-29CDC |
Kansas | 330,000 | - | Dec. 1959 | 607 | 7 | 4,320 | 65 | 50-65 (?) | Medium- to coarse-grained sand and gravel |
| Superior Sand Co. 11-23E-31DAB |
Kansas | 400,000 | - | Mar. 1971 | 703 | None | 240 | 59 | 39-59 | Medium- to coarse-grained sand and gravel |
Pump tests for wells in the Missouri River alluvium were conducted in Atchison, Leavenworth, and Doniphan counties. Transmissivity values ranged from 200,000 gpd/ft to 600,000 gpd/ft (2,000-7,000 m2/d), with most of the T values close to 300,000 gpd/ft (4,000 m2/d). The highest transmissivities were in Leavenworth County at Ft. Leavenworth and in Atchison County at St. Benedicts, with transmissivities of 600,000 gpd/ft (7,000 m2/d) and 500,000 gpd/ft (6,000 m2/d), respectively. Storage values were between 0.0004 and 0.001.
In Jefferson County performance tests were done on the Delaware River alluvium, mostly along the periphery of Perry Lake. Transmissivity values were in the range of 5,000-25,600 gpd/ft (60-318 m2/d). Test wells in the main part of the Delaware River alluvium were 45-64 ft (14-20 m) in depth and yielded transmissivities of 5,000-8,000 gpd/ft (60-100 m2/d) and storage values of 0.0004. The highest T value [25,600 gpd/ft (318 m2/d)] in this area is probably from an aquifer having a combination of glacial and alluvial sediments. The test well is not in the main part of the Delaware River alluvium and is screened in 26 ft (7.9 m) of sand and gravel. Aquifer tests in the Delaware River alluvium were affected by multiple boundaries, including bedrock barrier boundaries and recharge boundaries from Perry Lake, depending on the test's duration.
There was little available information for pump tests in bedrock aquifers in northeastern Kansas, and data were questionable in most cases (table 4). A pump test analysis in Nemaha County near the city of Sabetha gave a T value of 2500 gpd/ft (31 m2/d) and a storage value of 0.0005 for an aquifer in a limestone fracture zone 60-140 ft (18-43 m) deep. About 5 mi (8 km) south of the city of Fairview in Brown County, we tested an aquifer in a limestone fracture zone [91-106 ft (28-32.3 m) deep] and obtained questionable transmissivities of 30-140 gpd/ft (0.4-1.7 m2/d), but we did not measure drawdowns until 10 minutes after pumpage began. A 107-ft-deep (32.6-m-deep) test well screened in limestone and shale layers in Wabaunsee County gave a T value of 200 gpd/ft (2 m2/d). A questionable aquifer test was done for a sandstone aquifer in Leavenworth County. The data for this test are confusing, and the discharge rate is so large that it seems unreasonable for even the best bedrock aquifers in this area.
Table 4--Pump-test data for bedrock aquifers.
| County, city, and legal description |
Transmissivity (gpd/ft) |
Storage capacity |
Pump-test date |
Pumping rate (gpm) |
Number of observation wells |
Duration of test (min) |
Depth of test well (ft) |
Screened depth interval (ft) |
Screened materials |
|---|---|---|---|---|---|---|---|---|---|
| Brown County | |||||||||
| JBNTel. Co. 3-15E-28DDD |
30-140 | - | Mar. 1968 | 8 | None | 120 | 97 | 92-97 | Limestone |
| Leavenworth County | |||||||||
| Tonganoxie 11-21E-10CAB |
- | - | May 1974 | 385-405 | 2 (?) | 1,500 | 80 (?) | - | Sandstone |
| Nemaha County | |||||||||
| Sabetha 2-14E-13BBC |
2,500 | 5 x 10⁻⁴ | Feb. 1979 | 50 | 3 | 1,500 | 100 | 78-98 | Limestone and shale |
| Wabaunsee County | |||||||||
| Wabaunsee East USD3 13-12E-3BDA |
200 | - | Feb. 1970 | None | None | 345 | 107 | - | Limestone and shale |
We calculated hydraulic conductivity by dividing the calculated transmissivity value by the screened length of the well. The screened length does not represent the total aquifer thickness for most of the alluvial and glacial aquifers, and the true aquifer thickness is generally greater because of permeable layers above or below the screened section. Therefore the K value is more representative of the screened interval, not the total saturated aquifer.
Hydraulic conductivity K for the alluvial aquifers ranged from 554 gpd/ft2 (22.6 m/d) in the Delaware River alluvium to 42,000 gpd/ft2 (1700 m/d) in the Kansas River deposits near Bonner Springs. According to ideal aquifer K values (table 5), the lower value is characteristic of silty to clean sand and the upper value is typical of clean sand and gravel. Lower K values for the Kansas River had magnitudes of 103 gpd/ft2 (101 m/d), with the remaining K values ranging from 13,000 gpd/ft2 to 33,000 gpd/ft2 (530-1,300 m/d). Hydraulic conductivities for the Missouri River alluvium ranged from 12,000 gpd/ft2 to 30,000 gpd/ft2 (490-1,200 m/d), with the highest value determined from a test in Atchison County (sec. 29, T. 5 S., R. 21 E.).
Table 5--Range of values of hydraulic conductivity.
| Unconsolidated aquifer material | Range of K (gpd/ft2) |
|---|---|
| Unweathered marine clay | 10-6-10-2 |
| Glacial till | 10-5-10 |
| Silt, loess | 10-2-102 |
| Silty sand | 10-1-103 |
| Clean sand | 10-105 |
| Gravel | 104-106 |
| Adapted from Freeze and Cherry (1979). | |
The glacial aquifers had hydraulic conductivities ranging from 115 gpd/ft2 to 5,000 gpd/ft2 (4.69-200 m/d). The lowest K values were for an aquifer in Jefferson County (sec. 5, T. 8 S., R. 19 E.) and for an aquifer in Nemaha County close to Turkey Creek. Hydraulic conductivities greater than 1,000 gpd/ft2 (40 m/d), typical of clean sand, were determined for aquifers in Atchison, Jefferson, Nemaha, and Wyandotte counties. The highest K values were found in tests for Jefferson County RWD 3 and a golf course in Wyandotte County.
Prev Page--County Studies, continued || Next Page--Water Use
Kansas Geological Survey, Geohydrology
Placed on web March 1, 2015; originally published 1998.
Comments to webadmin@kgs.ku.edu
The URL for this page is http://www.kgs.ku.edu/Publications/Bulletins/229/05_param.html