![]()
Fluid Flow Characteristics of Core
by Floyd Preston
An analysis of routine core analysis data from the No. 1 Beaumeister well revealed a relation between porosity and permeability that is characteristic of the sands of the Dakota Group.
Experimental Procedure
Samples were taken at depths between 2,036 and 2,472 feet in all beds that contained sand. Cores 5/8 inch in diameter and 1 inch long were cut from the larger well cores with a diamond drill using water as a lubricant. The cores were oven dried at 115°C for two hours. All core samples were taken perpendicular to the axis of the well core samples.
Effective porosity of the samples was determined as the ratio of pore volume to bulk volume. Bulk volume was calculated from measurements of core length and diameter. Pore volume was taken as the volume of water necessary to saturate the core completely. Complete saturation was obtained by evacuating the air from the cores in a closed container and subsequently covering the cores with water. The volume of water saturating the cores was determined from the water density and the gain in core weight by saturation.
Permeability was determined by use of air at pressures only slightly above atmospheric pressure. No correction was made for the Klinkenberg effect. Air flow rate was measured by stopwatch and wet-test positive displacement gas meter. For the permeability tests, the cores were sealed into circular aluminum rings 1 1/8 inch inside diameter by use of Cerrobend, a heavy-metal alloy melting at 170°F. This mounting permitted air to flow through the core in the direction of coring of the small samples.
Effective porosity, expressed as percent, and air permeability in millidarcys are presented in Table 9.
Table 9—Porosity and permeability data for the Dakota Group in the Guy F. Atkinson No. 1 Beaumeister well.
| Sample number |
Depth, feet |
Effective porosity, percent |
Permeability, millidarcys |
Stratigraphic unit |
|---|---|---|---|---|
| 1 | 2,036 | 6.8 | 432 | Gurley |
| 2 | 2,039 1/2 | 33.8 | 543 | Gurley |
| 3 | 2,077 | 16.6 | 133 | Gurley |
| 4 | 2,082 | 25.8 | 1,070 | Gurley |
| 5 | 2,085 | 26.0 | 1,120 | Gurley |
| 6 | 2,088 | 25.7 | 615 | Gurley |
| 7 | 2,095 1/2 | 20.1 | 86 | Gurley |
| 8 | 2,104 | 20.4 | 230 | Gurley |
| 9 | 2,106 | 22.1 | 292 | Gurley |
| 10 | 2,109 | 19.0 | 307 | Gurley |
| 11 | 2,112 | 24.4 | 1,510 | Gurley |
| 12 | 2,129 | 25.1 | 2,120 | Huntsman |
| 13 | 2,235 | 18.8 | 460 | Cruise |
| 14 | 2,238 | 4.4 | 31 | Cruise |
| 15 | 2,239 | 21.9 | 283 | Cruise |
| 16 | 2,243 | 21.6 | 193 | Cruise |
| 17 | 2,244 | 20.7 | 134 | Cruise |
| 18 | 2,256 | 22.7 | 186 | Cruise |
| 19 | 2,259 | 24.8 | 812 | Cruise |
| 20 | 2,263 | 24.7 | 1,750 | Cruise |
| 21 | 2,265 | 27.2 | 1,800 | Cruise |
| 22 | 2,266 | 27.7 | 1,000 | Cruise |
| 23 | 2,267 | 27.2 | 1,065 | Cruise |
| 24 | 2,268 | 27.6 | 1,330 | Cruise |
| 25 | 2,269 | 22.1 | 527 | Cruise |
| 26 | 2,270 | 24.4 | 235 | Cruise |
| 27 | 2,271 | 19.7 | 67.5 | Cruise |
| 28 | 2,273 | 27.1 | 711 | Cruise |
| 29 | 2,274 | 27.8 | 1,630 | Cruise |
| 30 | 2,275 | 26.5 | 1,280 | Cruise |
| 31 | 2,276 | 27.4 | 1,275 | Cruise |
| 32 | 2,277 | 26.3 | 747 | Cruise |
| 33 | 2,278 | 26.7 | 1,510 | Cruise |
| 34 | 2,279 | 27.3 | 2,150 | Cruise |
| 35 | 2,280 | 27.0 | 1,680 | Cruise |
| 36 | 2,281 | 27.7 | 2,170 | Cruise |
| 37 | 2,282 | 24.8 | 1,980 | Cruise |
| 38 | 2,283 | 26.9 | 1,250 | Cruise |
| 39 | 2,284 | 26.1 | 2,380 | Cruise |
| 40 | 2,285 | 25.1 | 1,720 | Cruise |
| 41 | 2,286 | 26.3 | 1,810 | Cruise |
| 42 | 2,287 | 25.3 | 1,770 | Cruise |
| 43 | 2,288 | 26.5 | 1,390 | Cruise |
| 44 | 2,289 | 27.2 | 1,560 | Cruise |
| 45 | 2,290 | 26.8 | 1,410 | Cruise |
| 46 | 2,291 | 26.8 | 1,620 | Cruise |
| 47 | 2,292 | 25.9 | 1,620 | Cruise |
| 48 | 2,293 | 26.7 | 1,750 | Cruise |
| 49 | 2,294 | 24.7 | 1,750 | Cruise |
| 50 | 2,295 | 26.5 | 1,390 | Cruise |
| 51 | 2,296 | 26.7 | 1,400 | Cruise |
| 52 | 2,297 | 26.8 | 1,680 | Cruise |
| 53 | 2,298 | 23.3 | 1,650 | Cruise |
| 54 | 2,299 | 28.0 | 1,275 | Cruise |
| 55 | 2,300 | 27.7 | 2,690 | Cruise |
| 56 | 2,301 | 27.3 | 2,270 | Cruise |
| 57 | 2,302 | 27.3 | 2,450 | Cruise |
| 58 | 2,303 | 30.0 | 1,550 | Cruise |
| 59 | 2,304 | 25.0 | 1,820 | Cruise |
| 60 | 2,305 | 21.8 | 1,450 | Cruise |
| 61 | 2,306 | 25.6 | 2,290 | Cruise |
| 62 | 2,421 | 1:9.7 | 687 | Cheyenne |
| 63 | 2,424 | 19.8 | 980 | Cheyenne |
| 64 | 2,437 | 24.2 | 308 | Cheyenne |
| 65 | 2,439 | 25.4 | 564 | Cheyenne |
| 66 | 2,440 | 25.1 | 1,580 | Cheyenne |
| 67 | 2,441 | 27.7 | 1,240 | Cheyenne |
| 68 | 2,442 | 25.5 | 750 | Cheyenne |
| 69 | 2,457 | 22.1 | 1,670 | Cheyenne |
| 70 | 2,458 | 21.6 | 301 | Cheyenne |
| 71 | 2,463 | 22.2 | 302 | Cheyenne |
| 72 | 2,464 | 22.2 | 1,270 | Cheyenne |
| 73 | 2,465 | 23.3 | 620 | Cheyenne |
| 74 | 2,466 | 25.4 | 673 | Cheyenne |
| 75 | 2,467 | 24.7 | 1,000 | Cheyenne |
| 76 | 2,468 | 25.1 | 1,270 | Cheyenne |
| 77 | 2,469 | 23.7 | 650 | Cheyenne |
| 78 | 2,470 | 23.7 | 1,030 | Cheyenne |
| 79 | 2,471 | 23.5 | 678 | Cheyenne |
| 80 | 2,472 | 24.0 | 750 | Cheyenne |
Porosity-Permeability Analysis
A frequent representation of a porosity-permeability correlation is that of a straight line on log-log paper (Muskat, 1949, p. 168). The equation for this line is:
φ = AKb (1)
which may also be expressed as:
log φ = log A+b log K (2)
A least squares fit to the line of equation (1) was found by use of the following substitutions:
log φ = Y (3)
log K = X
log A = a
b=b
Use of the relation (3) with equation (2) yields:
Y = a + bX (4)
The intercept, a, and the slope, b, for the line represented by equation (4) were found from the following standard equations of least squares (Youden, 1951, p. 40-49)
a = [∑X2∑Y - ∑X∑XY] / [n∑X2 - (∑X)2] (5)
b = [n∑XY - ∑X∑Y] / [n∑X2 - (∑X)2] (6)
The term n is the number of data points (Xi, Yi), and all summations are for n terms.
An approximate measure of the precision of the data is the standard deviation S (or alternately the variance, S2), which is obtainable from the equation:
S2 = Sum of squares of deviations / Degrees of freedom (7)
S2 = ∑Y2 - {[∑XY - ∑X∑Y / n]2 / [∑X2 - (∑X)2 / n]} (8)
The measures of precision for the intercept and slope are the standard deviation of the intercept, Sa, and the standard deviation of the slope, Sb, obtainable from the following relations:
Sa2 = S2∑X2 / n∑X2 - (∑X)2 (9)
Sb2 = S2 / {∑X2 - [(∑X)2 / n]} (10)
Equations 5, 6, 8, 9, and 10 were coded for a digital computer (IBM 650) using the Bell Telephone Laboratories interpretative routine.
The straight line constants of equation (4) were computed for each group of porosity-permeability data listed in Table 9. The statistical parameters S, Sa, and Sb were also determined. Computation for each group required approximately 30 seconds of machine time. Calculated results for a, b, S, Sa, and Sb are given in Table 10.
Table 10—Statistical analysis of porosity-permeability curves.
| Stratigraphic unit |
Intercept, a |
Slope, b |
Statistical parameters | ||
|---|---|---|---|---|---|
| S | Sa | Sb | |||
| Gurley | 0.981 | 0.145 | 0.0683 | 0.146 | 0.0552 |
| Cruise | 1.145 | .086 | .0300 | .0374 | .0122 |
| Cheyenne | 1.286 | .030 | .0383 | .115 | .0399 |
| All groups | 1.111 | .095 | .395 | .0367 | .0124 |
The interpretation for the terms Sa and Sb are as follows: the data for porosity and permeability are regarded as a single sampling of an infinite population. If this sampling is repeated a large number of times, then approximately two thirds of the values for a, found by equation 5, will be within the limits a ± Sa. The same interpretation is to be applied to Sb. The value of (a) will be within the limits a ± Sa for about 95 percent of the samples.
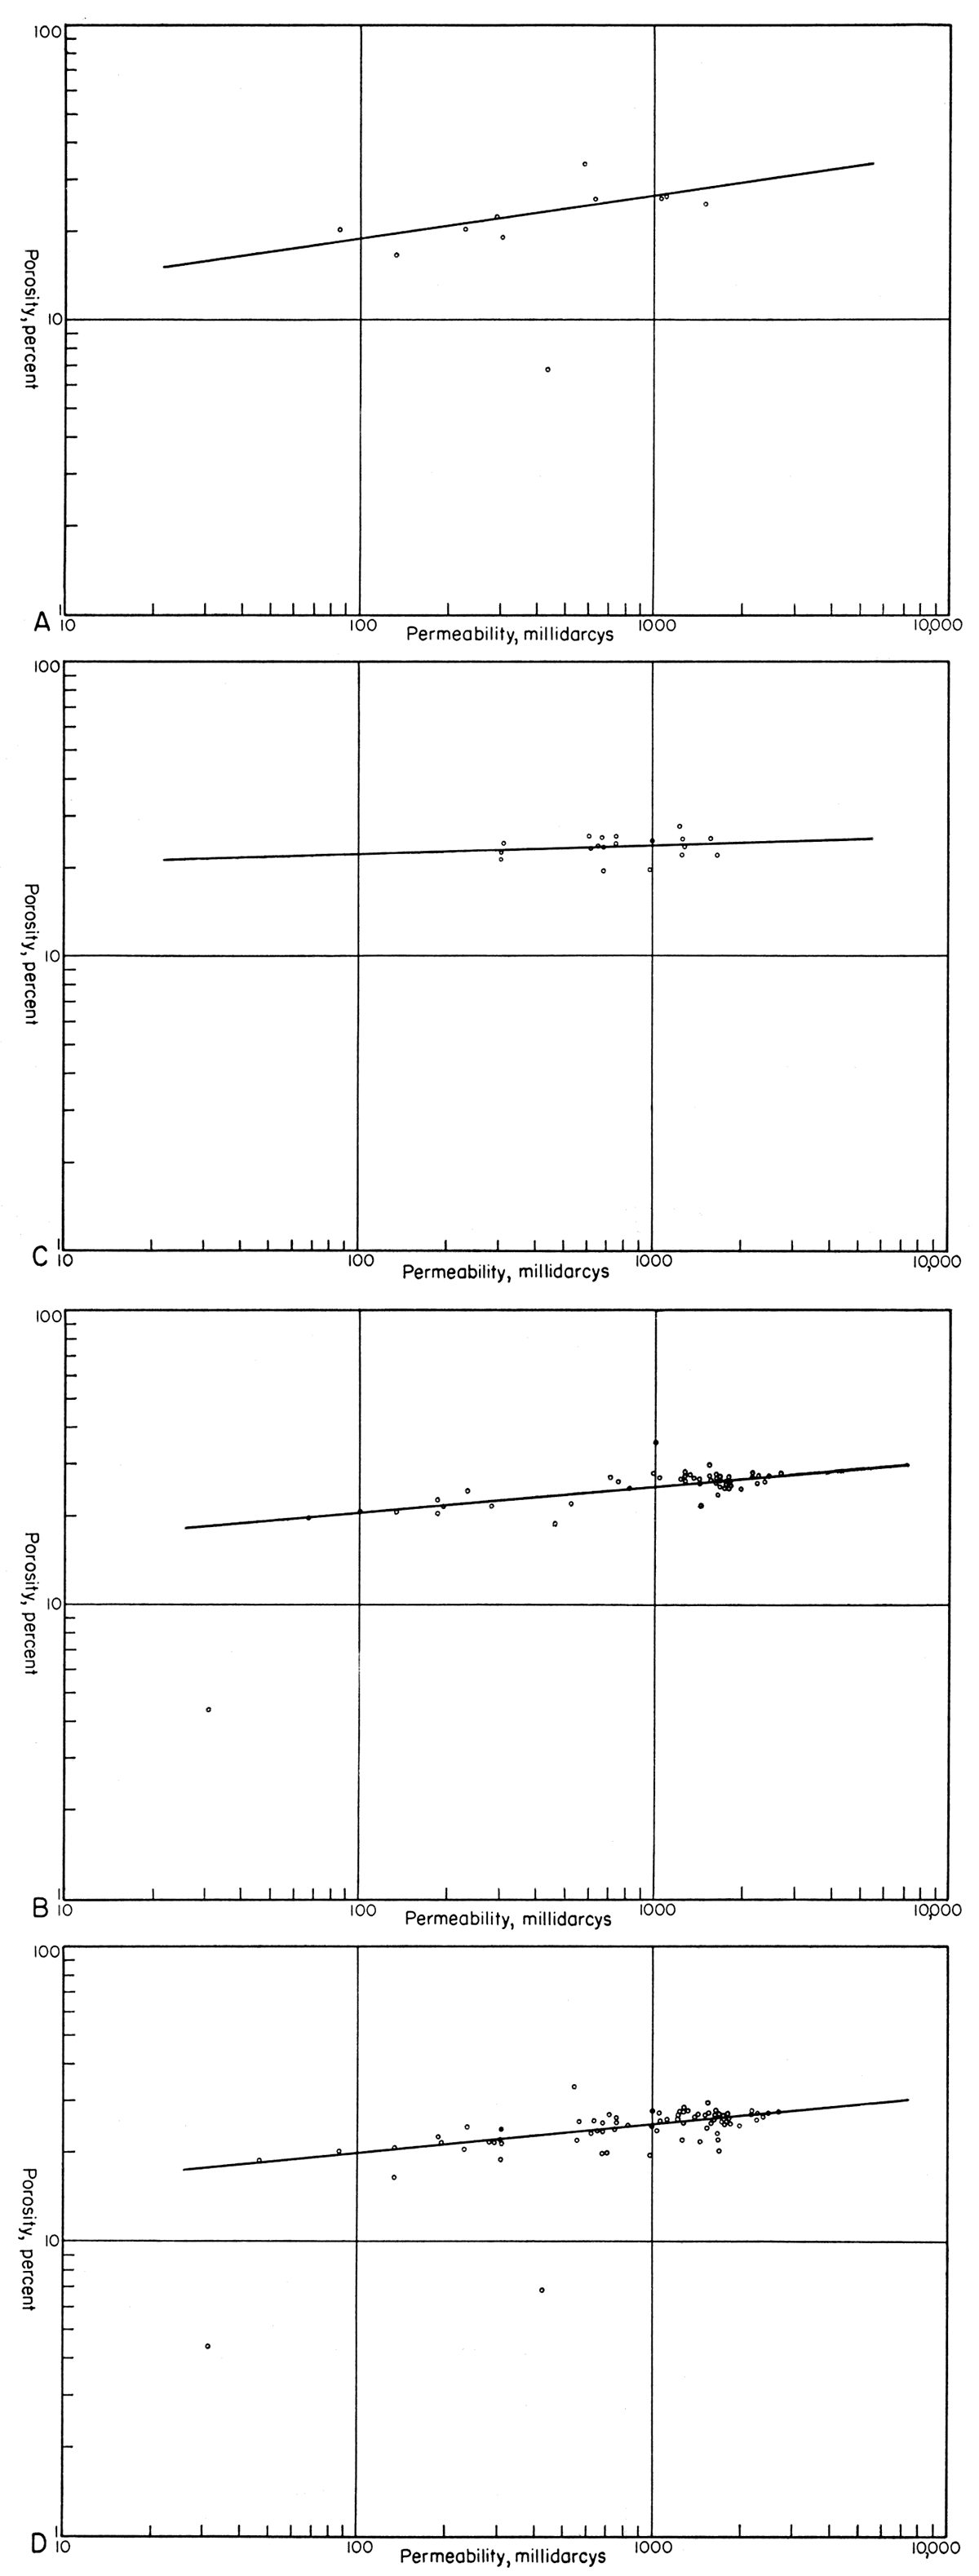
The curves of Figure 12 and the data of Table 10 can be used to determine the range of permeability to be expected from a sample having a given permeability. The curves also serve to illustrate the lithologic similarity of all members of the Dakota Group. The actual statistical identity of the porosity-permeability relations for all stratigraphic units could not be tested without an extensive mathematical analysis of the data.
Figure 12—Porosity-permeability relation of No. 1 Beaumeister well (A) Gurley Sandstone, (B) Cruise Sandstone, (C) Cheyenne Sandstone, and (D) Dakota Group.
Core Analysis Data
Table 11 contains data made available by the Guy F. Atkinson Company. The measurements of water saturation reflect gravity drainage from the cores prior to saturation determination. Such behavior is to be expected from cores of high permeability.
Table 11—Core analysis data: Guy F. Atkinson Company No. 1 Beaumeister, Cheyenne County, Kansas.
| Sample no. |
Depth, feet |
Vertical permeability, millidarcys |
Horizontal permeability, millidarcys |
Porosity, percent |
Residual saturation, percent of pore space |
|
|---|---|---|---|---|---|---|
| Oil | Water | |||||
| 1 | 2033.9 | 13 | 111 | 25.0 | 0.0 | 48.0 |
| 2 | 2079.2 | 467 | 214 | 27.3 | 0.0 | 53.8 |
| 3 | 2080.7 | 377 | 183 | 28.5 | 0.0 | 63.1 |
| 4 | 2085.7 | 390 | 298 | 31.5 | 0.0 | 63.4 |
| 5 | 2087.5 | 13 | 54 | 25.7 | 2.3 | 54.1 |
| 6 | 2088.9 | 153 | 139 | 28.7 | 0.0 | 54.4 |
| 7 | 2090.7 | 5.1 | 148 | 26.4 | 3.0 | 37.1 |
| 8 | 2098.6 | 18 | 7.5 | 22.4 | 0.0 | 45.1 |
| 9 | 2102.6 | 26 | 7.7 | 21.1 | 3.3 | 45.5 |
| 10 | 2103.7 | 119 | 19 | 23.9 | 2.9 | 35.1 |
| 11 | 2104.6 | 113 | 211 | 29.5 | 2.4 | 36.3 |
| 12 | 2106.7 | 788 | 357 | 30.0 | 0.0 | 43.3 |
| 13 | 2112.8 | 140 | 214 | 30.3 | 0.0 | 35.0 |
| 14 | 2195.6 | 270 | 69 | 31.6 | 0.0 | 61.4 |
| 15 | 2196.5 | 21 | 222 | 29.3 | 0.0 | 72.0 |
| 16 | 2197.6 | 5.8 | 6.4 | 14.5 | 0.0 | 90.3 |
| 17 | 2198.5 | 362 | 74 | 30.0 | 0.0 | 65.0 |
| 18 | 2199.3 | 172 | 88 | 30.2 | 0.0 | 37.7 |
| 19 | 2257.5 | 137 | 560 | 30.2 | 0.0 | 66.9 |
| 20 | 2258.4 | 320 | 521 | 31.3 | 2.2 | 56.9 |
| 21 | 2259.4 | 234 | 283 | 30.6 | 2.3 | 50.0 |
| 22 | 2260.5 | 183 | 410 | 32.3 | 0.0 | 62.5 |
| 23 | 2261.7 | 295 | 377 | 29.5 | 0.0 | 41.7 |
| 24 | 2262.9 | 833 | 585 | 32.4 | 0.0 | 62.9 |
| 25 | 2263.6 | 893 | 710 | 33.8 | 0.0 | 57.1 |
| 26 | 2264.3 | 637 | 710 | 33.3 | 0.0 | 58.5 |
| 27 | 2265.7 | 507 | 666 | 34.3 | 0.0 | 47.2 |
| 28 | 2266.4 | 580 | 370 | 33.0 | 0.0 | 64.5 |
| 29 | 2269.7 | 48 | 140 | 31.5 | 0.0 | 65.7 |
| 30 | 2270.4 | 580 | 580 | 3404 | 0.0 | 61.3 |
| 31 | 2271.3 | 88 | 140 | 29.5 | 0.0 | 48.5 |
| 32 | 2272.7 | 64 | 200 | 30.6 | 0.0 | 51.6 |
| 33 | 2273.6 | 630 | 1456 | 33.6 | 0.0 | 61.3 |
| 34 | 2274.5 | 157 | 468 | 34.6 | 0.0 | 65.0 |
| 35 | 2275.4 | 660 | 585 | 35.8 | 0.0 | 52.8 |
| 36 | 2276.6 | 950 | 914 | 35.3 | 0.0 | 50.1 |
| 37 | 2277.6 | 729 | 787 | 34.5 | 0.0 | 53.6 |
| 38 | 2278.6 | 414 | 183 | 32.0 | 0.0 | 58.7 |
| 39 | 2279.5 | 378 | 383 | 32.8 | 0.0 | 58.2 |
| 40 | 2283.6 | 747 | 570 | 32.8 | 0.0 | 63.4 |
| 41 | 2285.5 | 606 | 276 | 29.8 | 0.0 | 63.7 |
| 42 | 2288.7 | 1017 | 596 | 32.9 | 0.0 | 52.0 |
| 43 | 2290.7 | 660 | 760 | 33.2 | 0.0 | 58.1 |
| 44 | 2293.6 | 534 | 528 | 31.3 | 0.0 | 63.6 |
| 45 | 2298.5 | 846 | 787 | 34.5 | 0.0 | 57.7 |
| 46 | 2302.7 | 883 | 815 | 35.5 | 0.0 | 62.8 |
| 47 | 2304.6 | 998 | 740 | 35.8 | 0.0 | 57.3 |
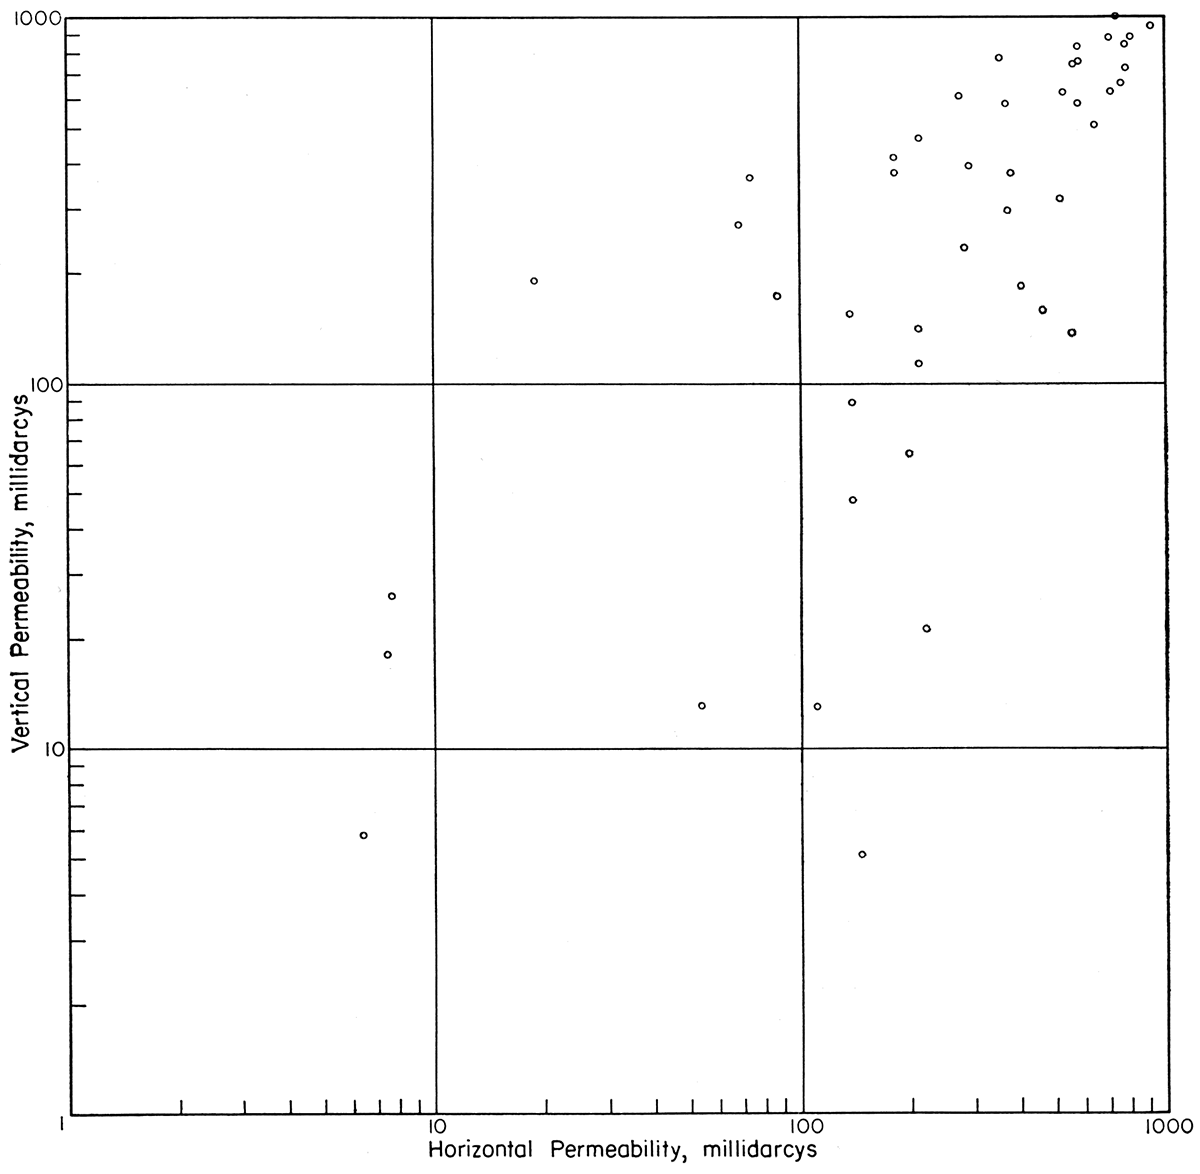
An analysis of the data for horizontal versus vertical permeability data revealed that, at the percent confidence limit, there is no statistical difference in permeability in the vertical and horizontal directions for short core samples. Thus, both high and low vertical permeabilities are found with equal frequency for a given horizontal permeability. The regression line, or straight line through the data of Figure 13, was found to be:
log Kv = a + b log Kh
a = 0.338 ± 0.280
b = 0.841 ± 0.115
where Kv and Kh are respectively the vertical and horizontal permeabilities in millidarcys. The uncertainties in a and b are the standard deviations of these terms.
It is quite conceivable that a much different relation would be found if cores one to several feet in length were studied. The presence of thin shale lenses or zones of heavy cementation would effectively reduce vertical permeability but would not influence greatly the horizontal permeability.
Figure 13—Horizontal and vertical permeability of Dakota sands from No. 1 Beaumeister well.
Summary
By Daniel F. Merriam, Paul C. Franks, and Norman Plummer
This well in Cheyenne County is isolated as a result of (1) complex lithologic changes between it and the well-known outcrop area on the east in central Kansas, (2) absence of information in extreme eastern Colorado on the west, (3) poor exposures and lack of detailed studies to the south, and (4) absence of information to the north where these rocks are buried by a cover of younger deposits. Correlation of stratigraphic units with areas where information is available is difficult because of the great distances involved. Certainly much additional work on the Dakota Group, both surface and subsurface, is necessary. It is hoped that this report will serve as a reference for future studies in the area.
Thicknesses—Thickness of the Pierre Shale is 1,120 feet in the No. 1 Beaumeister well. Regionally the formation is beveled at the top; hence thicknesses may differ radically within short distances. James D. Bishop observed a possible fault zone in the core between 1,040 and 1,060 feet, near the base of the Pierre Shale. Numerous small normal faults have been reported in northwestern Kansas, and where found in the subsurface most of these affect the upper part of the Niobrara Formation or lower part of the Pierre Shale. The Niobrara Formation is 520 feet thick. This thickness is fairly close to what would be expected (Lee and Merriam, 1954, p. 18). The Carlile Shale is 240 feet thick; average thickness in the region is about 200 feet. The Greenhorn Limestone is 85 feet thick and the Graneros Shale 59 feet. A thickness of 274 feet for the Omadi Formation conforms to the regional thickness of the formation as shown in Figure 2A. The same is true for the Kiowa Shale, which is about 111 feet thick (Fig. 2B), and the Cheyenne Sandstone, which is about 170 feet thick (Fig. 2C). Thickness of the Morrison Formation is 305 feet, which agrees with an isopachous map published by Merriam (1955).
Post-Dakota lithologic units—The post-Dakota stratigraphic units encountered in the No. 1 Beaumeister well are lithologically similar to the same units in other parts of western Kansas. The Pierre, a dark-gray noncalcareous shale containing fragments of Inoceramus and other fossil shells, is easily recognized. The Niobrara Formation, which is a mottled gray calcareous shale containing numerous fragments of Inoceramus, may be identified with little difficulty in samples. The Fort Hays member of the Niobrara is characterized by white chalky limestone and abundant microfossils, of which Globigerina is most common. Many thin light-bluish-gray bentonite beds occur in the Pierre and Niobrara formations. The Carlile Shale and its three members are easily differentiated; the Codell at the top is actually more of a siltstone than a sandstone; the Blue Hill is dark gray, noncalcareous, pyritic, and fossiliferous; and the Fairport at the base is a medium-gray to dark-gray shale mottled white. At the top of the Fairport member is a thin white limestone, which is persistent over much of western Kansas. The Greenhorn Limestone is light gray and hard. The Graneros Shale is dark gray and locally contains abundant Globigerina. Bentonite also is prominent in the Carlile, Greenhorn, and. Graneros formations, as are Inoceramus fragments. A 2-foot bentonite bed cored at a depth of 2,000 to 2,002 feet is thought to be the "Bentonite marker bed" that is easily traced regionally on electric logs.
Dakota lithologic units—Rocks of the Omadi Formation bear little resemblance to the Dakota Formation, which occupies the stratigraphic interval between the Kiowa and Graneros shales at the outcrop in central Kansas. Glauconite, which is common in sandstone of the Omadi Formation, is sparse or absent in the Dakota Formation. Swineford and Williams (1945, p. 116), however, have reported a zone of calcite-cemented glauconitic sandstone about 50 feet above the base in the Dakota Formation in southwestern Russell County. Well-cemented Dakota sandstone like that described by Swineford (1947) was not observed in the core. Siderite "pellets", which are found extensively on the outcrop of the Dakota Formation, are sparse in the core of the Cruise member of the Omadi Formation.
The mudstone sequence in the Cruise member between depths of 2,190 and 2,234 feet bears some similarity to the Janssen member and to the basal part of the Terra Cotta member of the Dakota Formation. Both the mudstone sequence and the Janssen Clay member contain bedded coaly material near the top (Plummer and Romary, 1942, p. 336); both units are composed of very dark gray mudstone and siltstone near the top; clays from both units fire buff (Plummer and Romary, 1947); both units contain siderite "pellets", although the "pellets" are sparse in the Cruise and abundant in the Dakota; and the kaolinite-illite ratio in the mudstone sequence of the Cruise is somewhat greater than that in the other members of the Omadi Forposed of very dark gray mudstone and siltstone near the top; mation just as it is greater in the Janssen Clay. It should be noted, however, that the ratio of kaolinite to illite is much greater in the Janssen Clay member of the Dakota Formation than it is in any part of the Omadi Formation (Plummer and others, 1954, p. 171-193).
The firing tests allowed easier differentiation of unlike claymineral assemblages than did either x-ray diffraction or differential thermal analysis, and accordingly allowed easier differentiation of the mudstone sequence in the Cruise, .because the firing operation is much simpler and much faster.
The small number of samples of Cheyenne Sandstone examined in connection with the petrographic, x-ray, and differential thermal studies indicate that the Cheyenne Sandstone cored in the Guy F. Atkinson No. 1 Beaumeister well is similar in gross lithology (except for the clay fraction) to Cheyenne Sandstone from other parts of Kansas (Latta, 1941, p. 70; Swineford and Williams, 1945, p. 121; Nixon, Runnels, and Kulstad, 1950, p. 52). The same also is true of the Graneros and Kiowa Shales (Plummer and Romary, 1942, p. 320-347).
Pre-Dakota lithologic units—Pre-Dakota rock units in the well are likewise similar in lithology to pre-Dakota units in other parts of western Kansas. The Morrison Formation consists principally of light-green or other pastel shades of soft sandy shale containing various amounts of limestone, sandstone, chert, and anhyrdite. Morrison rocks cored at a depth of 2,800 to 2,827 feet include part of the chert zone described by Ogden (1954) and Merriam (1955). Top of the Permian redbeds is difficult to place exactly, because the upper part of the redbeds sequence commonly is leached so that the rocks appear very light red or darker brown. Shales of these colors are easily confused with the pastel Morrison shales. The leached zone, which probably represents a weathered zone, is about 30 feet thick in the No. 1 Beaumeister well.
Stratigraphic boundaries—Stratigraphic boundaries of the different post-Dakota and pre-Dakota formations in the No. 1 Beaumeister well are sharp. The Cheyenne-Kiowa and KiowaOmadi contacts also are sharp, but differentiation of the members of the Omadi Formation . on lithology alone presents a more difficult problem. For example, the mudstone sequence in the Cruise Sandstone member is lithologically more easily recognizable than the Huntsman Shale member, whereas on electric logs the Huntsman is distinct in northwestern Kansas. The electrical characteristics of the Huntsman Shale seemingly are easier to recognize than the lithology of the unit. There seems to be no key or marker bed in the Omadi Formation that can be traced for long-distance correlation.
Only two recognizable breaks occur in the stratigraphic section in the No. 1 Beaumeister well that suggest interruption in sedimentation followed by weathering and perhaps erosion. One of these breaks is that at the top of the Permian redbeds, where the upper part of the sequence seemingly has been leached as in a weathered zone. The other interruption occurs at the top of the Cheyenne Sandstone, where seemingly the formation of montmorillonite-like clay at the expense of illite suggests erosion and weathering prior to deposition of the Kiowa Shale. An interruption in sedimentation is indicated at the Omadi-Graneros contact; lithology changes from predominantly sandstone (Omadi Formation) to mainly shale (Graneros Shale); clay-mineral composition of interbedded shales in the Omadi Formation is different from clay-mineral composition of the Graneros Shale.
Paleontology—It is unfortunate that none of the fossils found in the Dakota core are diagnostic, index forms. Because the organisms range through the Cretaceous, and even farther than that, they offer no information useful for placement of the Comanchean-Gulfian boundary, which falls somewhere between the Kiowa and Graneros Shales.
Environment of deposition—Seemingly a larger proportion of the Dakota Group is marine in northwestern Kansas than on the outcrop farther east and south. The Graneros and Kiowa Shales are marine in the subsurface as on the outcrop. The Graneros Shale in the No. 1 Beaumeister contains not only invertebrate fossils (foraminifers, pelecypods, and cephalopods) but an abundance of fish teeth and scales. Spores also are present, but they probably were transported to the sea from relatively nearby land areas. The Kiowa Shale contains fish scales, in addition to brachiopods, pelecypods, and foraminifers.
In south-central Kansas the Cheyenne Sandstone, judged to be of nonmarine origin deposited on or near the strand line of a northward-advancing sea, contains abundant fossil land plants (Latta, 1946, p. 238, 241). In the No. 1 Beaumeister well the present of Valvulineria, pelecypods, illite, and glauconite would seem to indicate that in northwestern Kansas at least part of this formation is marine.
No fossils were found in either the Gurley or Huntsman members of the Omadi Formation. Pelecypods, brachiopods, and fish teeth and scales indicate that the Cruise member was deposited at least in part under marine conditions. Illitic clay is generally believed to be formed (or preserved) under marine conditions; hence its relative abundance in the Omadi Formation seemingly would indicate that at least some of these beds are marine. Glauconite, found in the sandstones, is thought to be formed under marine conditions. Spores in the Cruise member probably were transported from adjacent land areas. Although fossil assemblages, abundance of illite, and presence of glauconite and collophane indicate that most beds of the Omadi Formation in the No. 1 Beaumeister well were deposited mainly in marine and perhaps brackish-water environments, it also is possible that some of the rocks may have been deposited under nonmarine conditions. In contrast, the outcropping Dakota rocks are judged to be nonmarine on the basis of the clay mineralogy and the absence of marine fossils (Plummer and Romary, 1947).
Economic possibilities—A study of the No. 1 Beaumeister well has revealed that Cretaceous rocks in this area are chiefly marine. For the most part the Omadi Formation is a good reservoir rock, as indicated by the extremely high porosity and permeability encountered by the No. 1 Beaumeister well. Although core analyses indicate much water in the Omadi Formation in the well, some oil was noted. The Graneros Shale, as well as the shale in the Omadi itself, affords good cover rock. Structural and stratigraphic conditions seemingly are favorable for the accumulation of oil. Although the Omadi beds occupy a geological setting similar to that of beds that produce commercial quantites of petroleum farther west in Colorado, nevertheless this similarity provides no assurance that commercial quantites of petroleum are present in the Cretaceous rocks of Kansas.
References
Bergman, D. W. (1949) The Greenhorn Limestone in Kansas: Kansas State Coll. unpub. thesis, Manhattan, Kansas, p. 1-72.
Boreing, M. J. (1953) Geology of the Denver Basin: Proc. 3rd Subsurface Geol. Symp., Oklahoma Univ., Norman, p. 72-81.
Condra, G. E., and Reed, E. C. (1943) The geological section of Nebraska: Nebraska Geol. Survey Bull. 14, p. 1-82.
Elias, M. K. (1931) The geology of Wallace County, Kansas: Kansas Geol. Survey Bull. 18, p. 1-254. [available online]
Fentress, G. H. (1955) Little Beaver field, Colorado, a stratigraphic, structural, and sedimentation problem: Am. Assoc. Petroleum Geologists Bull., v. 39, p. 155-188.
Finley, E. A., Dobbin, C. E., and Richardson, E. E. (1955) Preliminary structure contour map of the Colorado Plains: U. S. Geol. Survey, Oil and Gas Invest. Map OM 176. [available online]
Frye, J. C., and Leonard, A. B. (1952) Pleistocene geology of Kansas: Kansas Geol. Survey Bull. 99, p. 1-230. [available online]
Frye, J. C., Leonard, A. B., and Swineford, Ada (1956) Stratigraphy of the Ogallala Formation (Neogene) of northern Kansas: Kansas Geol. Survey Bull. 118, p. 1-92. [available online]
Grim, R. E. (1953) Clay mineralogy: McGraw-Hill Book Co., New York, p.1-384.
Jewett, J. M. (1951) Geologic structures in Kansas: Kansas Geol. Survey Bull. 90, pt. 6, p. 105-172. [available online]
Kerr, P. F., and Kulp, J. L. (1948) Multiple differential thermal analysis: Am. Mineralogist, v. 33, no. 7, 8, p. 3l!7-419.
Krumbein, W. C. (1941) Measurement and geological significance of shape and roundness of sedimentary particles: Jour. Sed. Petrology, v. 11, p. 64-72.
Latta, B. F. (1941) Geology and ground-water resources of Stanton County, Kansas: Kansas Geol. Survey Bull. 37, p. 1-119.
Latta, B. F. (1946) Cretaceous stratigraphy of the Belvidere area, Kiowa County, Kansas: Kansas Geol. Survey Bull. 64, pt. 6, p. 217-260. [available online]
Lee, Wallace, and Merriam, D. F. (1954) Preliminary study of the structure of western Kansas: Kansas Geol. Survey Oil and Gas Invest. 11, p. 1-23. [available online]
MacKenzie, R. E. (1957) Differential thermal investigation of clays. Mineralog. Soc., London, p. 1-456.
MacQuown, W. C., and Millikan, W. E. (1955) Little Beaver, Badger Creek, Middlemist field area, Colorado: Am. Assoc. Petroleum Geologists Bull., v. 39, p. 630-648.
McCoy, A. W., III (1953) Tectonic history of Denver Basin: Am. Assoc. Petroleum Geologists Bull., v. 37, p. 1873-1893.
McKee, E. D., and Weir, G. W. (1953) Terminology for stratification and cross-stratification in sedimentary rocks: Geol. Soc. America Bull., v. 64, p. 381-389.
Merriam, D. F. (1955) Jurassic rocks in Kansas: Am. Assoc. Petroleum Geologists Bull., v. 39, p. 31-46.
Merriam, D. F.(1955a) Notes on the Ogallala Formation of western Kansas: Kansas Geol. Soc. Guidebook, 18th Field Conf., p. 66-73.
Merriam, D. F. (1957) Subsurface correlation and stratigraphic relation of rocks of Mesozoic age in Kansas: Kansas Geol. Survey Oil and Gas Invest. 14, p. 1-25. [available online]
Merriam, D. F. (1958) Cretaceous possibilities good for northwest Kansas: The Oil and Gas Jour., v. 56, no. 13, p.138-139, 142.
Merriam, D. F., and Frye, J. C. (1954) Additional studies of the Cenozoic of western Kansas: Kansas Geol. Survey Bull. 109, pt. 4, p. 49-64. [available online]
Moore, R. C., and others (1951) The Kansas rock column: Kansas Geol. Survey Bull. 89, p. 1-132. [available online]
Moore, R. C., and others (1952) Graphic column of Kansas rocks: Kansas Geo!. Survey, chart.
Murray, H. H. (1954) Clay minerals in Pennsylvanian shales: Clays and Clay Minerals, Nat'l. Acad. Sci., Nat'l. Research Council Pub. 327, p. 47-66.
Muskat, Morris (1949) Physical principles of oil production: McGraw-Hill Book Co., New York, p. 1-922.
Nixon, E. K., Runnels, R T., and Kulstad, R O. (1950) The Cheyenne Sandstone of Barber, Comanche, and Kiowa Counties, Kansas, as raw material for glass manufacture: Kansas Geol. Survey Bull. 86, pt. 3, p. 41-84. [available online]
Ogden, Lawrence (1954) Rocky Mountain Jurassic time surface: Am. Assoc. Petroleum Geologists Bull., v. 38, p. 914-916.
Plummer, Norman, and Romary, J. F. (1942) Stratigraphy of the pre-Greenhorn Cretaceous beds of Kansas: Kansas Geol. Survey Bull. 41, pt. 9, p. 313-348. [available online]
Plummer, Norman, and Romary, J. F. (1947) Kansas clay, Dakota Formation: Kansas Geol. Survey Bull. 67, p. 1-241.
Plummer, Norman and others (1954) Chemical, petrographic, and ceramic properties of four clays from the Dakota Formation in Kansas: Kansas Geol. Survey Bull. 109, pt. 10, p. 157-216. [available online]
Prescott, G. C., Jr. (1953) Geology and ground-water resources of Cheyenne County, Kansas: Kansas Geol. Survey Bull. 100, p. 1-106. [available online]
Rocky Mountain Association of Geologists (1954) The oil and gas fields of Colorado, a symposium: Denver, Colorado, p. 1-302.
Silverman, S. R, Fuyat, R K., and Weiser, J. D. (1951) The quantitative determination of calcite associated with carbonate-bearing apatite: U. S. Geol. Survey, Prelim. Rept., TEI-118, p. 1-23. [available online]
Swineford, Ada (1947) Cemented sandstones of the Dakota and Kiowa formations in Kansas: Kansas Geol. Survey Bull. 70, pt. 4, p. 53-104. [available online]
Swineford, Ada, and Williams, H. L. (1945) The Cheyenne Sandstone and adjacent formations of a part of Russell County, Kansas: Kansas Geol. Survey Bull. 60, pt. 4, p. 101-168. [available online]
Weaver, C. E. (1956) The distribution and identification of mixed-layer clays in sedimentary rocks: Am. Mineralogist, v. 41, p. 202-221.
Youden, W. J. (1951) Statistical methods for chemists: John Wiley and Sons, Inc., p. 1-126.
Kansas Geological Survey, Geology
Placed on web July 27, 2017; originally published April 15, 1959.
Comments to webadmin@kgs.ku.edu
The URL for this page is http://www.kgs.ku.edu/Publications/Bulletins/134_1/06_fluid.html