Kansas Geological Survey, Bulletin 86, Part 3, originally published in 1950
Originally published in 1950 as Kansas Geological Survey Bulletin 86, Part 3. This is, in general, the original text as published. The information has not been updated.
This investigation was made cooperatively by the State Geological Survey and the Kansas Industrial Development Commission through the University of Kansas Research Foundation.
A study of samples of Cheyenne sandstone obtained from 12 drill holes in Barber, Comanche, and Kiowa counties, Kansas, was made to determine the usability of this sandstone as a raw material for glass manufacture. Metallurgical, chemical, and petrographic data were obtained. All data show that there are reserves, adequate for commercial operation, of sands that are amenable to standard methods of beneficiation and which have a chemical composition comparable to the recommended standards set up by the American Ceramic Society and the National Bureau of Standards.
The exploration and investigation of the Cheyenne sandstone deposits, to determine their possibilities as raw material for a glass industry, were carried out in 1949 by the State Geological Survey of Kansas in cooperation with the Kansas Industrial Development Commission acting through the University of Kansas Research Foundation. The glass-sand investigations reported here were integrated with foundry-sand studies by K. E. Rose (1950) and described in Geological Survey Bulletin 86, part 4.
Sand-dune areas of west-central Kansas and deposits along the larger streams of the State, especially the Kansas and Arkansas Rivers, offer adequate reserves of sand for road and building construction to supply local demand. However, existence of silica sand suitable for glassmaking and foundry uses, including synthetic sand, had not been proved within the State previous to this investigation. Most silica sand used in Kansas has come either from the Ottawa, Illinois, area or from the vicinity of St. Louis, Missouri. A small quantity has come from Arkansas and from the Arbuckle Mountain region of Oklahoma.
Glass has not been manufactured in Kansas on a large scale since the early days of this century when there was an abundance of cheap natural gas in the southeastern part of the State. Then, silica sand was imported. At present, Missouri and Oklahoma have substantial glass industries producing both flat glass and containers; but Kansas, so far lacking developed resources of raw materials--mainly silica sand--has been producing only fiberglass products and glass specialties, the latter in modest plants. With ample reserves of natural gas for plant fuel, and with increasing markets within the State, Kansas has felt the need of an integrated glass industry. The present investigation was prompted largely by this need.
To satisfy users of silica sand, especially the glass industry, the raw material must meet two general requirements: the content of silica (SiO2) must be very high, commonly more than 95 percent; and the impurities, chiefly iron oxide, must be very low. Optimum grain size is between 20 and 100 mesh, although a considerable amount of minus 100-mesh material is tolerated. The trend seems to be toward using sand of finer average grain size to obtain quicker melting and better fuel efficiency (Tyler, 1950).
Most of the silica sand consumed by the American glass industry is beneficiated by some metallurgical means to improve its quality before it is used. Hence, analyses of the raw sand, represented by exploratory drill hole samples, do not correspond closely with analyses of the treated sand ready to go into the glass batch. Table 1, showing analyses of treated material (Ries, 1949, p. 973), may be used as a general guide for classifying glass sands according to iron oxide (Fe2O3) content.
Table 1--Specifications for chemical composition of glass sand (Ries, 1949, p. 973). Recommended by American Ceramic Society and National Bureau of Standards. Percentage composition based on ignited samples.
| Qualities | SiO2 minimum |
Al2O3 maximum |
Fe2O3 maximum |
CaO+MgO maximum |
|---|---|---|---|---|
| First quality, optical glass | 99.8 | 0.1 | 0.02 | 0.1 |
| Second quality, flint glass containers and tableware | 98.5 | 0.5 | 0.035 | 0.2 |
| Third quality, flint glass | 95.0 | 4.0 | 0.035 | 0.5 |
| Fourth quality, sheet glass, rolled and polished plate | 98.5 | 0.5 | 0.06 | 0.5 |
| Fifth quality, sheet glass, rolled and polished plate | 95.0 | 4.0 | 0.06 | 0.5 |
| Sixth quality, green glass containers and window glass | 98.0 | 0.5 | 0.3 | 0.5 |
| Seventh quality, green glass | 95.0 | 4.0 | 0.3 | 0.5 |
| Eighth quality, amber glass containers | 98.0 | 0.5 | 1.0 | 0.5 |
| Ninth quality, amber | 95.0 | 4.0 | 1.0 | 0.5 |
Table 1, although rather widely quoted, may be slightly misleading to the layman. It is the custom of glass manufacturers to demand a silica sand of very high quality in order to compensate for the unavoidable addition of iron during manufacture. When starting with high grade raw materials, a plant is less restricted as to type of its finished products.
Iron oxide, yielding amber, yellow, or green tints in the finished glass, is regarded as the chief impurity in silica sand. A small amount of alumina may be an advantage; lime, magnesia, and alkalies usually are desired in a glass sand. Manganese, cadmium, cobalt, copper, chromium, selenium, iron, and certain other metallic oxides and compounds may be used as additives in controlled amounts to impart desired colors or characteristics in the finished glass, but commonly they are undesirable in the raw material.
A commercial deposit of glass sand, then, is likely to be a bed of reasonably soft sandstone, having adequate tonnage of easily minable rock, well located for transportation to centers of population, and having suitable grain size and chemical composition (or amenability to economic treatment). Most of the glass sand being used in this country comes from such sandstone deposits.
Scouting trips to investigate likely looking sand exposures near White Sand schoolhouse in western Barber County were first made by Norman Plummer and Earl K. Nixon, of the State Geological Survey, and George B. Weeks, representative of the Kansas Industrial Development Commission, who suggested that the silica-sand investigation be made. Preliminary field reconnaissance and laboratory tests of the Cheyenne sandstone in the Barber-Comanche-Kiowa County area indicated existence of adequate reserves of good-quality silica sand.
Work in the field consisted of (1) detailed study to determine approximate vertical and lateral limits of the sandstone formation and its lithologic characteristics, (2) selection of appropriate locations for exploratory drill holes, (3) drilling 12 rotary holes to depths as much as 70 feet to explore the sand, and (4) collecting suitable samples, both from the drilling and from surface exposures, to use in laboratory investigations. Field work and drilling were supervised by Nixon. Kenneth Walters collected samples at the drill and assisted with surveying. Work on the samples in the Geological Survey laboratories consisted of chemical, metallurgical, petrographic, and physical tests. The chemical aspects of the study were done by Russell T. Runnels; petrographic, physical-test, and analytical data were assembled by Robert O. Kulstad; studies of processing and beneficiation of the sand were carried out by Frank W. Bowdish. A preliminary report was prepared by Nixon in June 1949,
The present investigation was brought to reality by the energetic work of Mr. George B. Weeks, western Kansas representative of the Kansas Industrial Development Commission. Special thanks are extended to the several ranchers and land owners in the area of the Cheyenne sandstone outcrop who gave permission to work on their lands and assisted the progress of the field work in other ways.
The area of Cheyenne sandstone covered by this investigation surrounds the common corner of Barber, Comanche, and Kiowa counties (Fig. 1). This point is near the south line of Kansas and about midway of the State east and west. Three towns, Sun City, in Barber County; Wilmore, in Comanche County; and Belvidere, in Kiowa County, form a triangle roughly 150 square miles in extent within which most of the sand deposits lie.
Figure 1--Map of a part of Barber, Comanche, and Kiowa counties, Kansas showing location of drill holes n the area of Cheyenne sandstone studied.
Exploration and mapping were done in Ts. 30 and 31 S., R. 16 W. and T. 31 S., R. 15 W.; reconnaissance work covered somewhat more territory. Because of the nature of the topography and local stream erosion, the most favorable areas for sand production are confined largely to the vicinity of actual sandstone exposure. This crenulated outcrop line, within the territory mapped, extends some 50 miles, so that numerous locations offer satisfactory operating conditions.
The locality studied is at the edge of the High Plains area of western Kansas, where the gently undulating upland to the northwest--the wheat country--gives way southeastward to rolling hills dissected by gulches and ravines which drain into the cultivated valley of Medicine Lodge River. The strikingly sculptured Gypsum Hills west of Medicine Lodge, representing mainly erosion of the (Permian) redbeds, form the eastern border of the area of Cheyenne sandstone covered by this report.
The only industry of importance in the vicinity is agriculture, although producing oil and gas fields lie within 6 or 8 miles of the middle of the sandstone area. The land is occupied mainly by large ranches, the wide prairies being used for cattle grazing, and the valleys being occupied by grain fields. Although the population is rather sparse--about 7 per square mile--it is believed that obtaining labor for a modest silica-sand operation constitutes no serious problem.
Transportation from the area to centers of population, mainly to the east and northeast, is good. A branch of the Santa Fe railroad, connecting directly with Wichita, passes through the outcrop area of the Cheyenne sandstone and offers daily freight and passenger service. On account of the favorable transportation aspect, the first five drill holes for exploration of the sand deposits were located at points within 1 mile of the railroad in the vicinity of Belvidere. Two highways, U.S. 54 to the north and U.S. 160 in the south, pass within a few miles of the sand deposits.
The climate of the region favors all-year plant and mine operation, possibly excepting a few days in winter when temperatures reach zero and when wind and snow conditions may be of blizzard proportions. Spring and autumn periods are pleasant, and summer hot weather is tempered by southwesterly winds.
Owners of land containing deposits of Cheyenne sandstone are mainly proprietors of large ranches who gave full cooperation during the sand exploration and who expressed pleasure at the possibility of developing local industry.
According to local residents, samples of the sandstone exposed near the White Sand schoolhouse, sec. 17, T. 31 S., R. 15 W., have been tested for glassmaking two or three times in the past 40 years, but results of the tests were never revealed.
Rocks of the Quaternary, Tertiary, Cretaceous, and Permian Systems are exposed within the area (Fig. 1). Quaternary alluvium is present in a narrow belt along Medicine Lodge River; the Tertiary is represented by the Ogallala formation, which caps the hilltops over much of the area. Three formations, the Dakota, Kiowa, and Cheyenne, all of Cretaceous age, and underlying redbeds belonging to the Permian System of Paleozoic age, occupy much of the area studied.
Only enough work of stratigraphic nature was done in the area to provide a basis for locating the exploratory drill holes at proper elevations. Contacts were followed out over considerable areas, but actual mapping of them was regarded as unnecessary for purposes of this investigation. As the stratigraphy of the Belvidere area and the lithology of the various units have been covered in detail by Latta (1946) only such data are given here as seem of value to one interested in possible development of the Cheyenne sandstone for commercial production of silica sand.
An account of the rocks exposed in the area investigated follows. The units are described in descending order.
Quaternary--Recent alluvium, found only in valley bottoms, is composed mainly of unconsolidated silt, sand, and mud, or soil derived from the erosion of the older rocks and unconsolidated sediment at higher elevations.
Tertiary--Next older in age is the Ogallala formation of Pliocene age, which consists of gravel, sand, silt, clay, and shale, with local developments of caliche. The prevailing colors are light buff, tan, pink, and gray in varied shades. Pebbles of igneous rocks quartzite, and limestone are common in the Ogallala within the area. The formation fills depressions and irregularities of an erosion surface cut in older rocks. This seems to have a relief of 100 feet, so Ogallala beds occur through a considerable vertical range.
Cretaceous--Below the Tertiary is the Dakota formation which is represented in the area mainly by thin shales and clays and a few patches of pinkish sandstone. The sandstones are hard, composed essentially of silica grains of medium size, and distinctly ferruginous. A patch of this sandstone in sec. 29, T. 31 S., R. 15 W. is represented by large pieces of a ledge which seems to have been approximately 3 feet thick but which has slumped to its present position as a result of erosion. Shale of the Dakota formation, which may occur in the area, was not investigated.
Two formations, the Kiowa shale and the Cheyenne sandstone, which underlie the Dakota formation and make up the Comanchean Series (Lower Cretaceous), are typically exposed in the vicinity of Belvidere (Pl. 2). Here the Kiowa shale forms hill slopes and rounded bluffs on both north and south sides of the Medicine Lodge River Valley. Although some sandy beds were noted, the Kiowa consists mainly of thin- and even-bedded clay shale ranging In color from light gray or buff through darker shades to nearly black. At or near the base of the Kiowa in most parts of the district are thin beds of highly fossiliferous limestone. One of these, named the Champion shell bed by Cragin (1895, p. 368), is regarded as the base of the Kiowa. This bed consists almost entirely of fossil shells, cemented by calcite into a resistant member which ranges from a few inches to 1 1/2 feet in thickness. Strata of the Kiowa and Cheyenne formations are conformable in dip.
Permian--Red, sandy, clayey, and gypsiferous shales and red silty clays of Permian age, commonly referred to as "redbeds," immediately underlie the Cheyenne sandstone. The contact between the two, marking an erosion interval at the end of Paleozoic and extending through much of Mesozoic time, can readily be identified where the boundary is exposed. The unconformity, everywhere present, is commonly marked by a thin layer of poorly cemented pebble conglomerate. As the amount of ferric oxide present in almost all parts of the Permian redbeds precludes their use as glass sand, no effort was made to examine carefully the rock sequences below the Cheyenne sandstone.
The Cheyenne sandstone, underlying the Kiowa shale, was named by Cragin (1889, p. 65) from Cheyenne Rock, a prominent escarpment of this formation on the north side of the Medicine Lodge Valley, about 0.75 mile west of Belvidere. The Cheyenne sandstone in the area studied consists of a sandy or clay shale upper unit and a lower sandstone unit containing local thin shale bands, but composed mainly of rather high-grade silica sand. Stratigraphic features are indicated in Figure 2. On this sketch, all 12 exploratory holes have been plotted, the base of the Cheyenne sandstone being shown as a horizontal line. Elevations of the holes have been disregarded. The separation of shale and sandstone is based on classification of drill samples made when the holes were being drilled, not on the basis of the chemical analyses.
Figure 2--Graphic logs of drill holes through the Cheyenne sandstone. Sand is shown by solid black pattern; shale and silt are shown by cross bar pattern. Percentages of Fe2O3 are shown to the right of each log.
Although the Champion shell bed marks the base of the Kiowa shale, the shaly unit lying below the shell bed and above the sandstone section of the Cheyenne looks much like Kiowa shale. Cragin (1895, pp. 366-367) divided the Cheyenne formation into two members: the shale-bearing "Elk Creek beds" above (sub~divided into the "Stokes sandstone" and the underlying "Lanphier beds"), and a lower member, the "Corral sandstone," which probably corresponds to the main sandstone unit shown in the 12 drill holes sketched in Figure 2.
The lower unit of the Cheyenne consists mainly of medium-grained, friable, highly cross-bedded sandstone, containing some thin bands of sandy or clay shale and lenses of conglomerate. Small amounts of clay, selenite crystals, and iron nodules occur locally in the formation. The color typically is buff to nearly white, but locally the presence of iron oxide and perhaps other impurities has given the rock various shades from yellow through red and brown to purple. Lighter colored zones are most common in the upper part of the formation. The grain size of the sandstone ranges from that of clay to fine gravel and consists of quartz grains associated with a very small amount of silt or clay. A given bed of the sandstone commonly shows good sorting of material, although the degree of sorting varies from one part of the formation to another and from one locality to another. Pebbles of pea size found in certain localities, such as in the vicinity of drill hole 6, as a rule are whiter than the sandstone matrix and consist of chert, calcium carbonate, and quartz. Commonly, the pebble conglomerate, where present, forms only a small part of the total thickness of the formation at any given place and occurs only at the base.
Bands of gray clay shale, a foot or two thick, which occur in the lower (sandstone) unit of the Cheyenne, can be observed along the outcrop of the formation in a pasture on the Rice Ranch, about 1 mile southwest of Belvidere. Bands of shale were penetrated in some of the drill holes. Seemingly, the shale bands are discontinuous laterally. The introduction of silt during deposition of the sandstone seems to have been confined to certain stages in the sedimentation, for upper and lower contacts of the thin shale bands are sharp. Since occurrence of shale bands complicates mining of silica sand, detailed investigation of any locality for possible sand operation should include drilling for the purpose of determining whether any interbedded shale is present, and if so, its position, nature, and extent.
Where the sandstone unit of the Cheyenne is exposed as in cut banks and along stream channels, especially where the normally overlying shale is absent, there seems to have been some concentration of iron oxide near the surface of the sandstone darkening the latter to a tan or brown color. At such points, the ferric oxide content of the rock commonly runs from 0.25 to 0.50 percent, or about twice as high as deeper in the formation.
Thickness--Drilling carried out in connection with this investigation shows the Cheyenne formation to have a maximum thickness of about 60 feet. Drill holes 2 and 3 were intentionally started in the lower part of the Kiowa shale. The sandstone unit of the Cheyenne, where cut in drill holes (omitting holes 9 and 12, which did not penetrate the full section), had an average thickness of 31 feet. Locally, erosion has removed part or all of the sandstone.
A mining thickness of 15 to 30 feet is adequate; localities offering such a thickness of satisfactory-grade silica sand should not be difficult to find.
Structure--The Cheyenne formation has so flat a dip in the Barber-Comanche-Kiowa area that no effort was made to map the structure. The average dip, normally westward, probably is less than 20 feet per mile. It is known that there are minor warps in the strata exposed at the surface in this part of the State--structures which are sought by oil men as favorable places to drill--but it is unlikely that any true dips of more than 1° or 2° can be found. In planning an open pit operation, a 1-foot contour map drawn on the key bed would be helpful in order to anticipate any drainage difficulties.
Origin--Latta (1946, p. 241), after considering the conclusions of various authors who have studied the Cheyenne formation in the Belvidere area, states: "The Cheyenne sandstone of Kansas is generally considered to be of continental origin and to have been deposited on or near the strand line of a northward advancing Comanchean sea."
Sand grains of minerals other than quartz may be considered impurities in any sandstone of high silica content which is being investigated for glass-sand possibilities. Both chemical and petrographic studies seemed essential for determining the mineralogical composition of the rock, especially the identity and nature of minor components which might cause trouble to an operator.
Detailed studies of samples from two drill holes, selected as representative, give sufficient petrographic information for purposes of the present report. For this purpose, drill hole 4 in Kiowa County and drill hole 10 in Barber County were chosen. Six samples from each hole were used.
Each sample was separated into 10 size fractions, 20, 28, 35, 48, 65, 80, 100, 150, and 250 mesh and pan, using Tyler U.S. standard screens. After screening for 10 minutes in a Ro-tap sieve shaker the resulting fractions were weighed. Table 2 shows results of analyses. The 20- and 100-mesh sieves are critical sizes.
It should be noted that in drill holes 10 and 4 a change in size distribution of the sand occurs with depth, the more favorable sizes being found in the lower part of the formation. The sand from drill hole 4 shows the greater change in size distribution from top to bottom. The sieve analysis indicates a greater thickness of more desirable sand than drill hole 10; however, the top of drill hole 4 contains a much higher percentage of fines than drill hole 10.
Sieve analyses of glass sands from the several localities, as reported by Ries (1949, p. 972) are presented in Table 3 to serve as a basis for comparison with the Cheyenne.
Table 2--Sieve analyses of samples from drill holes 4 and 10
| Drill hole |
Depth, feet |
Cumulative percent coarser than mesh | ||||||||
|---|---|---|---|---|---|---|---|---|---|---|
| 20 | 28 | 35 | 48 | 65 | 80 | 100 | 150 | 250 | ||
| 4 | 5-10 | 3.3 | 4.3 | 5.2 | 5.9 | 7.6 | 12.5 | 14.8 | 65.6 | 91.3 |
| 4 | 10-15 | .4 | .4 | .5 | 1.0 | 6.3 | 7.9 | 50.3 | 88.0 | 97.9 |
| 4 | 15-20 | .2 | .4 | .5 | .8 | 6.2 | 21.5 | 60.2 | 88.2 | 97.2 |
| 4 | 20-25 | .7 | .8 | 1.8 | 9.4 | 34.5 | 67.0 | 89.8 | 97.7 | 99.7 |
| 4 | 25-30 | 1.8 | 3.3 | 8.1 | 22.7 | 62.1 | 80.8 | 91.8 | 97.1 | 99.0 |
| 4 | 30-35 | 2.4 | 5.0 | 14.4 | 41.9 | 76.5 | 88.6 | 94.8 | 98.5 | 99.7 |
| 10 | 23-30 | 1.1 | 1.7 | 3.5 | 8.9 | 20.8 | 30.0 | 52.6 | 82.4 | 96.0 |
| 10 | 30-35 | lost | .6 | 4.3 | 17.7 | 40.7 | 54.3 | 70.7 | 87.1 | 91.5 |
| 10 | 35-40 | 0.9 | 1.4 | 3.3 | 15.6 | 49.9 | 67.1 | 81.1 | 95.3 | 99.2 |
| 10 | 40-45 | 0.2 | .4 | 1.3 | 5.8 | 25.9 | 45.6 | 73.8 | 95.2 | 99.4 |
| 10 | 45-50 | 0.8 | 2.3 | 7.7 | 25.1 | 48.5 | 62.8 | 82.6 | 96.7 | 99.3 |
| 10 | 50-54 | 1.6 | 3.6 | 12.4 | 39.9 | 74.1 | 84.9 | 93.0 | 98.1 | 99.9 |
Table 3--Sieve analyses of various American glass sands (Ries, 1949, p. 972).
| Locality from which sand was obtained | Cumulative percent coarser than mesh | |||||||
|---|---|---|---|---|---|---|---|---|
| 14 | 20 | 28 | 35 | 48 | 65 | 100 | 150 | |
| Williamstown Junction, New Jersey | 0 | 0.4 | 1.5 | 4.2 | 12.3 | 36.7 | 81.4 | 97.5 |
| South Vineland, New Jersey | 0 | 0.6 | 2.9 | 13.0 | 36.8 | 72.9 | 95.7 | 99.2 |
| Washed and tabled-locality not given | 0 | 1.1 | 6.3 | 23.0 | 52.9 | 84.5 | 98.6 | 99.8 |
| Ottawa, Illinois | 0 | 0.1 | 19.5 | 60.0 | 85.7 | 98.0 | 99.8 | |
| Dike, Nevada | 0 | 0.6 | 17.0 | 49.7 | 73.4 | 87.0 | 93.6 | |
| Mapleton, Pennsylvania | 0 | 0.1 | 3.3 | 20.3 | 62.9 | 90.3 | 97.5 | |
| Mapleton, Pennsylvania | 0 | 0.5 | 3.8 | 17.5 | 56.9 | 90.9 | 98.5 | |
| Berkley Springs, Virginia | 0 | 1.1 | 33.6 | 78.1 | 94.6 | 98.6 | ||
| Wedron, Illinois | 0.7 | 11.6 | 42.1 | 74.3 | 94.6 | 99.6 | ||
| Crystal City, Missouri | 0 | 0.1 | 2.9 | 23.1 | 51.3 | 70.1 | 90.6 | |
| Ottawa, Illinois | 0 | 3.4 | 30.5 | 65.0 | 82.1 | 92.9 | 98.2 | |
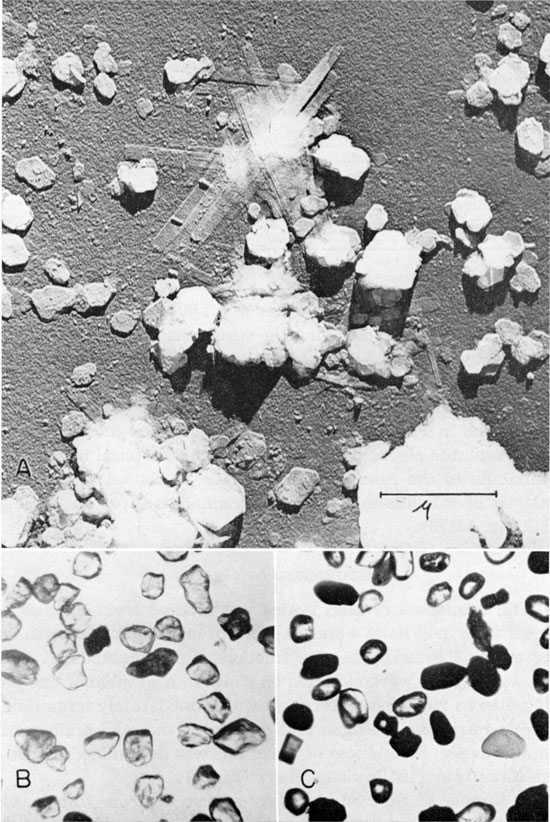
Matrix material of a sample of Cheyenne sandstone from a cut bank near drill hole 11 (lab. no. 50132) was studied by Ada Swineford. As some of the clay fraction probably was lost from drill samples when they were collected, a natural bank sample containing the clay fraction was used in investigating the less-than-1-micron size material. Material finer than 1 micron was prepared for observation with an electron microscope by mixing about 30 grams of sand with water in a 1,000-cc graduate and decanting the clay after allowing the suspension to settle.
According to Ada Swineford, 1.8 percent by weight of the channel sample has a grain size of less than 1 micron. Plate 1A is an electron micrograph of the less-than-1-micron fraction. The forms seen in Plate 1A are common in electron micrographs of many kaolinite clays. It is possible that this material may locally contribute to the case hardening of the sandstone. A chemical analysis of this less-than-1-micron fraction is given in Table 12 (lab. no. 50173).
Plate 1--A, Kaolinite flakes from the less-than-1-micron fraction of a channel sample of the Cheyenne sandstone. Electron micrograph by C. C. McMurtry, Department of Oncology, University of Kansas Medical School. Preparation was shadow cast with 175 A of chromium at an angle of 1:5 with the plane of the micrograph giving shadows 5 times the height of the particles; 15 A of aluminum was also deposited vertically. Magnification 21,000 X, B, Photomicrograph of quartz grains from the Cheyenne sandstone showing angularity of grains. Grain size minus 80 plus 150 mesh; grains mounted in a mixture of glycerine and water; plane polarized light; magnification 30 X. C, Photomicrograph of typical heavy mineral fraction from Cheyenne sandstone showing grains of zircon, tourmaline, staurolite, and opaque minerals. Grain size minus 150 plus 250 mesh; grains mounted in balsam; plane polarized light; magnification 60 X.
The roundness of sand grains was studied from samples selected from drill holes 4 and 10. Except for the plus 20 mesh and the minus 250 mesh, the size fractions were combined by twos. The sand grains were mounted on slides in a solution of one part glycerine to two parts water to provide a moderately large difference in refractive index, so that outlines of the sand grains could be seen easily. Roundness of the grains was determined by use of the Krumbein (1941) visual chart (Fig. 3).
Figure 3--Chart for visual determination of roundness (Krumbein, 1941).
A sample of St. Peter sandstone from Ottawa, Illinois, was separated into the same size fractions as used in analyzing samples of the Cheyenne sandstone. Studies of grain roundness of the St. Peter sandstone sample show that sand to have only slightly higher roundness values than those of the Cheyenne of Kansas (Fig. 4).
Figure 4--Histograms showing roundness values for different size fractions of selected samples of Cheyenne sandstone and roundness values of St. Peter sandstone.
Heavy and light minerals were separated by use of bromoform from all size fractions finer than 35 mesh; and a centrifuge was used in making the separations from the size fractions finer than 250 mesh. The percentage by weight of heavy minerals was calculated for each size fraction. A slide was made of each heavy-mineral separation. Except for the size fractions coarser than 20 mesh and finer than 250 mesh, the light minerals were combined by neighboring pairs of size fractions for preparing slides. In mounts containing enough material, 100 grains were counted and identified on each slide; only about 50 grains were counted on each slide of light minerals, however. The results of this count (Table 4) do not differ greatly from characters indicated by the petrographic study of the Cheyenne sandstone in Russell County by Swineford and Williams (1945).
Table 4--Mineralogy and percentage of heavy minerals in the Cheyenne sandstone.
| Size fraction, mesh | Percent heavy minerals, weight of size fraction | Mineral, percent by count of heavy minerals | Mineral, percent by count of light minerals | |||||||||||
|---|---|---|---|---|---|---|---|---|---|---|---|---|---|---|
| Brown, red, yellow, or gray opaques | Black or metallic opaques | Pyrite | Barite | Zircon | Staurolite | Tourmaline | Garnet | Rutile | Titanite | Epidote | Quartz | Quartz aggregates |
||
| Drill hole 4, 5-10 feet | ||||||||||||||
| -20+35 | 51 | 95 | ||||||||||||
| -35+48 | 0.60 | 65 | 25 | 5 | 5 | 702 | 30 | |||||||
| -48+65 | 0.20 | 90 | 5 | -5 | 5 | -5 | ||||||||
| -65+80 | 0.03 | 75 | 15 | 10 | -5 | 100 | ||||||||
| -80+100 | 0.21 | 70 | 15 | -5 | 5 | -5 | -5 | 10 | ||||||
| -100+150 | 0.03 | 55 | 15 | 5 | 5 | -5 | 25 | 1002 | ||||||
| -150+250 | 0.11 | 25 | 5 | 40 | -5 | 25 | tr | |||||||
| -250 | 1.52 | 35 | 15 | 5 | 30 | 5 | 10 | -5 | tr | 100 | ||||
| Drill hole 4, 10-15 feet | ||||||||||||||
| -20+35 | 30 | 70 | ||||||||||||
| -35+48 | 1.82 | 100 | tr | 100 | ||||||||||
| -48+65 | 0.02 | 95 | tr | tr | tr | |||||||||
| -65+80 | 0.11 | 80 | 10 | 5 | 5 | 100 | ||||||||
| -80+100 | 0.01 | 60 | tr | tr | tr | 30 | ||||||||
| -100+150 | 0.07 | 30 | 15 | 15 | 5 | 35 | 100 | |||||||
| -150+250 | 0.95 | 25 | 10 | 40 | 5 | 20 | tr | tr | ||||||
| -250 | 4.05 | 15 | -5 | 5 | 70 | tr | 5 | 5 | tr | 100 | ||||
| Drill hole 4, 15-20 feet | ||||||||||||||
| -20+35 | 35 | 65 | ||||||||||||
| -35+48 | 0.67 | 100 | 100 | |||||||||||
| -48+65 | 0.05 | 85 | 5 | 10 | ||||||||||
| -65+80 | 0.01 | 95 | 5 | tr | 100 | |||||||||
| -80+100 | 0.01 | 75 | 5 | -5 | -5 | 15 | ||||||||
| -100+150 | 0.01 | 55 | 10 | -5 | 5 | 5 | 20 | 100 | ||||||
| -150+250 | 0.46 | 25 | 20 | 30 | 10 | 15 | tr | |||||||
| -250 | 1.85 | 35 | 25 | 25 | 15 | tr | tr | 100 | ||||||
| Drill hole 4, 20-25 feet | ||||||||||||||
| -20+35 | 70 | 30 | ||||||||||||
| -35+48 | 0.06 | 90 | -5 | tr | 5 | tr | tr | |||||||
| -48+65 | 0.01 | 95 | 5 | 100 | ||||||||||
| -65+80 | 0.05 | 70 | 5 | 10 | -5 | tr | 10 | 100 | ||||||
| -80+100 | 0.02 | 75 | 10 | 5 | 5 | 5 | ||||||||
| -100+150 | 0.11 | 50 | 10 | 15 | 5 | 5 | 15 | 100 | ||||||
| -150+250 | 0.274 | 40 | 10 | 15 | 5 | 5 | tr | tr | ||||||
| -250 | 2.40 | 50 | tr | 30 | 5 | tr | 10 | tr | tr | 100 | ||||
| Drill hole 4, 25-30 feet | ||||||||||||||
| -20+35 | 95 | 5 | ||||||||||||
| -35+48 | 0.03 | 90 | 5 | 5 | tr | 1002 | ||||||||
| -48+65 | 0.02 | 80 | tr | 5 | 10 | -5 | ||||||||
| -65+80 | 0.02 | 70 | 5 | 10 | 10 | 5 | 100 | |||||||
| -80+100 | 0.04 | 40 | 15 | 30 | 15 | tr | ||||||||
| -100+150 | 0.19 | 60 | 5 | 5 | 5 | 15 | 10 | 1002 | ||||||
| -150+250 | 0.60 | 35 | 10 | 25 | 20 | 5 | 5 | tr | ||||||
| -250 | 5.21 | 35 | 5 | 50 | tr | tr | 10 | tr | tr | 100 | ||||
| Drill hole 4, 30-35 feet | ||||||||||||||
| -20+35 | 100 | |||||||||||||
| -35+48 | 0.03 | 90 | 10 | 100 | ||||||||||
| -48+65 | 0.02 | 95 | tr | 5 | tr | |||||||||
| -65+80 | 0.05 | 80 | 5 | -5 | tr | 5 | 5 | 1002 | ||||||
| -80+100 | 0.13 | 65 | -5 | tr | 5 | 20 | 5 | tr | ||||||
| -100+150 | 0.31 | 85 | -5 | -5 | tr | 5 | 5 | 100 | ||||||
| -150+250 | 3.45 | 65 | tr | tr | 5 | 20 | 5 | |||||||
| -250 | 1.28 | 80 | 10 | 10 | tr | 100 | ||||||||
| Drill hole 10, 23-30 feet | ||||||||||||||
| -20+35 | 100 | |||||||||||||
| -35+48 | 0.04 | 95 | tr | tr | tr | tr | 100 | |||||||
| -48+65 | 0.01 | 100 | ||||||||||||
| -65+80 | 0.02 | 90 | tr | 5 | 5 | 1002 | ||||||||
| -80+100 | 0.02 | 90 | tr | -5 | tr | tr | 10 | tr | ||||||
| -100+150 | 75 | 5 | tr | 5 | 15 | tr | 1002 | |||||||
| -150+250 | 0.10 | 50 | tr | tr | 5 | tr | 45 | |||||||
| -250 | 2.62 | 60 | 25 | 15 | tr | tr | 1002,3 | |||||||
| Drill hole 10, 30-35 feet | ||||||||||||||
| -20+35 | 100 | |||||||||||||
| -35+48 | 0.02 | 90 | 10 | tr | 100 | |||||||||
| -48+65 | 0.04 | 75 | 10 | 15 | tr | tr | tr | |||||||
| -65+80 | 0.03 | 60 | 10 | 5 | tr | 15 | 5 | 1002 | ||||||
| -80+100 | 0.04 | 55 | 10 | 5 | 10 | 10 | 10 | tr | tr | |||||
| -100+150 | 0.10 | 40 | 15 | 5 | 5 | 10 | 20 | 1002 | ||||||
| -150+250 | 0.36 | 30 | 15 | tr | 30 | tr | 20 | tr | ||||||
| -250 | 1.25 | 50 | tr | 15 | tr | 30 | 1002 | |||||||
| Drill hole 10, 35-40 feet | ||||||||||||||
| -20+35 | 100 | |||||||||||||
| -35+48 | 0.03 | 100 | tr | 1002 | ||||||||||
| -48+65 | 0.03 | 85 | 10 | -5 | -5 | |||||||||
| -65+80 | 0.04 | 65 | 10 | 5 | tr | 10 | 10 | 75 | 1002 | |||||
| -80+100 | 0.10 | 50 | 20 | 5 | 5 | 15 | -5 | -5 | tr | |||||
| -100+150 | 0.15 | 35 | 20 | 10 | 10 | 10 | 15 | tr | tr | 1002 | ||||
| -150+250 | 0.86 | 30 | 15 | tr | 30 | 5 | 20 | tr | tr | tr | ||||
| -250 | 1.25 | 30 | 5 | 40 | 20 | tr | 1002 | |||||||
| Drill hole 10, 40-45 feet | ||||||||||||||
| -20+35 | 100 | |||||||||||||
| -35+48 | 0.07 | 95 | tr | 5 | tr | 1002 | ||||||||
| -48+65 | 0.02 | 75 | 15 | tr | tr | 5 | -5 | |||||||
| -65+80 | 0.02 | 75 | 10 | -5 | 5 | 5 | -5 | 1002 | ||||||
| -80+100 | 0.03 | 55 | 15 | tr | tr | 20 | 5 | tr | ||||||
| -100+150 | 0.07 | 40 | 15 | 5 | 5 | 10 | 25 | tr | tr | 1002 | ||||
| -150+250 | 0.54 | 25 | 20 | tr | -5 | 30 | -5 | 15 | -5 | -5 | ||||
| -250 | 1.58 | 35 | 10 | 10 | 25 | tr | 15 | tr | 5 | tr | tr | 1002 | ||
| Drill hole 10, 45-50 feet | ||||||||||||||
| -20+35 | 1002 | |||||||||||||
| -35+48 | 0.06 | 85 | 5 | 5 | tr | tr | 1002 | |||||||
| -48+65 | 0.06 | 85 | 5 | 5 | 5 | -5 | ||||||||
| -65+80 | 0.05 | 65 | 30 | -5 | tr | -5 | tr | 1002 | ||||||
| -80+100 | 0.02 | 65 | 15 | -5 | 5 | 5 | 10 | tr | tr | tr | ||||
| -100+150 | 0.16 | 45 | 30 | 5 | 75 | 20 | tr | tr | tr | 1002 | ||||
| -150+250 | 1.02 | 25 | 25 | 5 | 30 | tr | 10 | tr | tr | tr | ||||
| -250 | 3.13 | 55 | 10 | 5 | 20 | 5 | tr | tr | tr | 1002 | ||||
| Drill hole 10, 50-54 feet | ||||||||||||||
| -20+35 | 1002 | |||||||||||||
| -35+48 | 0.02 | 95 | tr | tr | tr | tr | 1002 | |||||||
| -48+65 | 0.02 | 90 | -5 | -5 | -5 | tr | tr | tr | ||||||
| -65+80 | 0.03 | 80 | 15 | tr | 5 | tr | 1002 | |||||||
| -80+100 | 0.09 | 65 | 20 | 5 | tr | 10 | tr | tr | ||||||
| -100+150 | 0.20 | 45 | 25 | tr | -5 | 10 | 15 | tr | tr | 1002 | ||||
| -150+250 | 0.65 | 45 | 25 | tr | 20 | 5 | 5 | tr | ||||||
| -250 | 2.24 | 55 | 10 | tr | tr | 20 | 5 | 5 | tr | 1002 | ||||
| 1Trace microcline. 2Trace chert. 3Trace albite. |
||||||||||||||
The light minerals are almost entirely quartz. Because of minute inclusions, some quartz grains are cloudy, whereas others are clear. Gradation between clearest and cloudiest grains is observed, and therefore no consistent count of proportions of these types could be made. The coarser fractions show a higher percentage of cloudy grains than the finer fractions. Usual methods of beneficiation cannot clean the sand of impurities included within the quartz grains. Plate 1B is a photomicrograph of the quartz grains.
The minerals identified in the heavy-mineral separation are black, brown, red, yellow, and gray opaque minerals; pyrite; barite; zircon; staurolite, tourmaline; garnet; rutile; titanite; and epidote. Plate 1C is a photomicrograph of some of the heavy minerals.
In studying the opaque minerals, no attempt was made to, separate brown, red, yellow, and gray opaques, since the individual grains show a continuous gradation in color, and most grains are not the same color all over. In general, the opaque minerals are more yellow in the samples from drill hole 4 and more red or brown in samples from drill hole 10. It is probable that opaque grains of these colors are a combination of hematite, limonite, and leucoxene, and that some are alteration products of ilmenite. Therefore, the black opaques are probably ilmenite, at least in part. Some of the opaques are obviously detrital, whereas others seem to have been deposited after the sand grains. The heavy-mineral separations from coarser fractions show abundant quartz grains cemented with brown or red opaque material. Pyrite, recognized by its color, occurs as euhedral crystals. It is not found throughout the entire section penetrated by the holes. This fact is substantiated by chemical analyses which show only minute amounts of sulfide. The opaque minerals generally are angular in the coarser size fractions but rather rounded in finer sizes,
Barite is found both as euhedral and subhedral crystals and in very irregular grains. The latter, in many samples, have the shape of interstitial spaces between the sand grains. The barite grains commonly contain many carbonaceous inclusions, and some grains are quite cloudy. These characteristics suggest that the barite is secondary in origin. For the most part the barite grains vary widely in size.
The zircons, which generally are clear and colorless, less commonly pink and purple, show zoning in some grains. Most of the grains are round, but some retain their original crystal outlines. Zircon is more abundant in the finer fractions.
Staurolite commonly occurs in clear yellow or gold-colored grains. Most of it has a hackly appearance, the grains having saw-tooth edges. Staurolite has a rather even distribution throughout the various size fractions, but is found to be more abundant in some zones than others.
Tourmaline occurs in a variety of colors, including black, brown, green, blue, and red, both as well-rounded and as somewhat angular grains. Tourmaline grains are more abundant in the finer sizes, except for the minus-250-mesh size where they are few.
Garnet, ranging in color from red to colorless, is not abundant in the samples from either test hole, but it occurs in greater amounts in samples from drill hole 10. The surfaces of the grains show conchoidal fracture.
Rutile was recognized in only small amounts. It occurs generally in reddish-brown, rounded, elongate grains. Some of the unidentified brown and red opaque minerals may be rutile.
Titanite in relatively small amounts occurs in well-rounded or wedge-shaped grains.
Epidote is found only in two samples from drill hole 10. It occurs in rounded grains and shows its typical yellowish-green color.
Because the iron content of surface samples of the sandstone from cut banks and ravines seems to be higher than average, testing to obtain fresh rock material at depth was judged necessary. Test pits were impractical because of their cost. Drill locations were selected (1) in the area south of Belvidere, where the sand exposures were nearest to rail transportation; (2) in western Barber County, where high-quality material was noted in road cuts; and (3) in eastern Comanche County, where a deep cut bank exposes a promising section of the sandstone. Most of the drill-holes were located at points where the sand section of the Cheyenne formation was covered by a shale bed, on the theory that at such places there is less likelihood of iron-oxide infiltration from surface waters.
Drill holes were put down by a rotary rig, using a fishtail bit making a hole about 6 inches in diameter. In order to obtain uncontaminated samples from beds to be tested, casing was set in every hole so as to exclude soil and surface material. Clean, fresh water was pumped down through the drill stem to lubricate the cutting bit and to bring up samples. No sludge pit or rerun water was used. The fluid carrying sample cuttings from each hole was conveyed into a sludge box about 2 feet wide, 2 feet deep, and 6 feet long. The drill was stopped, a sample taken, and the sludge box carefully cleaned when changes in the formation (by color of the sludge) were noted, so that the material being drilled at any given depth could be classified more reliably. A sample interval of 5 feet was used except when it seemed desirable to change the interval on account of changing formations.
Since the materials drilled consist largely of unconsolidated surface material, soft shale, or rather poorly cemented sandstone, the speed of the drill had to be reduced substantially in order to permit collecting and bagging of the samples. Rotation of the drill in the open hole doubtless caused some caving of soft material. Therefore, some contamination of samples probably is unavoidable. In view of the precautions taken, however, the samples obtained are judged to be sufficiently accurate to justify the conclusions reached.
Figure 2 indicates that most of the samples immediately beneath shale bands contain more ferric oxide than expected. Obviously, the effect of any contamination of a sample caused by use of a rotary drill in an open hole leads to a slightly higher iron content in composite samples. Under these circumstances, conclusions reached as to iron content of the samples should be conservative--that is, higher than actual.
Samples weighing 20 or 25 pounds, mostly from 5-foot intervals, were shipped in tight canvas bags directly to the Survey laboratories for testing.
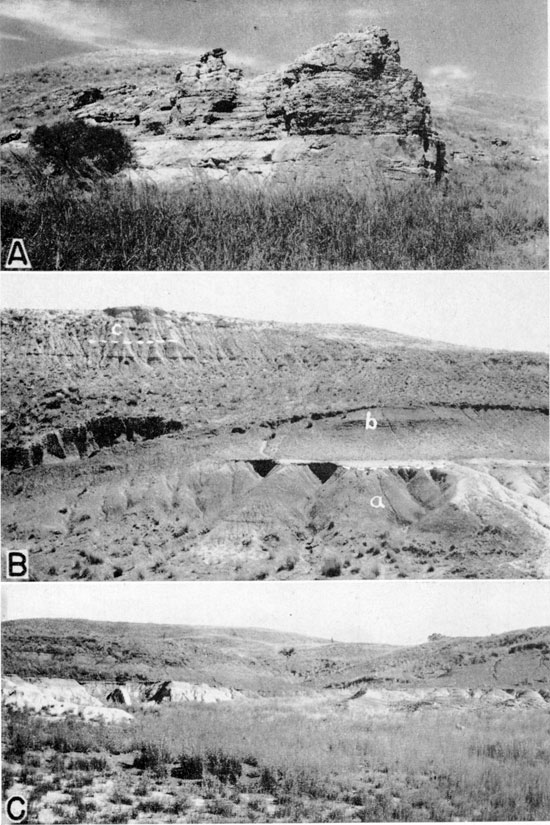
Plate 2--A, Prominent ledge of Cheyenne sandstone known as Cheyenne Rock, from which the Cheyenne received its name. Cheyenne-Permian contact is concealed by weeds in foreground. Kiowa shale forms rounded hill in background. North bluff of Medicine Lodge Valley about three-quarters of a mile west of Belvidere. B, Exposure of (a) Cheyenne sandstone, (b) Kiowa shale, and (c) Pleistocene deposits in the NE sec. 5, T. 30 S., R. 16 W., about 1 1/4 miles north of Belvidere. C, Cheyenne sandstone and Kiowa shale in Champion Draw. The thin bed in the middle of the picture is the shell-limestone (Champion shell bed) at the base of the Kiowa. Note how the top of the Cheyenne grades laterally from light-colored sandstone (at left) into dark-colored sandy shale (at right). Photos by B. F. Latta (1946, p. 236).
The samples collected in the field were first dried in a large, gas-fired drying oven, then reduced to proper size in a Jones sample splitter. Thus samples of each interval for all of the 12 holes were obtained. Small samples of each interval were retained separately, and composites of the sand section in the 12 holes were obtained. Small samples of each interval were retained separately, and composites of the sand section in the 12 holes were made up for various tests. A sample from each interval was weighed, then analyzed by using 20- and 100-mesh sieves and tapping for 3 minutes. The fractions retained on the screens and in the pan were weighed and stored. The sample retained on the 100-mesh screen was assayed for Fe2O3 (Table 5). All samples used, their laboratory numbers, and descriptions are shown in Table 6.
Large composites--one for the sand section in each drill hole--were scrubbed in a porcelain ball mill without pebbles until the water remained clear. The samples, decanted through a 200-mesh screen, were then ready for assay. The amount of scrubbing given the samples was intended only to simulate preliminary treatment in an actual silica sand operation. Undoubtedly the ferric oxide content of the sample could have been lowered further by additional treatment in the ball mill.
Table 5--Iron oxide (Fe2O3) content and percentages of over and undersized material in the sand sections.
| Drill hole no. |
Footage | Percent Fe2O3 in -20 to +100 mesh fraction |
Percent +20 mesh sand removed |
Percent -100 mesh removed |
|---|---|---|---|---|
| 1 | 11.5-46.5 | 0.238 | 0.96 | 9.60 |
| 2 | 9.5-20.01 | 0.324 | 1.88 | 26.89 |
| 31.0-63.0 3 | ||||
| 3 | 31.0-60.0 | 0.178 | 2.17 | 26.78 |
| 4 | 5.0-40.0 | 0.203 | 1.60 | 22.05 |
| 5 | 15.0-40.0 | 0.254 | 5.85 | 18.64 |
| 6 | 15.0-50.0 | 0.349 | 3.84 | 27.40 |
| 7 | 23.0-48.5 | 0.125 | 1.24 | 6.78 |
| 8 | 28.0-55.0 | 0.219 | 1.27 | 12.86 |
| 9 | 3.0-19.0 | 0.108 | 1.66 | 2.71 |
| 10 | 20.0-54.0 | 0.155 | 0.67 | 15.04 |
| 11 | 14.0-50.0 | 0.205 | 1.75 | 10.15 |
| 12 | 20.0-30.0 | * | (10.17)* | (16.28)* |
| Arithmetic average (omitting C-12) |
30.9** | 0.214 | 2.08 | 16.26 |
| *The sample from drill hole 12 was not used in the calculation of averages because it contains a considerable amount of iron scale from the drill tools and because the nature of the material indicates that it is probably noncommercial. **Average thickness of the sand sections sampled (omitting drill hole 12). |
||||
Table 6--Descriptions of samples used in the laboratory.
| Laboratory no. |
Description of sample |
|---|---|
| 4943-4949 | Seven sand samples from drill hole 1; passing 20- and retained on 100-mesh screens. |
| 4950-4960 | Eleven samples from drill hole 2, screened as above. |
| 4961-4966 | Six samples from drill hole 3, screened as above. |
| 4967-4973 | Seven samples from drill hole 4, screened as above. |
| 4974-4978 | Five samples from drill hole 5, screened as above. |
| 4979-4985 | Seven samples from drill hole 6, screened as above. |
| 4986-4990 | Five samples from drill hole 7, screened as above. |
| 4991-4995 | Five samples from drill hole 8, screened as above. |
| 4996-4998 | Three samples from drill hole 9, screened as above. |
| 4999-49105 | Seven samples from drill hole 10, screened as above. |
| 49106-49112 | Seven samples from drill hole 11, screened as above. |
| 49113-49114 | Two samples from drill hole 12, screened as above. |
| 49127 | Interval from 3 to 10 feet in drill hole 9; assayed for Fe2O3 laboratory flotation tests, screened as above. |
| 49128 | Same as 49127 except sample scrubbed before assay. |
| 49175 | Composite of holes 1-12; scrubbed, decanted through 200-mesh sieve. |
| 49184 | Same as 49175; procedure repeated for tabling experiment. |
| 49185 | Coarse light reject fraction from 49184. |
| 49186 | Coarse and fine concentrate from 49184. |
| 49187 | Black, heavy reject from 49184. |
| 49189 | Outcrop sample near drill hole 1; assayed for Fe2O3 on as received basis. |
| 49190 | Same as 49189 except scrubbed before assay. |
| 49195 | Table concentrate from Denver Equipment Company (original sample, 49207). |
| 49196 | Acid-leached table concentrate Denver Equipment Company (original sample, 49207). |
| 49197 | Nonmagnetic concentrate from The Exolon Company. |
| 49198 | Composite of holes 1 to 12, scrubbed; approximately equal to 49175; for The Exolon Company. |
| 49199 | First pass reject, The Exolon Company (original sample, 49198). |
| 49200 | Second pass reject, The Exolon Company (original sample, 49198). |
| 49201 | Third pass reject, The Exolon Company (original sample, 49198). |
| 49207 | Composite of holes 1 to 12, not scrubbed; original sand, Denver Equipment Company sample. |
| 49215 | Clean concentrate, laboratory flotation experiment; passing 20- and retained on 105-mesh screens, scrubbed (original sample, 49127). |
| 49216 | Flotation tailings from 49215. |
| 49217 | Clean concentrate, laboratory Rotation experiment (original sample, 49184). |
| 49218 | Reject from 49217. |
| 49219 | Flotation solution after 49217; assayed for Fe2O3. |
| 50132 | Outcrop near drill hole 11, channel sample, 30 feet; passing 24- and retained on 100-mesh screens; assayed for Fe2O3. Total analysis made. |
| 50133 | Fraction of 50132 passing 100-mesh screen. |
| 50139 | Composite of drill holes 1 to 6; fraction passing 100-mesh screen for total analysis. |
| 50140 | Fraction of 50139 passing 20- and retained on 100-mesh screens. |
| 50141 | Composite of drill holes 7 to 11; fraction passing 20- and retained on 100-mesh screens. |
An unwashed composite sample of all 12 drill holes was sent to the research laboratory of the Denver Equipment Company for preliminary testing. Results of their scrubbing and tabling tests are given in Table 7. Tabling treatment recovered 89.96 percent of the head sample, wasting 4.02 percent as slimes and 6.02 percent as heavy table concentrate, which would contain a high percentage of Fe2O3. In this test, scrubbing consisted of agitating the sample for 25 minutes in a pulp with water-to-sand ratio of 1:1. Leaching of the tabled product (lab. no. 49196, Table 8) by the Denver Equipment Company was with dilute hydrochloric acid solution. Results of acid-leaching tests on two other samples conducted in our laboratory are given also in Table 8. Flotation did not seem to be a desirable treatment for this sample.
Table 7--Tabling and scrubbing experiments by Denver Equipment Company.
| Sample no. | Percentage of material |
Fe2O3 assay | |
|---|---|---|---|
| 49207 | (Original) | 100.00 | 0.234 |
| 49195 | (Table concentrate) | 89.96 | 0.071 |
| Table waste | 6.02 | ||
| Waste slimes | 4.02 | ||
Table 8--Acid-leaching tests on selected samples.
| Lab. no. | Acid used | Strength of acid, wt. percent |
Time, hours |
Head assay, Fe2O3 |
Percent Fe2O3 removed |
Fe2O3 remaining, by difference |
|---|---|---|---|---|---|---|
| 49190 | hydrochloric | 10 | 3 | 0.082 | 0.064 | 0.018 |
| hydrochloric | 5 | 3 | 0.082 | 0.061 | 0.021 | |
| hydrochloric | 2.5 | 3 | 0.082 | 0.064 | 0.018 | |
| sulfuric | 10 | 3 | 0.082 | 0.062 | 0.020 | |
| sulfuric | 5 | 3 | 0.082 | 0.064 | 0.018 | |
| sulfuric | 2.5 | 3 | 0.082 | 0.036 | 0.046 | |
| hydrochloric | 10 | 1.5 | 0.082 | 0.063 | 0.019 | |
| hydrochloric | 5 | 1.5 | 0.082 | 0.055 | 0.027 | |
| hydrochloric | 2.5 | 1.5 | 0.082 | 0.034 | 0.048 | |
| sulfuric | 10 | 1.5 | 0.082 | 0.063 | 0.019 | |
| sulfuric | 5 | 1.5 | 0.082 | 0.033 | 0.049 | |
| sulfuric | 2.5 | 1.5 | 0.082 | 0.033 | 0.049 | |
| 49197 | hydrochloric | 10 | 1.5 | 0.048 | 0.033 | 0.015 |
| hydrochloric | 5 | 1.5 | 0.048 | 0.030 | 0.018 | |
| hydrochloric | 2.5 | 1.5 | 0.048 | 0.025 | 0.023 | |
| 49196 | hydrochloric | * | 3 | 0.071 | 0.052 | 0.019** |
| *Done by Denver Equipment Company; actual strength unknown. **Assayed for Fe2O3; percent ferric oxide removed is by difference. |
||||||
To determine the feasibility of high-intensity dry magnetic separation, a composite sample of the sand, after preliminary scrubbing in a laboratory ball mill without pebbles, was sent to the Exolon Company, Tonawanda, New York, for treatment. Results of this work are given in Table 9. By removal of 3 percent of the sample, the ferric oxide content was reduced by dry magnetic separation from 0.100 to 0.048 percent. A product of this quality approaches the quality of average prepared silica sand used in glass manufacture in this country.
Table 9--High-intensity magnetic separation by The Exolon Company.
| Sample no. | Percentage of material |
Fe2O3 assay |
|---|---|---|
| 49198 (Original) | 100.0 | 0.100 |
| 49199 (Reject) | 0.3 | 3.50 |
| 49200 (Reject) | 1.6 | 3.42 |
| 49201 (Reject) | 1.0 | 0.68 |
| 49197 (Concentrate) | 97.1 | 0.048 |
The product, thus reduced to 0.048 percent Fe2O3, was treated by dilute hydrochloric acid leaching, as shown in Table 8. In this manner, a further reduction of the ferric oxide from 0.048 to less than 0.02 percent was accomplished in 1% hours with dilute acid. A silica sand such as this having an Fe2O3) content of less than 0.02 percent, is suitable for making first quality optical glass. Additional leaching tests carried out on a representative sample of Cheyenne sandstone are tabulated (Table 8). If preparation of a commercial product is to include acid leaching, cost seems to be the deciding factor between hydrochloric and sulfuric acid.
Both tabling and flotation of Cheyenne sandstone samples were carried out by Frank W. Bowdish. The tabling, was done on a Wilfley-type laboratory apparatus. Flotation tests were made in a Fagergren 500-gram laboratory flotation cell. Mr. Bowdish used part of the general composite sample of drill holes 1-12 (lab. no. 49175), the Fe2O3 content of which was 0.130 percent. In the tabling test, the Fe2O3 was reduced only to 0.093 percent. Flotation tests on the same material, however, reduced the Fe2O3 content to 0.059 percent (Table 10). Seemingly, the effect of impact scrubbing in the flotation machine before reagents were added is favorable. Another flotation test by Mr. Bowdish on a sample of the sandstone from drill hole 9 gave better results than any of the metallurgical tests. In this test, with a sample running 0.105 percent Fe2O3, flotation gave a product running 0.025 percent Fe2O3. If this can be done in actual operation, it suggests a simple and cheap method of beneficiating the Cheyenne sandstone.
The various metallurgical tests show that any of the common methods for improving the grade of silica sands are applicable to the Cheyenne sandstone. The method or combination of methods selected by a prospective operator depends on the type product to be sold and on the nature of the sandstone at the locality selected for operations.
Table 10--Tabling and flotation tests on Cheyenne sandstone.
| Lab. no. | Weight, grams |
Weight distributions, percent |
Fe2O3 content, percent |
Iron distribution, percent |
|
|---|---|---|---|---|---|
| Tabling, composite 1-12 | |||||
| 49184 | Feed | 18,287 | 0.130 | ||
| 49187 | Heavy table concentrate | 467 | 2.71 | 0.88 | 19.00 |
| 49186 | Fine sand | 7,580 | 44.041 | 0.093 | 70.55 |
| Coarse sand | 8,840 | 51.32 | |||
| 49185 | Light reject concentrate | 333 | 1.93 | 0.68 | 10.45 |
| Total | 17,222 | 100.00 | 100.00 | ||
| (sand spilled) | 1,065 | ||||
| Flotation, composite 1-12 | |||||
| 49184 | Feed | 748.5 | 0.130 | ||
| 49218 | Float (reject) | 25.5 | 3.41 | 1.83 | 52.20 |
| 49217 | Cleaned sand | 723.0 | 96.59 | 0.059 | 47.80 |
| Total | 748.5 | 100.00 | 100.00 | ||
| Flotation, drill hole 9 | |||||
| 49127 | Feed | 0.105 | |||
| 49216 | Float (reject) | 1.03 | |||
| 49215 | Cleaned sand | 0.025 | |||
All chemical analyses for this investigation of the Cheyenne sandstone were made in the laboratories of the State Geological Survey. Since the average sandstone being investigated runs about 95 percent or more in silica:, and since alkalies and alumina are neither critical nor undesired constituents, most of the chemical work was directed to determinations of iron content. Iron is the chief undesirable impurity in glass sand.
The chemical analysis phase of the study is divided into two main parts: (1) assays for Fe2O3, and (2) total analyses of selected samples or metallurgical products. The assays were of two types: (1) regular grade assays of drill hole samples from the field, and (2) precise determinations of control grade of selected samples, composites, and metallurgical products.
Samples of about 100 grams were split from the originals, then quartered. A 5-gram sample was weighed from this quartered fraction. The weighed portions, without further grinding, were then fused with an excess of sodium carbonate. Fine grinding was omitted because it could not be performed without contamination of iron from the muller or without loss of pulp. After fusion, the cooled cake was dissolved in 75 cc of 1:1 hydrochloric acid, evaporated to dryness, and silica removed. The filtrate from this was heated to boiling and the ammonium hydroxide group (R2O3) precipitated. This precipitate was caught on a filter, washed into a beaker, and dissolved with hydrochloric acid. The iron was then determined by titration with standard potassium dichromate, using diphenylamine sodium sulfonate as an indicator. Check results were obtained by using the Bureau of Standards glass sand no. 81.
In view of the very low iron content of many of the finished products, the sodium carbonate fusion was found to be unsuitable, because of the very large size of the sample necessary. Instead, repeated treatments of hydrofluoric and sulfuric acids were used for all final assays of the finished products and on the selected samples (Hillebrand and Lundell, 1929; Kolthoff and Sandell, 1946). The combination of techniques used is outlined under the regular assay description.
A 5- to 25-gram fraction of each sample was weighed and placed on a 100-cc platinum dish. A few cc of water, one-half cc of concentrated sulfuric acid, and about 50 cc of 48 percent hydrofluoric acid were added. The mixture was heated very carefully until action began, then moved to a hot plate set at low heat. This treatment was repeated until all the silica had been volatilized. The residue was heated to fumes of sulfuric acid and cooled. The remaining material was then taken into solution with an excess of hydrochloric acid and titrated with standard potassium dichromate, as described above. Where solution of the residue was incomplete, a short fusion with potassium acid sulfate was used to clean the dish and titration was performed after precipitation with ammonium hydroxide. The R2O3 separation was necessary wherever platinum contaminated the iron solution, because platinum will titrate 10:1 as Fe2O3 with potassium dichromate (Hillebrand and Lundell, 1929, p. 301).
Silica--Silica was determined by direct hydrofluoric and sulfuric acid treatment after bringing the sample to constant weight at 1200°C. Sulfuric acid was used prior to the ignition in order to convert any acid-soluble calcium to sulfate. The loss of weight of the sample after the volatilization of silicon tetrafluoride was recorded as SiO2.
Alumina, titanium, calcium, and magnesium--Alumina, titanium dioxide, calcium oxide, and magnesium oxide were determined by accepted methods for inorganic analysis.
Iron--The methods previously described were used to provide results for total iron, expressed as Fe2O3.
Potassium and sodium--The alkalies were determined by combination of several methods. The solution of silicates and eventual recovery of alkalies as sulfates were accomplished by the method of Elving and Chao (1949), but only with the added treatment of 8-hydroxyquinoline to remove small amounts of iron, aluminum, and magnesium remaining with the alkali sulfates. Final determination of potassium oxide (K2O) was made by reduction and weighing of platinum from precipitated potassium chloroplatinate (Willard and Diehl, 1946, pp. 259-260). Sodium oxide (Na2O) was determined by difference from the mixed alkali sulfates.
Loss on ignition, sulfur, and phosphorus pentoxide--These determinations were made according to usual inorganic-analysis procedures.
Table 11 gives the iron (Fe2O3) content of selected intervals of the Cheyenne sandstone penetrated in the drill holes. Complete analyses of selected samples and metallurgical products are shown in Table 12. Other assays have been listed in various tables.
Table 11--Selected sections of Cheyenne sandstone cut in the drill holes, with footages and Fe2O3 analyses
| Lab. no. |
Drill hole no. |
Footage | Fe2O3 percent |
|---|---|---|---|
| 4943 | 1 | 11.5-16.5 | 0.481 |
| 4944 | 1 | 16.5-21.5 | 0.273 |
| 4945 | 1 | 21.5-26.5 | 0.141 |
| 4946 | 1 | 26.5-31.5 | 0.192 |
| 4947 | 1 | 31.5-36.5 | 0.309 |
| 4948 | 1 | 36.5-41.5 | 0.183 |
| 4949 | 1 | 41.5-46.5 | 0.085 |
| 4950 | 2 | 9.5-15.0 | 0.393 |
| 4951 | 2 | 15.0-20.0 | 0.433 |
| 4952 | 2 | 23.0-25.0 | shale |
| 4953 | 2 | 25.0-31.0 | shale |
| 4954 | 2 | 31.0-35.0 | 0.045 |
| 4955 | 2 | 35.0-40.0 | 0.077 |
| 4956 | 2 | 40.0-45.0 | 0.101 |
| 4957 | 2 | 45.0-50.0 | 0.086 |
| 4958 | 2 | 50.0-55.0 | 0.186 |
| 4959 | 2 | 55.0-60.0 | 0.191 |
| 4960 | 2 | 60.0-63.0 | 0.346 |
| 4961 | 3 | 31.0-35.0 | 0.345 |
| 4962 | 3 | 35.0-40.0 | 0.202 |
| 4963 | 3 | 40.0-45.0 | 0.075 |
| 4964 | 3 | 45.0-50.0 | 0.109 |
| 4965 | 3 | 50.0-55.0 | 0.163 |
| 4966 | 3 | 55.0-60.0 | 0.172 |
| 4967 | 4 | 5.0-10.0 | 0.119 |
| 4968 | 4 | 10.0-15.0 | 0.107 |
| 4969 | 4 | 15.0-20.0 | 0.493 |
| 4970 | 4 | 20.0-25.0 | 0.099 |
| 4971 | 4 | 25.0-30.0 | 0.091 |
| 4972 | 4 | 30.0-35.0 | 0.213 |
| 4973 | 4 | 35.0-40.0 | 0.296 |
| 4974 | 5 | 15.0-21.0 | 0.335 |
| 4975 | 5 | 21.0-25.0 | 0.310 |
| 4976 | 5 | 25.0-30.0 | 0.160 |
| 4977 | 5 | 30.0-35.0 | 0.352 |
| 4978 | 5 | 35.0-40.0 | 0.113 |
| 4979 | 6 | 15.0-20.0 | 0.465 |
| 4980 | 6 | 20.0-25.0 | 0.904 |
| 4981 | 6 | 25.0-30.0 | 0.287 |
| 4982 | 6 | 30.0-35.0 | 0.121 |
| 4983 | 6 | 35.0-40.0 | 0.098 |
| 4984 | 6 | 40.0-45.0 | 0.242 |
| 4985 | 6 | 45.0-50.0 | 0.328 |
| 4986 | 7 | 23.0-30.0 | 0.161 |
| 4987 | 7 | 30.0-35.0 | 0.103 |
| 4988 | 7 | 35.0-40.0 | 0.120 |
| 4989 | 7 | 40.0-45.0 | 0.074 |
| 4990 | 7 | 45.0-48.5 | 0.165 |
| 4991 | 8 | 28.0-35.0 | 0.305 |
| 4992 | 8 | 35.0-40.0 | 0.134 |
| 4993 | 8 | 40.0-45.0 | 0.214 |
| 4994 | 8 | 45.0-50.0 | 0.131 |
| 4995 | 8 | 50.0-55.0 | 0.310 |
| 4996 | 9 | 3.0-10.0 | 0.187 |
| 4997 | 9 | 10.0-15.0 | 0.066 |
| 4998 | 9 | 15.0-19.0 | 0.055 |
| 4999 | 10 | 20.0-23.0 | 0.295 |
| 49100 | 10 | 23.0-30.0 | 0.194 |
| 49101 | 10 | 30.0-35.0 | 0.109 |
| 49102 | 10 | 35.0-40.0 | 0.113 |
| 49103 | 10 | 40.0-45.0 | 0.099 |
| 49104 | 10 | 45.0-50.0 | 0.128 |
| 49105 | 10 | 50.0-54.0 | 0.145 |
| 49106 | 11 | 14.0-20.0 | 0.247 |
| 49107 | 11 | 20.0-25.0 | 0.283 |
| 49108 | 11 | 25.0-30.0 | 0.391 |
| 49109 | 11 | 30.0-35.0 | 0.217 |
| 49110 | 11 | 35.0-40.0 | 0.132 |
| 49111 | 11 | 40.0-45.0 | 0.068 |
| 49112 | 11 | 45.0-50.0 | 0.099 |
| 49113 | 12 | 20.0-25.0 | 0.268 |
| 49114 | 12 | 25.0-30.0 | 1.939 |
Qualitative spectrographic analyses on selected samples of the sandstone were made with a 1.5-grating spectrograph.
No elements were found that were not reported by chemical or petrographic methods, except extremely small amounts of chromium, copper, vanadium, and silver. The concentration of these elements was estimated to be less than one-tenth of one part per million. These amounts are far below those that would have any commercial significance.
Table 12--Complete chemical analyses.
| Lab. no. |
SiO2 | Al2O3† | Fe2O3 | TiO2** | P2O5 | CaO | MgO | BaO | K2O | Na2O | S | SO3 | Loss‡ on ignition |
Total |
|---|---|---|---|---|---|---|---|---|---|---|---|---|---|---|
| 49195 | 99.38 | 0.17 | 0.07 | 0.07 | 0.008 | 0.02 | 0.02 | 0.013 | N.D. | N.D. | nil | 0.027 | 0.13 | 99.82 |
| 49196 | 99.41 | 0.17 | 0.019 | 0.06 | trace | 0.01 | 0.02 | 0.013 | 0.08 | 0.03 | nil | 0.017 | 0.11 | 99.94 |
| 49197 | 99.32 | 0.15 | 0.048 | 0.07 | 0.017 | 0.01 | 0.02 | 0.013 | 0.08 | 0.08 | 0.001 | 0.017 | 0.14 | 99.97 |
| 49198 | 99.25 | 0.21 | 0.100 | 0.10 | 0.010 | 0.02 | 0.03 | 0.013 | 0.08 | 0.03 | nil | 0.027 | 0.16 | 100.08 |
| 49207 | 98.17 | 0.82 | 0.234 | 0.10 | 0.005 | 0.03 | 0.06 | 0.020 | 0.11 | 0.03 | trace | 0.020 | 0.39 | 99.99 |
| 50132 | 98.72 | 0.72 | 0.123 | 0.08 | 0.007 | 0.01 | 0.03 | 0.013 | 0.03 | 0.01 | nil | 0.027 | 0.34 | 100.09 |
| 50133 | 97.75 | 1.23 | 0.163 | 0.19 | 0.009 | 0.02 | 0.05 | N.D. | N.D. | 0.030* | 0.54 | 99.98 | ||
| 50139 | 94.97 | 2.59 | 0.55 | 0.23 | 0.002 | 0.10 | 0.18 | N.D. | N.D. | 0.018 | 0.022 | 1.09 | 99.75 | |
| 50140 | 97.61 | 1.18 | 0.29 | 0.10 | 0.007 | 0.04 | 0.06 | N.D. | N.D. | 0.002 | 0.028 | 0.54 | 99.86 | |
| 50141 | 98.54 | 0.72 | 0.172 | 0.09 | 0.018 | 0.03 | 0.07 | 0.09 | 0.02 | trace | 0.009 | 0.34 | 100.10 | |
| 50173• | 49.33 | 33.20 | 2.12 | 0.57 | 0.91 | 1.36 | 12.95 | 100.44 | ||||||
| † Contains undetermined manganese. *Represents total sulfur. ‡105-1000° C. •Clay from 1 micron fraction of sand. Theoretically kaolinite has composition as follows: SiO2, 49.5 percent; Al2O3, 39.5 percent; H2O, 14.0 percent. **Contains zirconium dioxide and vanadium pentoxide when present. |
||||||||||||||
The chemical analyses of many samples of the Cheyenne sandstone show that it is essentially a high-silica rock, containing at least 95 percent SiO2 throughout the thickness that would be mined. The natural sand contains about 0.25 percent ferric oxide in the Belvidere area, which is nearest the railroad, and roughly 0.15 percent Fe2O3 in the Barber County area, southwest of Sun City. The sand exposed in eastern Comanche County is of about the same quality as in western Barber County.
Petrographic work showed neither unusual minerals nor characteristics in the Cheyenne sandstone that might cause difficulty to an operator. Heavy minerals, which are present only in small quantity, are easily eliminated by conventional means--judging by the flotation and magnetic separation tests.
Work done by Mr. Bowdish and by the Denver Equipment Company indicates that tabling may be a satisfactory way of producing an acceptable grade of the sand in one of the localities studied, but that flotation does a better job elsewhere. Therefore, any prospective operator should make careful metallurgical tests on sand from the locality he tentatively selects.
One flotation test on a sample from drill hole 9 gave a product containing only 0.025 percent Fe2O3, a good-quality glass sand. This suggests that search for a deposit of sand naturally low in iron might be well rewarded.
Since the iron content of the raw sand is present as coating on the quartz grains, as discrete grains of pyrite, ilmenite, and their alteration products, and as inclusions in quartz grains, the use of two beneficiation methods is indicated--one to remove the ferruginous coating, and another to remove the undesired iron-bearing grains. The quartz grains containing inclusions probably cannot be removed entirely by any practical means.
The drilling was done in January 1949 during a severe blizzard. As it was not feasible to dry the samples in the field, they were sent to Lawrence in a moist or frozen condition then placed in a drying oven for removal of moisture. Some cementation of clay material to the sand grains probably took place during this drying process. Evidence of this is that assays for Fe2O3 made on samples from natural outcrops gave results as good as the best scrubbed drill samples. This suggests that in an actual open-pit mine operation, the bank material might be beneficiated more easily than our tests indicate.
Most reserve tonnage calculations involve quantity, type, and quality of the substance, and cost of mining. In the case of silica sand in the area investigated, it is reasonable to assume a 20-foot mining thickness of the lower part of the Cheyenne formation. In view of the prevailing type of topography, this mining thickness may be assumed to extend backward from the outcrop a distance of several hundred feet. Terraces 500 feet wide, containing sand of satisfactory quality and grain size and where stripping conditions would not be prohibitive probably could be found. The outcrop length of the Cheyenne sandstone within the area investigated extends for a distance of some 50 miles, numerous ravines making the crop line a sinuous one. Within this distance, it is believed that several localities could be selected, any of which have dimensions 300 feet wide by 1,000 feet long, and a 20-foot mining thickness of sandstone. Using 14 cubic feet per ton of sandstone in place, the reserves in such a locality would amount to about 430,000 tons, or enough to supply a 140-ton-per-day operation for about 10 years.
Seemingly a 140- or 150-ton-per-day operation would supply present known demand for both foundry uses and glass manufacture. However, if a glass company were to consider locating a plant within easy shipping distance of this silica sand source, it is our judgment that there would be little problem in developing adequate tonnage reserves for a long-time operation.
The quality of the Cheyenne sandstone is good, both in respect to chemical composition and average grain size. The latter is similar to grain size of the silica-sand deposits of the Ottawa, Illinois, area, and should be more favorable both for glassmaking and foundry uses than the finer grained St. Peter sandstone from the Arbuckle Mountains of Oklahoma.
Metallurgical tests described in this report indicate the amenability of the Cheyenne sandstone to common and economical methods of beneficiation.
Natural gas for plant fuel, sand drying, and power (if desired) is produced within a few miles of the sand area; it is reported that a user of substantial quantities might obtain an independent supply of natural gas, not now connected to a transmission line.
Adequate supplies of water for domestic and industrial use are judged to be available from the valley alluvium of Medicine Lodge River or by drilling wells a few hundred feet deep.
The matrix material of the Cheyenne sandstone is such that a chunk of the sandstone dropped into water disintegrates almost immediately. Mining it hydraulically with a pressure jet--a conventional manner of mining silica sand in both the Ottawa, Illinois, and southern Oklahoma areas--is believed to be the cheapest and most practical manner. Mining and partial scrubbing of the sand is thus accomplished in one operation.
A hydraulic mining operation uses a minimum of labor and equipment and has a low installation cost per unit of product, In such an operation employing two settling ponds for regeneration of mining water, the settled clay fraction might have significant value as a by-product.
The marketing situation in Kansas for silica sand should be fair now and should improve as industrialization increases. A silica-sand operator in the Belvidere area should be able to meet present competition as far east as Kansas City, as far west as Denver, and some distance southward into Oklahoma.
Present demand for silica sand that might be produced from the Cheyenne sandstone is such that an operator would have to start modestly, marketing a quality product to a selected trade group. In time, the business might well increase to greater size as demand developed for regular and ground silica used by the glass, foundry, chemical, and other industries.
The price of river sand f.o.b. railway car in Kansas is about 80 cents per ton. Freight to point-of-use must be added. The price of silica sand from Illinois or eastern Missouri points delivered at Kansas City in carload lots is roughly $4.50 to $5.00 per short ton. About half of that price is transportation. Freight on Cheyenne sand from the Belvidere area to the Kansas City-Atchison-Pittsburg area of Kansas is estimated at approximately $2.00 to $2.50 per ton. Therefore, the cost of producing silica sand from a Cheyenne deposit could not exceed $2.00 per ton in order to meet competition in the Kansas City area. This is possible in a well-managed operation of proper size.
Current operation costs for mining and partially scrubbing the sand in an open pit by standard hydraulic methods on the basis of 150 tons per 8-hour day should be about 25 cents per ton. Further beneficiation by flotation, magnetic separation, tabling, log washing, or electrostatic separation would cost approximately 50 cents per ton. Drying the drained sand would cost 35 to 45 cents per ton. Conveying, storing, loading, and general expense would add another 20 to 45 cents, making a total current cost of about $1.50 per ton on the car.
Such an operation, as a subsidiary enterprise, would probably not be attractive to a corporation having to make substantial charges to head office overhead, continuing research, and sales, or to a producer or contractor in the habit of making his profit on volume production. It might, however, be attractive to an individual desiring to start a comparatively small, well-planned and well-engineered enterprise employing only a few men, but having a chance of sound future development.
The quality of sandstone deposits described in this report is within acceptable limits for commercial glass sand as used in the United States. The grain size and general chemical and mineralogical nature of the deposits classify them as a common type of silica sandstone, usable either for glassmaking or foundry sand.
As they exist in nature, the Cheyenne deposits investigated are not quite high enough in quality for use in glassmaking without some treatment or beneficiation. Most glass sand consumed in the United States requires washing or treatment of some kind before it can be used. Judging by tests described in this report, the deposits can be treated economically by conventional methods so as to produce a silica product or glass sand of either ordinary or high quality-whatever the market requires.
The quantity of the sand available to economical mining and transportation is sufficient to supply any anticipated demand for a long time. In general, operating conditions, including climate, labor supply, transportation, absence of near-by competition, tax set-up, and availability of natural gas for fuel, are satisfactory.
Field logs of test holes drilled in the Barber, Comanche, and Kiowa County area are given below. The number designation of each log is that used throughout the text. Samples were collected and logs prepared by Kenneth L. Walters.
| Sample log of drill hole 1, in the SW cor. SE sec. 9, T. 30 S., R. 16 W., Kiowa County, Kansas. | Thickness, feet |
Depth, feet |
||
|---|---|---|---|---|
| Cretaceous--Comanchean | ||||
| Kiowa shale | ||||
| Shale, gray, sandy | 5 | 5 | ||
| Cheyenne sandstone | ||||
| Shale, gray and tan | 4 | 9 | ||
| Shale and sand, red | 1 | 10 | ||
| Sand, white | 1.5 | 11.5 | ||
| Sand, medium, white | 5 | 16.5 | ||
| Sand, tan | 10 | 26.5 | ||
| Sand, tan; some red color noted | 10 | 36.5 | ||
| Sand, tan and light-brown; contains some pebbles | 5 | 41.5 | ||
| Sand, tan and light-brown | 5 | 46.5 | ||
| Sand | 0.5 | 47 | ||
| Permian--Guadalupian | ||||
| Redbeds | 6 | 53 | ||
| Sample log of drill hole 2, Cen. N2 NW sec. 17, T. 30 S., R. 16 W., Kiowa County, Kansas. | Thickness, feet |
Depth, feet |
||
|---|---|---|---|---|
| Cretaceous--Comanchean | ||||
| Kiowa shale | ||||
| Shale, tan, buff, trace black | 7.5 | 7.5 | ||
| Cheyenne sandstone | ||||
| Shale, sandy | 2 | 9.5 | ||
| Sand, tan to gray | 8 | 17.5 | ||
| Sand, red-brown, very carbonaceous | 0.5 | 18 | ||
| Shale, sandy, blue-gray | 8 | 26 | ||
| Sand | 37 | 63 | ||
| Permian--Guadalupian | ||||
| Shale, green | 3 | 66 | ||
| Redbeds | 4 | 70 | ||
| Sample log of drill hole 3 in the SE cor. SW sec. 18, T. 30 S., R. 16 W., Kiowa County, Kansas. | Thickness, feet |
Depth, feet |
||
|---|---|---|---|---|
| Cretaceous--Comanchean | ||||
| Kiowa shale | ||||
| Shale, gray, tan, and black | 3 | 3 | ||
| Cheyenne sandstone | ||||
| Shale, sandy | 2 | 5 | ||
| Sand, tan to gray | 5 | 10 | ||
| Shale, sandy, tan | 13 | 23 | ||
| Redbeds | 8 | 31 | ||
| Shale, sandy, tan | 4 | 35 | ||
| Sand, tan | 4 | 39 | ||
| Sand and sandy black shale | 1 | 40 | ||
| Sand | 22 | 62 | ||
| Shale | 4 | 66 | ||
| Permian--Guadalupian | ||||
| Shale, red | 4 | 70 | ||
| Sample log of drill hole 4, 1,000 feet north of the SW cor. sec. 10, T. 30 S., R. 16 W., Kiowa County, Kansas. | Thickness, feet |
Depth, feet |
||
|---|---|---|---|---|
| Silt and soil | 2 | 2 | ||
| Cretaceous--Comanchean | ||||
| Kiowa shale | ||||
| Shale, gray to black | 3 | 5 | ||
| Cheyenne sandstone | ||||
| Sand, tan to gray | 5 | 10 | ||
| Sand, tan | 5 | 15 | ||
| Sand, tan; charcoal streak at 19.5 feet | 5 | 20 | ||
| Sand, tan | 4 | 24 | ||
| Charcoal | 0.5 | 24.5 | ||
| Sand, tan | 2.5 | 27 | ||
| Charcoal | 0.5 | 27.5 | ||
| Sand, tan | 2.5 | 30 | ||
| Sand, gray | 4.5 | 34.5 | ||
| Sand, brown | 0.5 | 35 | ||
| Sand, gray | 2 | 37 | ||
| Shale and sand in 6-inch bands | 3 | 40 | ||
| Permian--Guadalupian | ||||
| Shale, green | 1 | 41 | ||
| Redbeds | 4 | 45 | ||
| Sample log of drill hole 5 in the NW SW sec. 10, T. 30 S., R. 16 W., Kiowa County, Kansas. | Thickness, feet |
Depth, feet |
||
|---|---|---|---|---|
| Cretaceous--Comanchean | ||||
| Kiowa shale | ||||
| Silt and shale, black | 5 | 5 | ||
| Cheyenne sandstone | ||||
| Shale, sandy, gray | 10 | 15 | ||
| Sand, shaly | 6 | 21 | ||
| Sand, brown | 9 | 30 | ||
| Sand, tan | 3 | 33 | ||
| Charcoal | 0.5 | 33.5 | ||
| Sand, tan | 1.5 | 35 | ||
| Sand, gray; contains many chalk pebbles | 3.5 | 38.5 | ||
| Cavity | 1 | 39.5 | ||
| Sand, gray; contains many chalk pebbles | 0.5 | 40 | ||
| Could not maintain circulation below 40 feet; drilled like shale. | ||||
| Sample log of drill hole 6 at the Cen. N. line SW sec. 15, T. 30 S., R. 16 W., Kiowa County, Kansas. | Thickness, feet |
Depth, feet |
||
|---|---|---|---|---|
| Cretaceous--Comanchean | ||||
| Kiowa shale | ||||
| Shale, tan and dark-gray | 9 | 9 | ||
| Cheyenne sandstone | ||||
| Shale, sandy, gray | 11 | 20 | ||
| Sand, shaly | 5 | 25 | ||
| Sand | 10 | 35 | ||
| Sand, yellow | 5 | 40 | ||
| Sand; contains charcoal streak at 44 feet | 5 | 45 | ||
| Sand, yellow | 5 | 50 | ||
| Permian--Guadalupian | ||||
| Shale, green | 3 | 53 | ||
| Shale, red | 2 | 55 | ||
| Sample log of drill hole 7 in the NW NE sec. 19, T. 31 S., R. 15 W., Barber County, Kansas. | Thickness, feet |
Depth, feet |
||
|---|---|---|---|---|
| Cretaceous--Comanchean | ||||
| Kiowa shale | ||||
| Shale | 15 | 15 | ||
| Cheyenne sandstone | ||||
| Shale | 8 | 23 | ||
| Sand, tan | 7 | 30 | ||
| Sand, very white | 10 | 40 | ||
| Sand, gray | 5 | 45 | ||
| Sand, tan | 3.5 | 48.5 | ||
| Shale, gray, sandy | 3.5 | 52 | ||
| Permian--Guadalupian | ||||
| Redbeds | 3 | 55 | ||
| Sample log of drill hole 8 at approximately Cen. NE sec. 19, T. 31 S., R. 15 W., Barber County, Kansas. | Thickness, feet |
Depth, feet |
||
|---|---|---|---|---|
| Cretaceous--Comanchean | ||||
| Kiowa shale | ||||
| Shale, black, red, and gray | 16 | 16 | ||
| Cheyenne sandstone | ||||
| Shale, gray, sandy | 12 | 28 | ||
| Sand, tan; contaminated with shale from above | 7 | 35 | ||
| Sand, tan | 5 | 40 | ||
| Sand, gray | 10 | 50 | ||
| Sand and tan sandy shale | 5 | 55 | ||
| Permian--Guadalupian | ||||
| Shale, gray-green | 3 | 58 | ||
| Redbeds | 2 | 60 | ||
| Sample log of drill hole 9 at the Cen. E. line SE sec. 18, T. 31 S., R. 15 W., Barber County, Kansas. | Thickness, feet |
Depth, feet |
||
|---|---|---|---|---|
| Silt, sandy | 3 | 3 | ||
| Cretaceous--Comanchean | ||||
| Sand, yellow | 5 | 8 | ||
| Sand, white | 7 | 15 | ||
| Sand, gray | 4 | 19 | ||
| Shale, tan and gray | 4 | 23 | ||
| Permian--Guadalupian | ||||
| Redbeds | 2 | 2 | ||
| Sample log of drill hole 10 in the Cen. E2 NW sec. 19, T. 31 S., R. 15 W., Barber County Kansas. | Thickness, feet |
Depth, feet |
||
|---|---|---|---|---|
| Cretaceous--Comanchean | ||||
| Shale and silt | 9 | 9 | ||
| Kiowa shale | ||||
| Shale, gray | 11 | 20 | ||
| Shale | 1 | 21 | ||
| Cheyenne sandstone | ||||
| Sand | 2 | 23 | ||
| Sand, white | 27 | 50 | ||
| Sand, tan | 4 | 54 | ||
| Shale, gray | 6 | 60 | ||
| Permian--Guadalupian | ||||
| Redbeds | 5 | 65 | ||
| Sample log of drill hole 11 in the NW NW sec. 27, T. 31 S., R. 16 W.,.Comanche County, Kansas. | Thickness, feet |
Depth, feet |
||
|---|---|---|---|---|
| Cretaceous--Comanchean | ||||
| Kiowa shale | ||||
| Shale, blue | 9.5 | 9.5 | ||
| Cheyenne sandstone | ||||
| Shale and sand | 3.5 | 13 | ||
| Sand, brown | 6 | 19 | ||
| Shale, gray | 1 | 20 | ||
| Sand, fine, brown | 2 | 22 | ||
| Shale, sandy, gray | 9 | 31 | ||
| Sand, light-brown | 4 | 35 | ||
| Sand, white | 13 | 48 | ||
| Shale, yellow | 5 | 53 | ||
| Permian--Guadalupian | ||||
| Redbeds | 2 | 55 | ||
| Sample log of drill hole 12, approximately 500 feet east of Cen. sec. 34, T. 31 S., R. 16 W., Comanche County, Kansas. | Thickness, feet |
Depth, feet |
||
|---|---|---|---|---|
| Tertiary--Pliocene | ||||
| Ogallala formation | ||||
| Shale, tan, sandy; contains caliche | 5 | 5 | ||
| Sand, tan | 11 | 16 | ||
| Cretaceous--Comanchean | ||||
| Kiowa shale | ||||
| Shale, tan | 3 | 19 | ||
| Cheyenne sandstone | ||||
| Sand, tan | 6 | 25 | ||
| Gravel and sand | 4 | 29 | ||
| Permian--Guadalupian | ||||
| Shale, gray-green | 4 | 33 | ||
| Redbeds | 2 | 35 | ||
Cragin, F. W. (1889) Contributions to the paleontology of the plains: Washburn Coll. Lab. Nat. Hist., vol. 2, no. 10, pp. 65-68.
Cragin, F. W. (1895) A study of the Belvidere beds: Am. Geol., vol. 16, pp. 357-386.
Elving, P. J., and Chao, P. C. (1949) Determination of alkali metals in silicates and similar materials: Anal. Chem., vol. 21, no. 4, pp. 507-510.
Hillebrand, W. F., and Lundell, G. E. F. (1929) Applied inorganic analysis: John Wiley & Sons, New York, 9th prtg., pp. 1-929, figs. 1-40.
Kolthoff, I. M., and Sandell, E. B. (1946) Textbook of quantitative inorganic analysis: The Macmillan Co., New York, rev. ed., pp. 1-794, figs. 1-131.
Krumbein, W. C. (1941) Measurement and geological significance of shape and roundness of sedimentary particles: Jour. Sed. Petrology, vol. 11, pp. 64-72, figs. 1-5, pl. 1.
Latta, B. F. (1946) Cretaceous stratigraphy of the Belvidere area, Kiowa County, Kansas: Kansas Geol. Survey, Bull. 64, pt. 6, pp. 219-260, figs. 1-4, pls. 1-3. [available online]
Nixon, E. K. (1949) Preliminary report on glass sand possibilities of the Barber-Comanche-Kiowa counties area, Kansas: Kansas Geol. Survey, pp. 1-10, fig. 1, mimeo.
Ries, H. (1949) Special sands: Industrial minerals and rocks: The American Institute of Mining and Metallurgical Engineers, pp. 965-979.
Rose, K. E. (1950) Silica sand from south-central Kansas for foundry use: Kansas Geol. Survey, Bull. 86, pt. 4, in press. [available online]
Swineford, Ada, and Williams, H. L. (1945) The Cheyenne sandstone and adjacent formations of a part of Russell County, Kansas: Kansas Geol. Survey, Bull. 60, pt. 4, pp. 101-168, figs. 1-9, pls. 1-2. [available online]
Tyler, P. M. (1950) Special methods for the beneficiation of glass sand: paper given at annual meeting of A.I.M.E., February 12-16, 1950.
Willard, H. H., and Diehl, Harvey (1946) Advanced quantitative analysis: D. Van Nostrand Co., Inc., New York, 3rd prtg., pp. 1-457, figs. 1-40.
Kansas Geological Survey, Cheyenne Sandstone, Kansas, as Raw Material for Glass Manufacture
Placed on web Aug. 10, 2009; originally published in Oct. 1950.
Comments to webadmin@kgs.ku.edu
The URL for this page is http://www.kgs.ku.edu/Publications/Bulletins/86_3/index.html