![]()
Prev Page--Stratigraphy--Cretaceous to Quaternary || Next Page--References
Structural Development of the Salina Basin
The structural development of the Salina basin has been studied by means of a series of maps that represent the thickness of individual formations and of sequences of formations in and adjacent to the basin.
The interpretation of structural movements from thickness maps is based on the following concept: if a sequence of rocks is deposited on an originally Hat surface, and if this sequence of rocks is warped and folded before the later development of a second Hat horizontal surface, the variations in thickness of the rocks between the two surfaces will reveal the amount and place of the deformation (Lee, 1954) that had taken place when the second surface was still undisturbed.
The deformation of the first surface may precede or follow the deposition of the overlying rocks or occur during the deposition of the sequence. The presence of a marked unconformity or disconformity within the sequence will not confuse the objective, which is the determination of the total amount of deformation between the development of the first and second reference planes, provided the pattern of deformation remains unchanged.
The accuracy with which the thickness maps record the structural movements is dependent upon the degree to which the surfaces above and below the sequence approach base level, whether by deposition or erosion. A depositional surface generally presents a nearly perfect horizontal datum plane. Most of the eroded surfaces of the area have little topographic relief, and thus resemble peneplains. The topographic relief of most of the surfaces utilized in preparing the thickness maps is negligible in comparison with the regional variations of thickness that are due to structural movement.
The topographic relief of some surfaces, however, introduces erratic configuration of the thickness lines. Valleys on imperfectly beveled surfaces are generally recognizable on account of thinning of beds of one sequence accompanied by a compensating increase in thickness of the overlying beds. On the other hand, hills are revealed by local thickening of the lower sequence accompanied by a compensating thinning of the overlying formation. Minor structural and topographic features are generally not revealed by 50-foot thickness lines. In oil fields where many wells have been drilled, the local structural features are commonly expressed by thickness lines drawn at small intervals, and in some fields the study of thickness lines combined with detailed stratigraphic studies reveals local topographic features on the eroded surfaces (Lee and Payne, 1944, p. 105, fig. 14).
Beveling of stratified rocks is recognized by the thinning and wedging out of successive units directly below an unconformity. A progressive development of anticlinal features is indicated by the localized thinning of two or more consecutive units in the same area. In such an area, it must be assumed that the surface at the locality was either progressively arched during the deposition of several units or that exposure and erosion caused thinning of the consecutive units in the same place. The latter, although not impossible, is unlikely. Similarly, progressive synclinal movement is indicated by the localized thickening of two or more consecutive units in the same locality.
In the Salina basin area, three principal periods of folding of distinctly different character are revealed by the thickness maps and two others are revealed by structure maps. The first period of folding affected the rocks lying between the Precambrian surface and the base of the St. Peter sandstone. The second occurred during the deposition of the rocks between the St. Peter sandstone and the base of the Mississippian. The third period of folding began early in Mississippian time, developed maximum intensity between the end of Mississippian time and the beginning of Pennsylvanian deposition, and continued with decreasing structural vigor through most of the Permian. The fourth occurred between Permian and Cretaceous times, and the fifth between Cretaceous time and the present.
Pre-Simpson Folding
The thickness of rocks between the Precambrian surface and the base of the St. Peter sandstone is shown in Plate 1 by lines drawn at 100-foot intervals of thickness. A relatively level Precambrian surface is indicated by the wide distribution of the Bonneterre dolomite, which is underlain in most areas by the Lamotte sandstone. Precambrian hills of considerable height have been revealed in several places by drilling. McQueen (1931, pl. 10) reports Gunter sandstone overlying a Precambrian hill in Vernon County, Missouri, a relationship that implies an elevation of about 600 feet above the general Precambrian surface. Similar hills have been found by drilling in northeastern Oklahoma (Ireland, 1955), southeastern Kansas, and on the Central Kansas uplift (Walters, 1946). The thickness of the Arbuckle above such hills has been ignored in drawing the thickness maps, and only those wells that have penetrated the Bonneterre have been utilized.
The upper surface of the Arbuckle, upon which the St. Peter sandstone was deposited, is exposed in parts of northern Missouri, where it was drained by shallow channels. Inasmuch as the thickness of the St. Peter in wells of the area is rarely less than 50 feet or as much as 100 feet, the topographic relief of the surface was relatively low. Scattered wells in northwestern Missouri and northeastern Kansas, however, have revealed local thicknesses of St. Peter sandstone as great as 403 feet (Lee, Grohskopf, Reed, and Hershey, 1946, sheet 1). These exceptional increases in the thickness of the St. Peter sandstone seem to indicate a material lowering of the ground-water level and the development of sink holes or possibly deep incised drainage valleys. In either case an uplift of the region of at least 400 feet is implied before subsidence and deposition of the St. Peter sandstone upon an otherwise truncated surface.
A map showing the thickness of the Arbuckle in northern Missouri and northeastern Kansas (Lee, Grohskopf, Reed, and Hershey, 1946, sheet 1) indicates a subsiding basin, the Ozark basin, extending northward from central Missouri into eastern Iowa, and a broad structural arch, the Southeast Nebraska arch, trending south from southeast Nebraska into eastern Kansas, more or less parallel to the contemporaneous Ozark basin.
In southern Missouri, where the St. Peter has been eroded, a thickness map of rocks between the top of the Roubidoux and the Precambrian (Lee, 1943, fig. 10) reveals that the Ozark basin was already an active structural feature before Roubidoux time.
Because of the scanty data, the configuration of the thickness lines on Plate 1 is of necessity only an approximation. The top of the Lamotte would have provided a more nearly horizontal datum, but this surface is not reported in old records, which log only the top of the Precambrian. The thickness map therefore records the structural deformation and in addition the local topographic relief of the Precambrian surface, which in places may have projected above the level of Lamotte deposition. Wells drilled into recognizable Precambrian hills and those in areas from which the overlying Simpson rocks were later eroded have been ignored in drawing thickness lines for the determination of regional structure. The small number of wells available and the distances between them eliminate local detail. The map, therefore, illustrates only in generalized form the regional deformation of the Precambrian plain at the beginning of Simpson time.
Similarly the cross sections, although based on examination of samples and insoluble residues in the Kansas area, do not pretend to depict the local irregularities of the formations, or hills or other topographic features, but only the regional relations of the stratigraphic sequence to the structural features revealed by the thickness maps.
Plate 1 shows the Southeast Nebraska arch, from parts of which the St. Peter or Simpson rocks were later eroded, and a flanking syncline extending northwest from Reno County to Rooks County. The data are inadequate to define the basin with complete accuracy, but the evidence from available wells in which the Simpson and Bonneterre are both present seems to indicate that the axis of the basin trended northwest into the area that later formed a part of the Central Kansas uplift. Enough evidence is available to indicate that the Central Kansas uplift, as such, was not yet a structural feature. The map suggests also that the south end of the Southeast Nebraska arch tended to Hatten toward the south and merge with the southerly sloping monocline of Oklahoma.
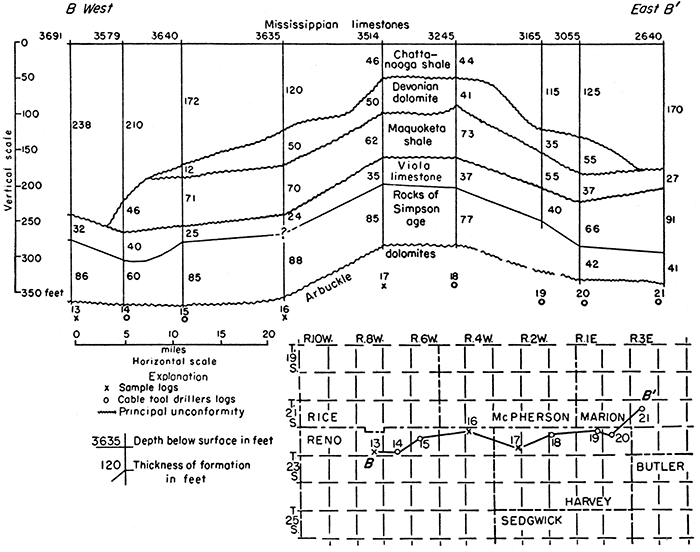
Cross section A-A' of Plate 1 extends across the synclinal area in Stafford and Rice counties toward the crest of the Southeast Nebraska arch and shows the beveling of the Arbuckle formations before the deposition of the St. Peter sandstone or other Simpson rocks.
The wells of cross section B-B' of Figure 3 are correlated on the top of the Roubidoux formation in the absence of the Simpson. The cross section extends across the Ozark basin of southern Missouri into southeastern Kansas, thence along the southern extension of the Southeast Nebraska arch to T. 11 S., R. 18 W., in the structural basin southwest of the arch.
The Missouri part of the cross section is based on McQueen's report (1931), the only available data. The overlap of the Roubidoux upon pre-Roubidoux rocks in eastern Kansas is based on the examination and interpretation by the writer of the somewhat inadequate samples and residues in the files of the State Geological Survey, as described in the section on stratigraphy.
The disappearance toward the west of the Davis, Derby and Doe Run, and Potosi is interpreted as overlap of the Eminence on the gradually rising surface of the Bonneterre, although other unconformities may exist. The Eminence in turn is overlapped by the Gasconade toward the west. Farther west, the Roubidoux overlaps the eroded surface of the Gasconade, and still further northwest it overlies the Bonneterre. The southern extension of the Southeast Nebraska arch is not reflected on the cross section for lack of a critically located well. The thickness map shows the arch to be considerably flattened on the line of the cross section.
Intermittent oscillatory movement was more or less continual throughout the deposition of the Arbuckle as is shown by the numerous indications of shallow water and minor exposure in outcrops of Arbuckle formations in the Ozarks. There seem to have been four principal movements of uplift and erosion represented by (a) the overlap of Eminence on Bonneterre in well 8 of cross section B-B' of Figure 3; (b) the overlap of Gasconade from Eminence to Bonneterre in well 6; (c) the overlap of Roubidoux from Gasconade to Bonneterre in wells 6, 5, and 4; and (d) the final beveling of the whole sequence of Arbuckle formations and overlap by the Simpson as shown in cross section A-A' of Plate 1. The uplifts and bevelings that preceded deposition of the Roubidoux and, later, of the Simpson seem to have been the most important.
Development of North Kansas Basin
After St. Peter time a broad area in southeastern Nebraska and northeastern Kansas known as the North Kansas basin, which had previously been a positive area (the Southeast Nebraska arch), began a long period of differential subsidence. Also at this time the Ozark region of Missouri rose, and the Chautauqua arch and the Central Kansas uplift began their upward movement (Lee. 1943; Lee, Grohskopf, Reed, and Hershey, 1946).
The deformation of these structural features in post-St. Peter time was intermittent and occurred both during periods of sedimentation and during periods of emergence. In some areas the re-elevated surface was eroded without deformation; in others, surfaces of low relief truncated strata previously warped and reelevated.
Deformation of Rocks of Simpson Age
Evidence of deformation between the deposition of the St. Peter and the Platteville is obscure in the Salina basin area. The area seems to have remained more or less static after the deposition of the St. Peter sandstone, for during the hiatus between the St. Peter and the Platteville several thick formations separated from one another by unconformities and aggregating about 900 feet in thickness were deposited in a subsiding basin in southeastern Missouri.
The Platteville is unconformable with both the underlying St. Peter and the overlying Viola. Its thickness is therefore irregular, although neither surface shows pronounced topographic relief. The Platteville thickens northward as shown in cross section A-A' of Plate 2, which records the beginning of subsidence of the North Kansas basin.
The southward thickening of the Simpson in Oklahoma south of the Chautauqua arch implies major subsidence of that area.
Deformation of Viola-Maquoketa Sequence
Although a hiatus exists between the Simpson and the Viola, the wide distribution of the basal non cherty zone of the Viola indicates that the surface of the Simpson was one of very low relief. The upper surface of the Viola was broadly dissected by preMaquoketa erosion, as indicated by the cross sections of Figures 5, 6, 7, and 8. Despite the stronger erosion in the southwestern part of the area, the northerly increase in the thickness of the Viola is greater than the topographic relief of the pre-Maquoketa surface, as shown graphically in cross section A-A' of Plate 2. The effect of Maquoketa deposition was to level off the inequalities of the Viola surface and present an almost level surface to Silurian deposition. The thinning from north to south of the Viola-Maquoketa sequence is the measure of the subsidence of the North Kansas basin during the corresponding time interval. On the line of cross section A-A' of Figure 4 the subsidence was 165 feet greater at the site of well 11 than at well 5 in a distance of 105 miles.
Deformation of Silurian Rocks
The Silurian is essentially conformable with the Maquoketa. At the end of Silurian time, the whole region was elevated above sea level, probably by a series of differential and oscillatory movements accompanied by regional warping. During the ensuing erosion most of the surface was reduced to a nearly Hat plain, but in some areas the surface was broken by broad hills as much as 80 feet high. As a result, as indicated in cross section A-A' of Plate 2, the thickness of the Silurian is not a mathematically accurate gage of the structural movements that occurred before deposition of the first beds of the Devonian. The consistent thickening of the Silurian rocks toward the center of the North Kansas basin (cross section A-A' of Pl. 2 and Fig. 4), however, clearly demonstrates that the North Kansas basin continued to subside either during the deposition of the Silurian, as seems probable from cross section A-A' of Plate 3, or certainly preceding Devonian deposition, or both.
Cross section A-A' of Plate 3 indicates that, from the first deposition of the Silurian rocks until the end of the pre-Devonian erosion, the North Kansas basin subsided about 350 feet more at the site of well 18 than at well 8. In the central part of the basin the subsidence was even greater.
Overall Deformation Between Arbuckle and Devonian Rocks
Plate 2 shows the thickness of the interval between the base of the Simpson and the base of the Devonian, and also the pre-Devonian areal geology. On the pre-Devonian surface the Viola and Maquoketa rocks cropped out in broad belts flanking the Silurian. In sec. 12, T. 25 S., R. 5 E., the Devonian overlies the Simpson. This relation was probably general elsewhere in the southeast part of the area before the Devonian was removed by pre-Chattanooga erosion.
Deformation of Devonian Rocks
The Devonian rocks are confined between unconformable surfaces of considerable relief. Plate 3 shows the thickness of the surviving Devonian limestone. Disregarding the obvious effect of the McPherson Valley in removing and thinning the Devonian in that area, it is obvious that the Devonian rocks follow, although irregularly, the pattern of thickening towards the North Kansas basin exhibited by the older formations. Again disregarding the McPherson Valley, it is evident (cross sections, Pl. 3, 4, and 5) that the northward thickening of the Devonian over broad areas exceeds the topographic relief.
During the deposition of the Devonian rocks on the post-Silurian truncated surface, the North Kansas basin continued to subside. After the deposition of Devonian limestone, the region was again raised, and although deeply eroded locally, the surface was again irregularly beveled by pre-Chattanooga erosion.
Deformation of Chattanooga and Boice Shales
Plate 4 shows the thickness of the combined Chattanooga and Boice shales. The thickness of this shale sequence in the Salina basin is more expressive of the topography of the pre-Chattanooga surface than of the structural developments. The pre-Chattanooga valley, which is revealed by the meanderings of the thickness lines in McPherson and Marion counties and in the adjoining counties to the south and east, was eroded on the beveled surface of the Devonian rocks. The wedging out of the shales on the western, northern, and eastern margins of the shale area is, however, the result of beveling at the end of Mississippian time and is thus not related to structural movements or to the topography that developed between pre-Chattanooga erosion and the deposition of the Mississippian limestones.
Outside the pre-Chattanooga valley and the areas of westward and northward thinning of the shales, there is a gradual thickening toward the northeast in the direction of the deeper part of the North Kansas basin. This thickening is more significant when taken in connection with broader areas, including the Forest City basin (Lee, 1940, pl. 4; Lee, Grohskopf, Reed, and Hershey, 1946).
Overall Deformation between Base of Simpson and Top of Chattanooga
Plate 5 shows the thickness of rocks between the base of the St. Peter sandstone and the top of the Chattanooga-Boice shale sequence and reveals the deformation that took place during the corresponding time interval. The extent of this deformation represents the total of the separate increments of deformation indicated in Plates 2 to 4. The post-Devonian anticlinal arch in Harvey County, revealed by cross section B-B' of Figure 19, is also clearly shown on Plate 5. Its northerly trend is approximately parallel to the Nemaha anticline. Plate 5 reveals also that the subsidence of the North Kansas basin amounted to at least 1300 feet below the flank of the Chautauqua arch within the area mapped. The total downwarping of the bottom of the North Kansas basin below the crest of the Chautauqua arch was considerably greater and may have reach 2000 feet during this interval.
Figure 19--Cross section, west to east, across Reno and Harvey counties, on line B-B' of inset and Plate 5, showing pre-Chattanooga anticline at wells 17 and 18 (after Leatherock, 1948, fig. 9).
Development of Nemaha Anticline and Salina Basin
Deformation During Mississippian Time
As pointed out in the discussion of the stratigraphy of the Chattanooga-Boice shale sequence, the surface at its upper contact with Mississippian limestones was exceptionally level. The first deposits upon this surface were Kinderhookian limestones. In southeastern Kansas they consist of correlatives of the Chouteau and Sedalia limestones, both of which thicken northward from a featheredge near the Kansas-Oklahoma border to 245 feet in central Iowa, where the Kinderhookian Hampton formation occupies a position corresponding to the Chouteau and Sedalia (Laudon, 1931).
The gradual northward thickening of the Kinderhookian formations from southeastern Kansas north to central Iowa, as shown in cross section A of Figure 20, reveals that during Kinderhookian time and at its close central Iowa was subsiding and southeastern Kansas was stationary or was being slightly elevated. At the end of Kinderhookian time the entire region was raised above sea level, and during a period of relative stability the formations were beveled as is illustrated diagrammatically in cross-section A of Figure 20. With the advent of Osagian time, the beveled surface seems to have been tilted southward, for the earliest Osagian deposit, the St. Joe limestone, wedges out northward. The later Osagian formations, the Reeds Spring, Burlington, and Keokuk limestones, and the Meramecian "Warsaw", Spergen, and St. Louis limestones overlap in succession northward on Kinderhookian limestones, as shown diagrammatically in cross section B of Figure 20. The differential tilting of the surface toward the south, which began before St. Joe time and must have been more or less continuous during the long period of overlap, kept the Kinderhookian rocks of Iowa above sea level. Although the surface probably was seldom raised much above sea level, some erosion of the Kinderhookian rocks of Iowa must have occurred during Osagian time. Figure 20 shows the structural relations of the Mississippian rocks east of the axis of the Nemaha anticline, in an area that was already beginning to subside in early Mississippian time.
Figure 20--Diagrammatic cross sections from southeastern Kansas to central Iowa, showing northerly thickening of Kinderhookian limestones and northerly thinning and overlap of younger Mississippian formations. Compare with Figure 13. [Larger version available as an Acrobat PDF file.]
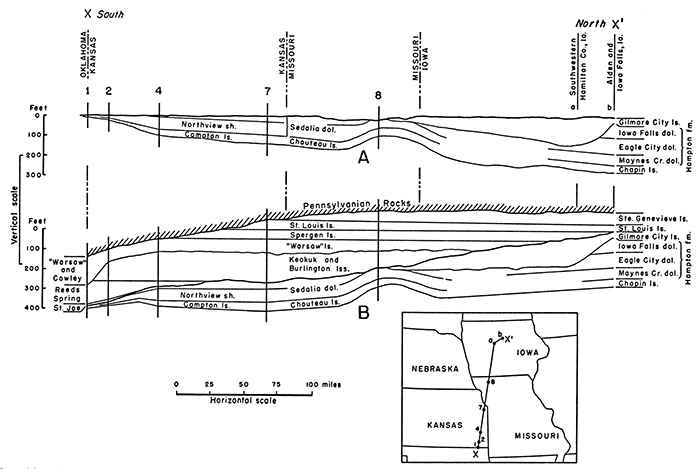
Figure 13 shows the relation of Kinderhookian and younger Mississippian formations west of the Nemaha anticline in the Salina basin. The wells are correlated on the contact between the Reeds Spring and Burlington limestones. It will be noted that the only Kinderhookian limestones represented are the Gilmore City limestone and the upper member of the Sedalia dolomite. The absence of the lower member of the Sedalia and the restricted Chouteau of Moore (1928) (the Compton limestone of southwestern Missouri) is the result of movements before or during Kinderhookian time (not Chattanooga) that raised the area west of the Nemaha axis. This initial movement of the Nemaha anticline confined the older Kinderhookian limestones to the subsiding basin to the east.
As in the area east of the Nemaha axis, the Kinderhookian limestones thicken appreciably toward the north and wedge out toward the south, where outliers of the upper Sedalia member lie unconformably below the Gilmore City or below the St. Joe limestone, as shown in wells 10 and 12 of the cross section of Figure 13. Figure 13 shows that the Osagian formations in this area also thicken toward the south and unconformably overlap the Kinderhookian rocks toward the north. These phenomena reveal subsidence toward the north during Kinderhookian time and beveling at the end of Kinderhookian time, followed by a gradual rising of the surface toward the north during Osagian and Meramecian time in the same sequence of movements as that which affected the area east of the Nemaha anticline.
The distribution of the several formations of the Mississippian is shown in Figures 12A and 12B. The distribution of the St. Joe and Reeds Spring in Figure 12B indicates that these formations overlapped upon the flank of the incipient Nemaha anticline, which seems to have begun the separation of the Forest City and Salina basins as early as Osagian time. Of the Osagian formations, only the Burlington-Keokuk sequence extended across the Central Kansas uplift and the rising Nemaha anticline. The sequence was beveled by post-Mississippian erosion. The greater thickness of the Mississippian limestones below the Short Creek oolite member of the Keokuk (Lee, 1940, p. 63, pl. 6, cross section E-F') east of the anticline than west of it also reveals displacement along the Nemaha axis before the deposition of the Short Creek oolite. There were thus at least two types of deformation going on contemporaneously during Mississippian time: (1) initial movements along the Nemaha anticline, whose maximum development occurred at the end of Mississippian deposition; and (2) progressive tilting of the region from south to north during Kinderhookian time and later tilting in the opposite direction.
Study of a cross section from Meade County to Smith County, Kansas, (Lee, 1953, fig. 2) suggests that minor development of the Central Kansas uplift occurred during or before Mississippian time but that the principal deformation occurred at the end.
Deformation at the End of Mississippian Time
Plate 6 shows the thickness of the Mississippian rocks and the areal geology at the beginning of Pennsylvanian deposition. The principal structural movements at the end of Mississippian time in this area affected the Nemaha anticline, the Central Kansas uplift, the Forest City basin, and the Salina basin.
The deformation of the Mississippian limestones was probably brought about by differential movements during which erosion of the gradually emerging surface kept pace with its elevation. In conformity with this concept, it is assumed that the rocks were beveled by submarine or subareal erosion as fast as they were elevated, that the surface was rarely much above sea level, and that minor beveling was going on intermittently during the whole period of elevation as well as at the end.
Before the invasion of the Pennsylvanian sea the beveled surface was re-elevated, deformed again by differential movement, and subjected to relatively brief and intermittent erosion. A broad shallow valley was eroded on the beveled surface of the Mississippian limestones in the Forest City basin during an early Pennsylvanian period of exposure. In consequence, the expression of structure by thickness lines in that area is modified by topographic relief (Lee, Grohskopf, Reed, and Hershey, 1946, sheets 5 and 6). This valley, which is mainly outside the area under consideration, is revealed by a local thickening of the Pennsylvanian rocks accompanied by a corresponding thinning of the upper Mississippian formations in the same locality.
In the Salina basin local shallow channels or possibly sink holes have been noted. Errors in interpretation of structure due to such topographic irregularities have been eliminated in some degree by including with the Mississippian sequence the cherty conglomerate at the base of the Pennsylvanian, for the top of the conglomerate, which consisted of reworked residual debris, was more nearly level than the eroded surface of the Mississippian. The use of this convention in mapping the thickness of the Mississippian introduces a difficulty as the border of the Mississippian is approached. In areas where the cherty Pennsylvanian basal conglomerate overlaps into areas underlain by rocks older than the Mississippian, its top loses its value as a Mississippian datum. Only those wells in which Mississippian limestone underlies the conglomerate are regarded as significant in estimating the degree of structural movement. The limit of the actual Mississippian is therefore vague where the differentiation of Mississippian residual chert from Pennsylvanian conglomerate becomes uncertain.
The Nemaha anticline is the most striking of the new structural features produced in eastern Kansas by post-Mississippian folding. It extends with varying structural relief from a point near Omaha, Nebraska, southwestward beyond Oklahoma City, Oklahoma. Throughout its length the eastern limb of the anticline is notably steeper than the western limb. The northern end of the anticline was raised so high that the erosional beveling in northeastern Kansas exposed Precambrian rocks on the crest and truncated the pre-Pennsylvanian rocks in parallel belts on its flanks. Toward the south, where the structural relief decreases, the Mississippian limestones were only partly eroded from its crest except at places of exceptional deformation.
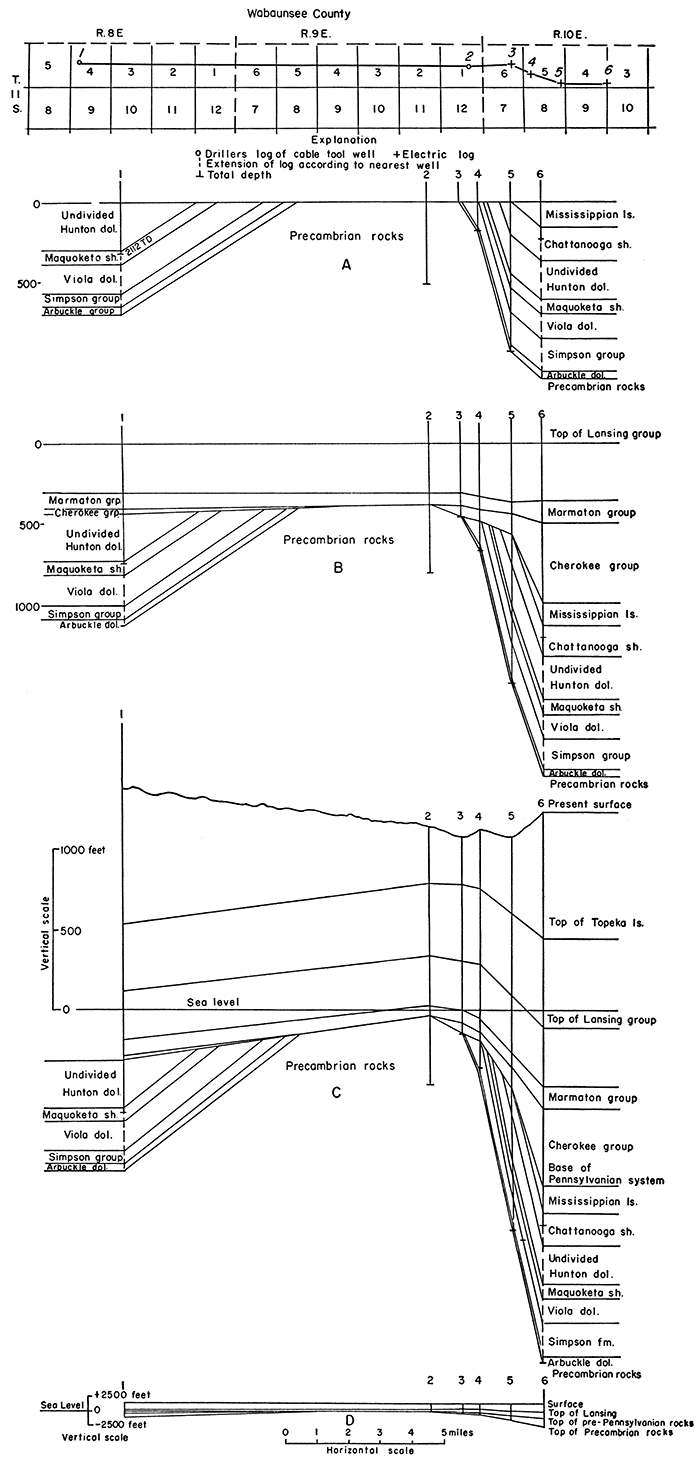
The progressive development of the Nemaha anticline is illustrated in Figure 21, which includes a series of wells drilled by the Amerada Petroleum Corporation in T. 11 S., R. 10 E., at approximately one-mile intervals on the east limb of the anticline. Cross section A shows the arching of the pre-Pennsylvanian formations after post-Mississippian beveling; cross section B shows the deformation at the end of Lansing time, and cross section C the present deformation. The impulse to assume faulting on the east limb of the anticline is checked by redrafting cross section C as cross section D with equal vertical and horizontal scales.
Figure 21--Diagrammatic cross sections in northern Wabaunsee County showing the progressive development of Nemaha anticline on line A-A' of inset. A. Structure after erosional beveling of Mississippian limestones. B. Structure at end of Lansing time. C. Present structure including postCretaceous regional dip. D. Present structure drawn with the same vertical and horizontal scale. [Larger version available as an Acrobat PDF file.]
The Central Kansas uplift, which is outlined on the areal map of Plate 6 by the beveled outcrops of Mississippian and older rocks, was already mildly developed in pre-Mississippian time (Lee, 1953, p. 20, fig. 2) but was vigorously rejuvenated at the end. The Chautauqua arch, which showed only slight movement at the close of Chattanooga time, remained quiescent, although feeble secondary movements parallel to its axis are shown locally by 50-foot thickness lines (Lee, 1939, pl. 1).
Many geologists have assumed that the northeasterly trending Forest City basin and the northwesterly trending Salina basin are the result of the intersection of the North Kansas basin by the Nemaha anticline. The Nemaha anticline strikes across the eastern side of the North Kansas basin (compare Pl. 5 and 6), but neither the Salina basin nor the Forest City basin bears a close relation to the North Kansas basin.
The Forest City basin parallels the Nemaha anticline and lies high on the southeast margin of the North Kansas basin between the Nemaha anticline and the northwestern flank of the contemporaneously re-elevated Ozark uplift (Lee, Grohskopf, Reed, and Hershey, 1946, sheet 5). The only feature common to the Forest City basin and to the North Kansas basin is their position on the northwestern flank.of the Ozark uplift.
The axis of the southern part of the Salina basin is roughly parallel to the northeastern flank of the Central Kansas uplift, but its northeastern limb swings north around the broad northern end of the Nemaha anticline. The Salina basin lies between the Central Kansas uplift and the Nemaha anticline, both relatively new structural features, and it seems probable that a Salina basin would have been formed even had there been no North Kansas basin.
At the end of post-Mississippian beveling, 350 feet of Mississippian limestones survived in the deepest part of the Salina structural basin and 450 feet in the Forest City basin. These thicknesses do not, however, represent the total amount of deformation.
The Salina basin is bounded on the east by the Nemaha anticline, but where the syncline in the southern part of the Salina basin intercepts the Nemaha anticline in southeastern Chase County the continuity of the Nemaha axis is broken. The Salina basin syncline continues weakly to the southeast and fades out in central Greenwood County. The Central Kansas uplift confines the Salina basin on its southwestern side, but between the southeastern end of this uplift and the Nemaha anticline the Salina basin is confined by a broad low arch, shown between the 250-foot thickness lines (Pl. 6). This arch trends northwestward across central McPherson County, and is aligned with the northeastern flank of the Central Kansas uplift.
Northeast-trending folds were formed both east and west of the axis of the Nemaha anticline. The constricted area between the Central Kansas uplift and the Nemaha anticline contains more known northeasterly trending anticlines than any other area in Kansas, and most of them yield oil and gas. The Voshell anticline is the longest and most prominent of the anticlines in the constricted area, but it is cut off toward the north by the Salina basin.
The prominent Abilene anticline, on the northeast side of the Salina basin, is recognized in the surface rocks in Riley County and extends southward into Dickinson County. It resembles the Nemaha anticline in that the beds dip steeply on its southeastern side and very gently to the northwest. Not many subsurface data are available on the Abilene anticline, and the thickness lines have been drawn to conform to the scanty data and with the structure of the surface formations so far as known. The Abilene anticline seems to be interrupted on the south by the Salina basin syncline. Another anticline paralleling the Nemaha axis extends from T. 17 S., R. 3 W., to T. 13 S., R. 2 W., crossing the axis of the Salina basin.
Northwest-trending folds that parallel the Salina basin and the Central Kansas uplift are not clearly revealed by the Mississippian thickness lines of Plate 6. In Chautauqua and Elk counties there is some indication of northwesterly trending folds (Lee, 1939, pl. 1). The exposure of Cambrian and Ordovician rocks in Ellsworth County on the pre-Pennsylvanian areal geology map (Pl. 6) suggests the probability of northwesterly trending folds on the northeastern flank of and paralleling the Salina basin in areas as yet inadequately explored. The major folds that trend northeast parallel to the Nemaha anticline and those that trend northwest parallel to the Central Kansas uplift, although they intersect nearly at right angles, seem to have developed contemporaneously, for the interruption of the Nemaha anticline resulting from the intersection by the Salina basin syncline in Chase and Marion counties persisted into early Pennsylvanian time (Pl. 7).
Faulting--A northeasterly trending post-Mississippian reverse fault, by which pre-Pennsylvanian rocks were displaced downward toward the west, was mapped in the subsurface by Bunte and Fortier (1941, p. 114-115) on the west side of the Voshell anticline in T. 21, 22, and 23 S., R. 3 W. The fault is reported to have a maximum downward throw of about 400 feet on the west, but the displacement at the end of Mississippian time was less. In addition to the fault on the west flank of the Voshell anticline, a reverse fault with a down throw of 66 to 75 feet to the east has been described by Smith and Anders (1951, p. 43-47) on the east limb of the anticline of the Davis Ranch pool. Another reverse fault was drilled in the Davon No. 1 Swart well in sec. 26, T. 3 S., R. 13 E., on the east limb of the Nemaha anticline. The fault has a downward displacement to the east of at least 190 feet as measured by the repetition of the Maquoketa and Viola formations in the electric log.
Deformation During Pennsylvanian and Permian Time
The structural movements that occurred during Pennsylvanian and Permian time have been determined by comparison of thickness maps of four sequences of rocks. The upper and lower surfaces of each sequence were chosen at beds that were (1) originally essentially Hat and horizontal, (2) commonly reported in drillers logs with reasonable accuracy, and (3) spaced at more or less regular intervals. The thickness of each sequence ranges from 750 to 1,000 feet, although there are wide variations in each sequence, owing to contemporaneous structural movements.
The five datum planes used are (1) the top of the Pennsylvanian basal cherty conglomerate, (2) the base of the Hertha limestone at the base of the Kansas City group, (3) the top of the Topeka limestone at the top of the Shawnee group, (4) the base of the Florence limestone member at the bottom of the Barneston limestone of the Chase group of the Permian, and (5) the top of the Stone Corral dolomite of the Sumner group of the Permian. The intervals, thicknesses of which are represented on Plates 7, 8, 9, and 10, are shown diagrammatically in Table 18.
Table 18--Skeletonized columnar section of Pennsylvanian and Permian rocks showing sequences whose thicknesses are represented on Plates 7, 8, 9, and 10.
| Permian System | Leonardian Series | Nippewalla group | ||
| Harper ss. | ||||
| Sumner group | Stone Corral dol. | The thickness of this sequence is shown on Plate 10. | ||
| Wolfcampian Series | Chase group | |||
| Barneston ls. | ||||
| Matfield sh. | The thickness of this sequence is shown on Plate 9. | |||
| Council Grove group | ||||
| Admire group | ||||
| Pennsylvanian System | Virgilian Series | Wabaunsee group | ||
| Severy sh. | ||||
| Shawnee group | Topeka ls. | The thickness of this sequence is shown on Plate 8. | ||
| Douglas group | ||||
| Missourian Series | Pedee group | |||
| Lansing group | ||||
| Kansas City group | ||||
| Hertha ls. | ||||
| Pleasanton group | The thickness of this sequence is shown on Plate 7. | |||
| Desmoinesian Series | Marmaton group | |||
| Cherokee sh. | ||||
| Basal Conglomerate | ||||
| Mississippian System | ||||
The use of the top of the cherty conglomerate at the base of the Pennsylvanian results in some confusion where the Pennsylvanian overlaps upon the surface of pre-Mississippian rocks on the Central Kansas uplift. In such areas an extremely irregular line of zero thickness results. A part of the irregularity is due to erosional relief and to the occurrence of karst topography, as described by Walters (1946, p. 690-699). A part is due to the fact that where the basal conglomerate is represented by non-cherty clastic deposits it has been included with the Pennsylvanian instead of with the Mississippian sequence. The configuration of the zero thickness line as shown on the Central Kansas uplift is therefore generalized.
Deformation Between Top of Pennsylvanian Basal Conglomerate and Base of Kansas City Group
Plate 7 shows the thickness of the pre-Kansas City Pennsylvanian rocks above the Pennsylvanian basal conglomerate. The structural movements revealed by the differences in thickness of the Mississippian limestone (Pl. 6) were generally revived during the deposition of the lower Pennsylvanian rocks, but there were some modifications in their character, particularly on the Nemaha anticline.
Before the advance of the Pennsylvanian sea into Kansas, the postMississippian beveled plain was warped and topographic basins developed east and west of the Nemaha anticline, the crest of which became a low barrier separating the basins. Subsidence of the Forest City basin to the east was continuously greater than in the Salina basin to the west and it was consequently invaded and received Pennsylvanian deposits before the Salina basin. Differential movements kept the crest of the Nemaha anticline above sea level until Marmaton time near the southern border of the Salina basin area and until middle Kansas City time in southeastern Nebraska. During much of this period a long narrow peninsula extended southward from Nebraska into the Pennsylvanian sea and formed a divide between the Forest City and Salina basins, but the surface was probably too low to warrant its designation as a ridge except in a structural sense.
In the deepest part of the Salina basin 400 feet of Pennsylvanian rocks had been deposited before Kansas City time, but in the deepest part of the Forest City basin pre-Kansas City rocks were 1,050 feet thick. The difference in the thickness of the deposits is the measure of the subsidence of the beveled Mississippian surface in the Forest City basin below that in the Salina basin.
Except for outstanding local structures such as the Burns dome and the Elmdale anticline, arching on the axis of the Nemaha anticline was too low to be expressed by 50-foot contours. The renewed activity during early Pennsylvanian time increased the structural displacement on the east flank, and tilted the upraised block slightly toward the west. Plate 7 shows a belt of thinning extending south from western Riley County to northwestern Butler County. This belt of thinning, which is west of the axis of folding, is not a structural feature but the result of the westward migration of the divide between the Salina and Forest City basins caused by erosion during the periods of exposure when the crest of the anticline was above sea level. The Central Kansas uplift also continued to develop and in Hertha time a considerable part of its area was land.
The thickness lines of Plate 7 show the renewed development of the Salina basin along the trend indicated by the greater thickness of the Mississippian limestones. The principal axis of the basin, which extended northwest from Ottawa and Saline counties, remained the same, but the somewhat inadequate data available seem to indicate that the deepest part of the basin had moved about 60 miles northwest to Smith or Jewell County.
The divide in McPherson County that separated the Salina basin from the deeper Sedgwick basin toward the south on Plate 6 is only faintly shown by the thickness lines of Plate 7. The Salina basin interrupts the Nemaha anticline at the same place in Chase County as at the end of Mississippian time (Pl. 6.) The perpetuation of this feature seems to indicate the contemporaneous development of the two intersecting structural features throughout a long period of time. Structural movement during pre-Hertha Pennsylvanian time lowered the surface of the Mississippian limestones in the Salina basin about 450 feet below the crest of the Central Kansas uplift, where Mississippian rocks were removed.
Secondary northeasterly trending folds such as the Voshell anticline were less active than during the period ended by post-Mississippian beveling, and are revealed only locally by 50-foot thickness lines. The data are inadequate to determine the degree of activity of the Abilene anticline with accuracy, but some movement occurred. The extent of the activity of secondary northwesterly trending folds is not revealed by 50-foot thickness lines, but these folds were probably not inactive.
Deformation Between Base of Kansas City and Top of Shawnee Group (Top of TOPEKA limestone)
Plate 8 shows the thickness of the Pennsylvanian rocks between the base of the Kansas City group, in most areas the base of the Hertha limestone, and the top of the Topeka limestone of the Shawnee group. The deformation indicated by the thickness of this. sequence is similar to that revealed in Plates 6 and 7, but of declining intensity. During this time interval downward displacement on the east limb of the Nemaha anticline was only about 300 feet below the crest near the Nebraska-Kansas border and less than 100 feet near the southern border of the area. Continued development of the Burns dome in T. 23 S., R. 5 E., is revealed by a 50-foot thickness line partly encircling its crest, but only minor anticlinal movements, so far as known, affected other local structural features on the Nemaha anticline.
The Voshell anticline is only faintly expressed by 50-foot thickness lines and only in certain areas. Minor movements of less than 50 feet, however, were general along the trend. The available data from wells along the Abilene anticline suggest some activity of this structural feature.
Deformation of the Salina basin declined, and the structural basin of earlier times became a structural embayment. The low structural divide in McPherson County, which originally cut off the Salina basin from the subsiding Sedgwick basin to the south, had no expression during this period and probably became inactive even before the deposition of the Hertha limestone.
The thickness lines on the Central Kansas uplift form a broad bulge and here also reveal a decline of structural activity. The structural relief between the crest of the uplift and the deeper part of the Salina basin directly opposite was only about 200 feet.
Deformation Between Topeka Limestone and Barneston Limestone
Plate 9 shows the thickness of Pennsylvanian and Permian rocks between the Topeka limestone of Pennsylvanian age and the Barneston limestone of Permian age. The sequence transgresses the boundary between the Pennsylvanian and Permian Systems. A low angular unconformity is believed to separate these systems, and it would have been desirable to divide the sequence at or near the contact. Unfortunately a surface of considerable local relief occurs at the contact and, for several hundred feet both above and below the contact, the limestone formations are so thin and so infrequently identifiable in well logs that there is no suitable datum bed for dividing the sequence near the Permian-Pennsylvanian contact. The deformation indicated by the thickness map, therefore, includes movements of both late Pennsylvanian and early Permian age.
The thickness map of this sequence is in most respects similar to Plate 8, but less deformation is revealed, despite the fact that the average thickness of the sequence and probably the elapsed time is greater. Structural activity in the Salina basin continued to decline. The re-entrant shows a lower over-all structural gradient toward the southeast than during the older sequences, although in some areas the local gradient is steeper. The arching of the Central Kansas uplift had nearly ceased, and the thickness lines delineate it as a southeasterly plunging arch on a southeastwardly dipping monocline.
The deformation of the Voshell anticline is shown only at the northern end where a 50-foot contour touches the anticline. Some rejuvenation, however, is revealed at other places along the anticline by thinning that does not amount to the contour interval. Very little control is available on the Abilene anticline, but deformation is vaguely suggested by a few wells and by abrupt deformation of more than 50 feet on its east side in surface formations a short interval above the top of this sequence.
Most of the area in which the entire sequence survives lies west of the Nemaha anticline. The thickness lines therefore do not reveal the activity of this structural feature except toward the south. On the Burns dome the sequence is 55 feet thinner on the crest than on the eastern flank, and on the Eldorado anticline 40 feet thinner on the crest than on the eastern flank of the north end. It is probable that minor movements occurred at this time at other points along the crest of the Nemaha anticline. No abrupt thickening indicating a structural escarpment is evident directly east of either the Burns dome or the Eldorado anticline, but subsidence is shown by irregular thickening of the interval in some wells in the adjacent synclinal area to the east.
Deformation Between Barneston Limestone and Stone Corral Dolomite
Plate 10 shows the thickness of Permian rocks between the base of the Florence limestone member of the Barneston limestone and the top of the Stone Corral dolomite as determined mainly from electric logs. Because of salt flow, the original thickness of the sequence is obscured by the later thickening of the salt in local anticlinal areas and thinning in local synclines, the sum of which amounts in some areas to nearly 100 feet. To eliminate part of these imperfections, the contour interval has been increased to 100 feet, and local abnormalities that seem to result from salt flow have been suppressed. The thickness lines are therefore to be regarded as only roughly significant of regional structure. The Stone Corral was eroded from a large part of the Salina basin before the deposition of the Cretaceous rocks, and in consequence the full thickness of this sequence can be mapped only in the western part of the Salina basin area. The thickness lines show no movement of the Central Kansas uplift. Most of the Salina basin is outside the area of control, but the thickness lines in Osborne, Mitchell, and Lincoln counties do not show the re-entrant that characterized the later stages of the development of the Salina basin as shown on Plate 9.
The cessation of structural activity on the Central Kansas uplift brought to an end a long period of regional arching. Its almost continuous development from St. Peter to early Permian time is recorded by thinning on its crest or beveling on its flank of nearly every mappable unit from Chattanooga to Barneston. Fifty-foot thickness lines of the interval from Chattanooga to Barneston (not shown) reveal no structural activity of the Central Kansas uplift after Barneston time, although minor movements on local northwesterly trending anticlines probably continued or were revived later. The Salina basin, which is first revealed by the thickening of the Mississippian limestones, continued its development with declining vigor into early Permian time and, like the Central Kansas uplift, became essentially inactive shortly after Barneston time.
A structural bench (Pl. 10), trending from Rush and Ellis counties to Lincoln and Ellsworth counties, breaks the regular southward increase in thickness of the Barneston-Stone Corral sequence. The wider spacing of the thickness contours in this area occurs where the Hutchinson salt member is thickest and is the expression of the downwarping that accompanied the development of the salt basin. The thickest salt, marking the greatest subsidence of the salt basin, overlies a part of the crest of the formerly active Central Kansas uplift (Fig. 15).
The structural deformation indicated on Plate 10 shows a regional tilt toward the south. It probably represents a composite of two regional movements; a continuation of southeasterly tilting toward the Ouachita basin until the formation of the salt basin, and a southwesterly tilting that followed the deposition of the salt, revealed a little later by the data of Figure 23A. A southwesterly dip imposed on a southeasterly dip produces a composite southerly dip.
Relation of Pennsylvanian and Early Permian Deformation in Kansas to Ouachita Basin
During Pennsylvanian and early Permian time Kansas formed a part of a structural province comprising Illinois, Kansas, Missouri, Nebraska, Iowa, and parts of Oklahoma and Arkansas, which was dominated by the Ouachita basin of west-central Arkansas and southeastern Oklahoma. This basin extended from east to west and was flanked on the south by contemporaneously rising land. Miser (1934, p. 979) reports 18,000 to 20,000 feet of clastic Cherokee and older Pennsylvanian rocks in the Ouachita basin. This sequence includes 6000 feet of Stanley shale, which is reported by Hass (1951) as of Mississippian age. Compared with these deposits the maximum thickness of Cherokee rocks of approximately 800 feet in the Forest City basin and 200 feet in the Salina basin seems insignificant.
The Nemaha anticline and the Central Kansas and Ozark uplifts. were structural features inherited from pre-Pennsylvanian time but they continued to develop in Pennsylvanian time. The Forest City basin and the Cherokee basin together represent an arm of the Ouachita basin that extended northward between the Ozark uplift and the Nemaha anticline. In a broad sense, particularly after Hertha time, the Salina basin, lying between the Central Kansas uplift and the Nemaha anticline, was also an arm of the Ouachita basin.
Attention has been called in the section on stratigraphy to the decrease in thickness of shale and clastic deposits toward the north and west and the relative regularity of the thicknesses of the limestone formations. All the Pennsylvanian series and groups in eastern Kansas thicken toward the Ouachita basin except where their thickness is modified by local deformation and intercyclical erosion. Most of the thickening occurs in the shale formations and in the shale members of formations in which limestone predominates. Table 19 shows the comparative thickness of limestones and clastic deposits in the wells shown in Figure 22.
Figure 22--Map showing location of wells referred to in Table 19 and their relation to Pennsylvanian structural features.
Table 19--Comparative thickness, in feet, of limestone and clastic beds in groups of Upper Pennsylvanian and Lower Permian rocks in wells shown on Figure 22.
| Map no. |
Well and location | County | Lansing and Kansas City groups |
Douglas group, shale and sandstone |
Shawnee group |
Wabaunsee, Admire, Council Grove, and Chase groups to base of Barneston limestone |
Total, base of Kansas City to base of Barneston limestone |
||||
|---|---|---|---|---|---|---|---|---|---|---|---|
| Ls. | Clastic | Ls. | Clastic | Ls. | Clastic | Ls. | Clastic | ||||
| 1 | E. S. Adkins No. 1 Dater, sec. 14. T, 24 S., R. 8 E. |
Greenwood | 207a | 253 | 295 | 137 | 238 | 256 | 796 | 600 | 1582 |
| 2 | Veeder Supply Co, No. 1 Borth, sec. 29, T.19 S., R. 2 W. |
McPherson | 232 | 158 | 80 | 148 | 322 | 227 | 798 | 607 | 1358 |
| 3 | Lion Oil Co, No. 2 Murray, sec. 18, T. 17 S., R. 10 W. |
Ellsworth | 197 | 93 | 110 | 165 | 110 | 247 | 623 | 609 | 936 |
| 4 | Stanolind Oil and Gas Co. No. 1 Boxberger, sec. 10, T. 14 S., R. 14 W. |
Russell | 146b | 106 | 23 | 183 | 82 | 259 | 561 | 588b | 772 |
| 5 | Harbar Drilling Co. No. 1 Coddlington, sec. 4, T, 10 S., R. 20 W. |
Rooks | 113b | 77 | 10 | 156 | 124 | 213 | 552 | 482b | 763 |
| 2 | Veeder Supply Co. No. 1 Borth, sec. 29, T. 19 S., R. 2 W. |
McPherson | 232 | 158 | 80 | 148 | 322 | 227 | 798 | 607 | 1358 |
| 6 | E. S. Adkins No. 1 Weis, sec. 32, T, 14 S., R. 2 W. |
Saline | 190 | 160c | 175c | 151 | 159 | 228 | 792 | 569 | 1286 |
| 7 | D, W. McLaughlin No. 1 Gravenstine, sec. 21, T. 8 S., R. 6 E. |
Riley | 232 | 63 | 65 | 129 | 116 | 253 | 632 | 614 | 876 |
| a. The Wyandotte and other Kansas City limestones were replaced by shale in this area. b. Thinning of limestones is due in part to overlap of Kansas City upon the pre-Pennsylvanian surface and consequent nondeposition of lower Kansas City limestones. c. Thickening of shales is due to deposition in subsiding Salina basin. |
|||||||||||
Formations that are composed predominantly of limestone can generally be recognized in sample logs and in some drillers logs, but the precise thickness of interbedded shale cannot be determined. The thicknesses of shale and limestone shown in Table 19 were compiled by scaling the electric logs of the respective wells. In order to test the accuracy of the data, some of the electric logs were scaled several times and the measurements compared. The several measurements were found to differ by less than 10 percent.
It will be noted that in general the thicknesses of the clastic beds in Table 19 decrease with the distance from the Ouachita basin and that the aggregate thickness of the limestones of each sequence is singularly constant in the different areas. Some of the deviations from regularity in the thickness of the limestones are caused by the difficulty of scaling the many thin limestones of the electric logs with consistent accuracy. Most of the differences in the thicknesses of the limestones and shales are due to the removal of some of the limestone beds during inter cyclical erosion and their replacement by shale during the next cycle of deposition, as well as to local structural movement that caused deposition of greater or less thicknesses of shale in the areas affected, as on the Nemaha anticline.
In well 1 of Table 19 the Wyandotte and other limestones of the Kansas City group either were eroded during intercyclical erosion and their place occupied by shale Or they graded into shales southeastward toward the source of sediments. In this area the thickness of limestone was thus decreased and that of the shale increased. The abnormal thickness of the shale in well 6, especially in the Douglas group, is probably due to the location of this well in the center of the differentially subsiding Salina basin syncline. In wells 4 and 5, the thinning of the limestones in the Lansing and Kansas City groups is due to overlap and nondeposition of the basal Kansas City rocks on the exposed surface of the Central Kansas uplift.
From the data in Table 19, as well as that included in the discussion of the Pennsylvanian stratigraphy, it seems probable that the limestones were deposited during quiescent periods of the cyclothems in a broad belt beyond the reach of clastic sediments from the southeast, and that in this belt they were deposited with little variation in thickness except toward land areas where they grade into or interfinger with clastics. The shales and sandstones, however, were deposited during periods of differential subsidence. They filled the subsiding basin with material that was worn from contemporaneously rising marginal land areas and distributed by tides and currents. The differential tilting of the border regions of Kansas and states farther east toward the Ouachita basin was the outstanding structural development in the Midcontinent region during Pennsylvanian and early Permian time. The Nemaha anticline and the contemporary structures that seem so prominent in eastern Kansas were scarcely more than ripples on the monoclinal dip into the Ouachita basin.
Late Permian Deformation
During the deposition of the Mississippian, the Pennsylvanian, and the Permian to about Barneston time, southwestern Kansas was a subsiding basin (the Hugoton embayment of the Anadarko basin) on the southwest side of the Central Kansas uplift. It was the counterpart of the Salina basin to the northeast, but the Hugoton embayment was an area of much greater subsidence than the Salina basin. With the deposition of the Hutchinson salt beds, arching of the Central Kansas uplift ceased, but the areas of the Salina basin and Central Kansas uplift began to be tilted as a whole toward the southwest into the Hugoton embayment (Lee, 1953, fig. 2; Lee and Merriam, 1954).
Post-Permian Deformation
The details of deformation during the hiatus between the Permian and Cretaceous rocks of Kansas are only partly known. In northwestern Kansas the Permian is overlain unconformably by the Morrison formation of Jurassic age. During the hiatus that separates them, deposition and erosion of Triassic sediments occurred in other areas. The effect of these events on the structure of the Salina basin is quite unknown.
The Morrison formation, of Jurassic age, was deposited on the eroded surface of the Permian in an erosional and structural basin in Colorado. The deposits now reach eastward to the western border of Phillips County, but they must originally have extended farther east. The effect of pre-Morrison as well as Triassic deformation on the Salina basin area is problematical, for during the hiatus that preceded Cretaceous deposition rocks of Jurassic age, if ever present, were eroded away. By the beginning of Cretaceous time the westerly inclined Permian rocks had been roughly truncated. The surface sloped gently westward with local relief of 50 feet or more.
Figure 23A (after Lee and Merriam, 1954, pl. 3) shows the preDakota structure of the Stone Corral dolomite in western Kansas by 100-foot thickness lines of the sequence between these beds. The map records the deformation that had been imposed on the Stone Corral when the level surface of the Dakota was yet undisturbed.
Figure 23--Generalized structure maps of western Kansas (after Lee and Merriam, 1954), showing late regional deformation of western Kansas. A. Shows by 100-foot thickness lines the southerly pitch of Hugoton embayment syncline at horizon of Stone Corral dolomite when Dakota formation was still un deformed (based on thickness of sequence between these beds). B. Shows by 200-foot contours the present structure of Dakota formation. Northerly post-Dakota dip was imposed on older rocks. C. Shows by 200-foot contours the present structure of Stone Corral dolomite as result of post-Dakota deformation. [Larger version available as an Acrobat PDF file.]
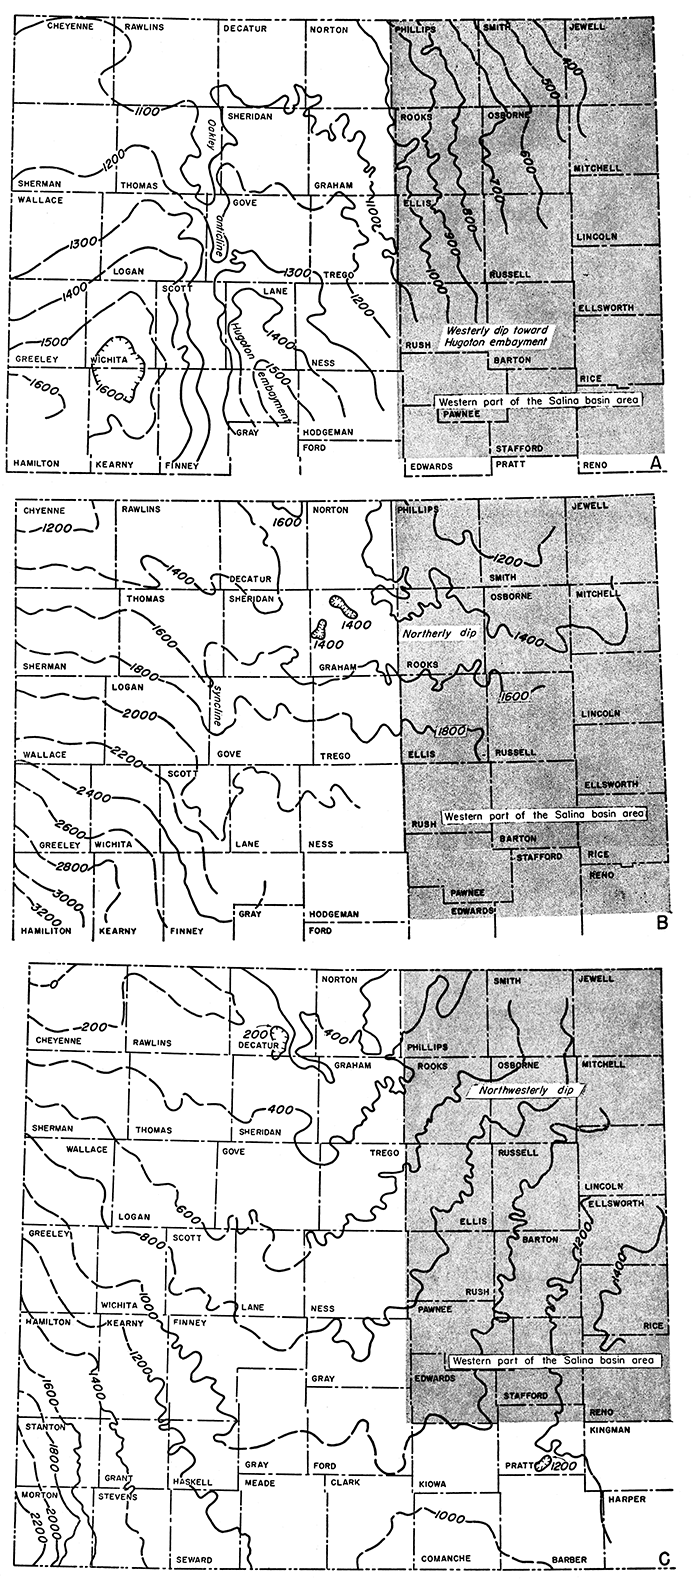
This map shows the southerly plunging Hugoton embayment syncline flanked by a southerly trending local anticline. The structure is a composite of the deformation that modified the Hat surface of the Stone Corral not only during late Permian time but also during Triassic, Jurassic, and pre-Dakota Cretaceous time. The synclinal warping was mainly a continuation of the movements that developed the Hugoton embayment. The effect of these movements on the Salina basin was to give the Stone Corral in that area a westerly inclination of 8 to 10 feet per mile.
Post-Cretaceous Deformation
Figure 23B (after Lee and Merriam, 1954, pl. 2) shows the present structure of the Dakota sandstone in western Kansas by 200-foot contour lines. It is a composite of all the movements that have altered the essentially level surface of the Dakota during later Cretaceous time, during the Tertiary, and during the Quaternary.
Figure 23C shows the present structure of the Stone Corral dolomite by 200-foot contours. It represents the structure of the Stone Corral of Dakota time (Fig. 23A) modified by the postDakota structure (Fig. 23B). The result of these movements was to tilt the region northward toward basins in Nebraska. The northerly tilt reversed the pitch of the Hugoton embayment at the horizon of the Stone Corral (Fig. 23A) to the northerly pitch shown in Fig. 23C. In the deeper rocks, in which the structure of the Hugoton embayment was more pronounced, the northerly tilt reduced but did not destroy the southerly plunge.
Until Dakota time, the Stone Corral in the Salina basin and probably in other areas in northeastern Kansas seems to have been tilted westward on the eastern flank of the Hugoton embayment at the rate of 8 to 11 feet per mile (23A). The effect of post-Dakota deformation (8 to 10 feet per mile to the north, Fig. 23B) was to give the Stone Corral of the Salina basin area a dip of about 8 feet per mile toward the northwest (Fig. 23C).
Details of the post-Cretaceous structural history of the Salina basin are recorded in Kansas by a series of terrestrial deposits of Tertiary and Quaternary age laid down on the eroded surface of the older rocks and also by a series of dissected alluvial benches along the major streams as yet imperfectly related to regional structural movements. Among the latest post-Cretaceous movements is that resulting in the present elevation of the Cretaceous rocks. Chalk beds approximately correlatives of the Smoky Hill chalk occur at river level in southeastern Missouri but at elevations of more than 2000 feet above sea level in Gove County and other areas in western Kansas.
Plates 11 and 12 show the present attitude of the rocks along the lines X-X' and Y-Y' of inset maps. The exaggerated vertical scale of these cross sections distorts the dip of the formations. The true rate of dip in feet per mile is shown by the insert diagrams.
Relation of Structural Development of the Region to Accumulation of Oil and Gas
As has been shown in the preceding pages, the present attitude of the rocks of the Salina basin is the result of conflicting structural movements that occurred at several different times. The folding was brought about in the main by minor increments of deformation. Each new structural movement modified the previous structure by warping and tilting the rocks in the same or different directions. The closure of some anticlines of low relief was greatly reduced and in some folds the position of the crest in the surface rocks was shifted by later regional tilting (Lee and Payne, 1944, p. 70, fig. 12, p. 79). When the original dips of an anticline are less than a subsequently imposed regional dip, the anticline may be reduced to a structural nose in surface formations. In a somewhat similar way, an anticline in an upper sequence of rocks may overlie an unconformable sequence of rocks whose regional dip is too great to show closure (Lee, 1943, p. 128-133); this is one explanation of the so-called "loss of closure" in drilling into deeper rocks. Local thickening of salt beds by flow toward anticlinal areas also reduces the expected amount of closure in older rocks.
The movements of fluids in the rocks toward structural and stratigraphic traps must have been facilitated by the numerous structural adjustments by which both the local and regional structure were developed. These structural movements brought about many periods of exposure and erosion, and it is probable that with each re-elevation of the rocks above sea level the connate water escaped or was redistributed and that migration of nascent oil and gas was materially affected by the erosion of the rocks as well as by the intermittent changes of elevation. Thus any consideration of the time and manner of the accumulation of oil and gas and their subsequent adjustment in the positions in which they are now found must take into account the geologic history of the rocks in which they are trapped.
The accompanying maps show the areal distribution of the formations at different periods and indicate the areas from which well-known productive zones have been eroded and will not be found in drilling. The maps and the cross sections show also the belts of overlap and beveling along which conditions are favorable for stratigraphic traps if the beveled edges of the rocks are porous and structurally closed.
The structural deformation that occurred prior to St. Peter time was not accompanied, so far as known, by the accumulation of oil and gas. So few wells have been drilled through the pre-St. Peter sedimentary sequence, however, that local structures are completely unknown, and the regional structural Features are revealed only in the most general way. Any local anticlines that may be present in the pre-St. Peter rocks may not correspond in location or character to the structural features of the younger rocks. The pre-St. Peter sedimentary rocks are productive of oil and gas on the Central Kansas uplift and in some places on the Chautauqua arch in Montgomery County and adjoining areas of southeastern Kansas. In these areas the anticlines in which the oil is found trend west and northwest at right angles to the structural axis of known pre-St. Peter features, and their development may have begun between St. Peter and Mississippian time, when a broad regional anticline extended west from the Ozarks as the Chautauqua arch and continued northwest to the area where initial movements of the Central Kansas uplift were developing.
Local structural features parallel to the Chautauqua arch are not known, however, to have been developed until the end of Mississippian time, when productive anticlines trending parallel to this fold were formed in Montgomery and adjacent counties (Lee, 1939, pl. 1). Minor anticlines are expressed by the thinning of Mississippian rocks. These folds are not strongly developed and, although there is no direct evidence, they are believed to represent the rejuvenation at the end of Mississippian time of folds originally formed during the development of the Chautauqua arch.
The Central Kansas uplift itself was only slightly developed before the end of Mississippian time, when the major uplift occurred. It reached its period of maximum deformation before Hertha time, and continued to develop with declining intensity through late Pennsylvanian and early Permian time until the downwarping of the salt basin. Most of the productive anticlines on the uplift trend northwest. The date of the first movements of the anticlines cannot now be determined, because the area was stripped of pre-Pennsylvanian rocks by successive periods of exposure and erosion. Such folds were probably being developed at the end of Mississippian time contemporaneously with the Salina basin.
During the development of the northwesterly trending Salina basin, the Nemaha anticline and other structural features trending east of north were initiated and continued to develop contemporaneously with the northwest-trending folds. Northeasterly trending folds are prominently revealed on the thickness map of the Mississippian, but only the most prominent anticlinal movements are revealed by 50-foot thickness lines after Hertha time. It is noteworthy that most of the oil from anticlines paralleling the Nemaha axis has been produced in the constricted area between the Central Kansas uplift and the Nemaha anticline.
Too few wells have been drilled in the Salina basin to permit any definite conclusions, but it seems probable that northwesterly trending anticlines will be found paralleling the Central Kansas uplift.
The central and northern part of the Salina basin have not been adequately tested. Only a few wells have been drilled on the Abilene anticline. A small amount of low-gravity oil in one well on the part of the anticline in Clay County (sec. 21, T. 9 S., R. 4 E.) shows that oil occurs on the northeastern side of the Salina basin. The offsets of this well, however, were all dry. In an effort to determine the subsurface structure of this anticline, the surface structure was recontoured, eliminating the post-Permian regional tilting. The structure as thus, restored revealed a considerable shift in the position of the low crest on the axis of the present anticline.
Prev Page--Stratigraphy--Cretaceous to Quaternary || Next Page--References
Kansas Geological Survey, Geology
Placed on web Jan. 5, 2017; originally published Dec. 1956.
Comments to webadmin@kgs.ku.edu
The URL for this page is http://www.kgs.ku.edu/Publications/Bulletins/121/04_struct.html