Oil and Gas Well Statistics for Kansas
Tables updated: April 1, 2021
View Current Year
View 2020-2024
View 2017-2020
View 2013-2016
| 2017 | 2018 | 2019 | 2020 | |
|---|---|---|---|---|
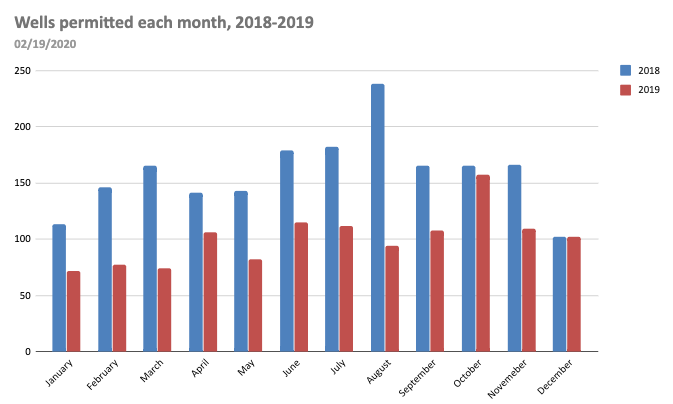
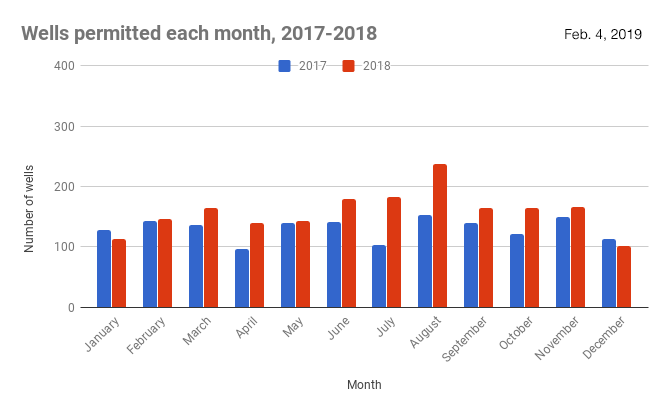
| Wells permitted | 1,561 | 1,905 | 1,208 | 557 |
| New oil wells drilled | 789 | 1,074 | 649 | 290 |
| New gas wells drilled | 32 | 37 | 36 | 11 |
| Dry holes drilled | 315 | 327 | 313 | 119 |
| Service wells drilled | 386 | 323 | 289 | 202 |
| Suspended wells drilled | ||||
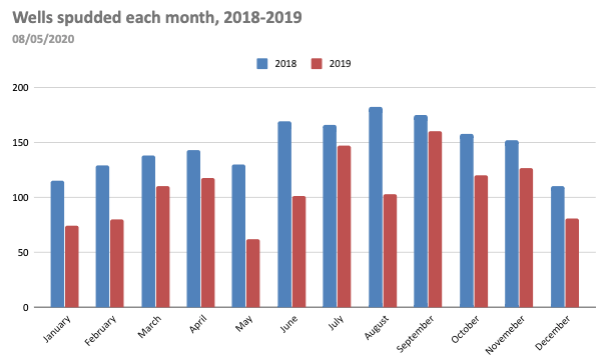
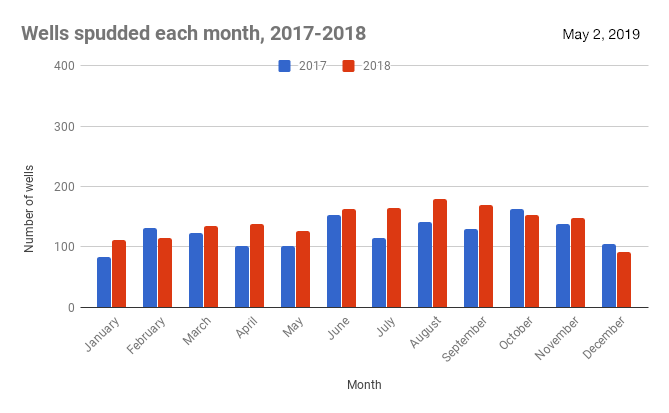
| Total New Wells Drilled |
1,527 | 1,770 | 1,291 | 626 |
| Total New Footage Drilled |
4,197,090 | 5,024,326 | 4,214,326 | 1,760,221 |
| Coalbed methane well permits issued |
0 | 1 | 0 | 0 |
| Coalbed methane wells drilled |
0 | 1 | 0 | 0 |
| Horizontal wells permitted |
19 | 26 | 18 | 2 |
| Horizontal wells drilled |
18 | 33 | 17 | 8 |
| Number of wells (as of update date) |
|
|---|---|
| Total Producing oil wells | 68,449 |
| Total Producing gas wells | 24,610 |
| Total Producing coalbed methane wells | 4,372 |
| Total SWD or INJ wells | 5,333 |
| Total EOR wells | 8,742 |
| Records in our Master List | 490,966 |
| Total Count of Wells | 448,804 |
Intents vs Crude Oil Price
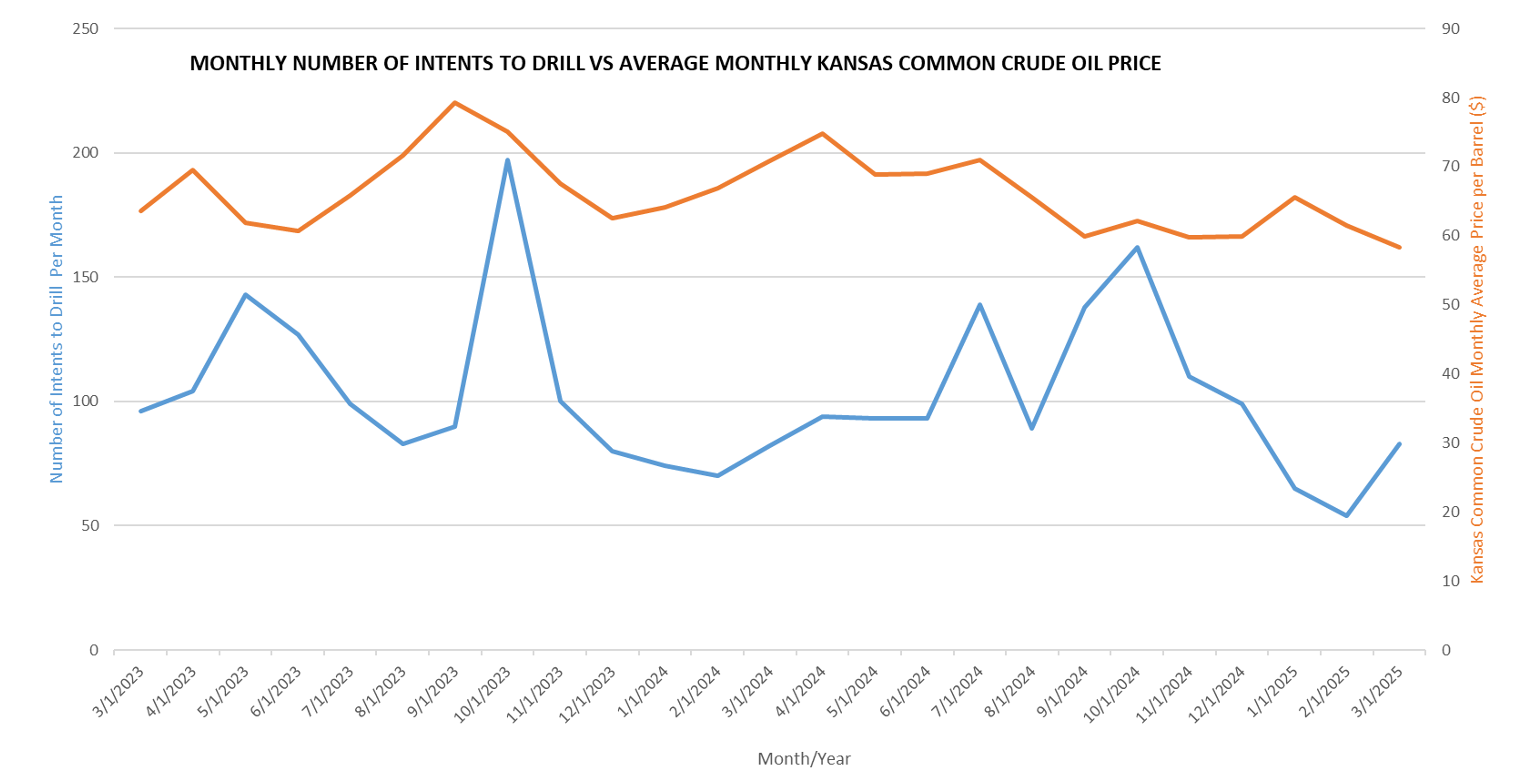
Sources: Coffeyville Resources Refining and Marketing, and KGS
Notes on methods
Oil wells are those with a well status of "OIL", "O&G", "OIL-P&A", or "O&G-P&A". Gas wells are those with a well status of "GAS", "CBM", "GAS-P&A", "CBM-P&A". The "-P&A" flag means the well was completed successfully but has since been plugged. Service wells are those with a well status of "CATH," "EOR," "SWD," or "WATER."
Dry holes are those with a well status of "D&A".
Permitted coalbed methane wells are those for which we have a permit date within the desired year. Wells drilled may have been permitted in a previous year. Expired permits will often be changed from "CBM" to "LOC" at some point. Workovers are not included in CBM counts.
We have no information in our database on how an oil well is producing (flowing or artificial lift).
Total wells producing is calculated by adding all the wells with valid completion dates or spud dates and no plugging dates. Only wells with no workover code are counted, but a certain percentage of older wells are plugged but do not have a plugging date.
Horizontal wells listed are based on a digit present in second place of the workover code (i.e. '-0100','-0101','-0200', etc.). As with the other searches, a well is listed as drilled once we have a spud date in the database. Sometimes the status will be upgraded to drilled or completed before we have the date available.
"Records in our Master List" is a count of every Kansas record in our list of wells; can include highway test holes where core or cuttings were taken, water wells where electric logs were run, and so on. "Total Count of Wells" is a count of records where they do not appear to be workovers and the type of well is related to the oil and gas industry.