Kansas Geological Survey, Open-file Report 2000-44
Part of the Upper Arkansas River Corridor Study
KGS Open File Report 2000-44
A Report to the Kansas Water Office, Contract No. 00-113
A Kansas Water Plan Project
Problem
Objectives and Scope of Work
Location and Description of Study Area
Quality of Arkansas River Water in Southwest Kansas
Field Measurement and Sampling Programs
U.S. Geological Survey
Kansas Department of Health and Environment
Upper Arkansas River Corridor Study
Chemical Characteristics of Arkansas River Water
Major constituents
Total dissolved solids
Specific conductance
Relationship of specific conductance and total dissolved solids
Relationship of specific conductance and major dissolved constituents
Other physical and chemical properties
Minor and trace constituents
Temporal Variations in the Quality of Arkansas River Water
Variations with River Flow
Long-Term Salinity Increases
Spatial Variations in the Quality of Arkansas River Water
Recent Variations
Historical Variations
Sources of Salinity in Arkansas River Water Entering Kansas
Sources of Salinity in Arkansas River Water in Kansas
Usability of Arkansas River Water in Southwest Kansas
Water Quality Relative to Drinking-Water Standards
Water Quality Relative to Aquatic Life Standards
Water Quality Relative to Agricultural Uses
Appendix A. Kansas Geological Survey analyses of Arkansas River water
Appendix B. Chemical data compiled for the Arkansas River near Coolidge
Susan Stover, Gerald Hargadine, and Thomas Stiles of the Kansas Water Office (KWO) assisted in coordination of activities related to the study contracts and review of documents that led up to this report.
Appreciation is expressed to Eric Hargett, Jeff Lanterman (now with the Kansas Department of Health and Environment), and Julie Grauer of the Upper Arkansas River Subbasin Water Resources Management Program and Larry Gennette of the Garden City Office, Division of Water Resources, Kansas Department of Agriculture (DWR) for sampling and determining the conductivity of Arkansas River waters as part of cooperative investigations of Arkansas River water quality. Staff of the Southwest Groundwater Management District No. 3 (Steve Frost, Manager) and Southwest Kansas Local Environmental Planning Group (Diane Coe, Director) sampled the Arkansas River during 1995. Georgia Shrauner of the Division of Plant Health, Kansas Department of Agriculture, also assisted in sampling the Arkansas River in 1995. Staff of the Southwest District Office (Don Ubel, Administrator) of the Kansas Department of Health and Environment collected a few samples of Arkansas River water during flow in July and August, 1995 at Dodge City. Mark Rude, Water Commissioner of the Garden City Field Office of the Division of Water Resources, Kansas Department of Agriculture, provided general information for the study. Gerald Hargadine of the Kansas Water Office participated in the August 7-8, 1995 field trip during which Donald Whittemore sampled the Arkansas River.
Lawrence Hathaway, Truman Waugh, and L. Michael Magnuson of the analytical services group of the Kansas Geological Survey (KGS) analyzed the water samples collected for the study. Jeffrey Schloss, Data Manager of the Geohydrology Section at the KGS assisted in obtaining data for the project.
The reviews of Susan Stover of the KWO and Eric Hargett of the DWR are appreciated and were used to revise the report.
This report describes the water quality of the Arkansas River in southwest Kansas and includes the chemical data for river water samples collected and analyzed for the Upper Arkansas River Corridor Study. The study is a Kansas Water Plan project conducted for the Kansas Water Office during 1995-2000. The study area comprises the Arkansas River corridor in Hamilton, Kearny, Finney, Gray, and Ford counties. The main problem is the contamination of ground waters in the alluvial and High Plains aquifers by saline waters of the Arkansas River that enter Kansas from Colorado.
The salinity of the river water entering Kansas derives from substantial concentration of natural sources of dissolved solids in the river water and alluvial ground waters by consumptive loss of water to evapotranspiration in Colorado. Dissolved solids contents in low flows of the Arkansas River water can exceed 4,000 mg/L at the Colorado-Kansas state line. The major dissolved constituents in Arkansas River water, in the order of decreasing mass concentrations that usually occur, are sulfate, sodium, bicarbonate, calcium, magnesium, chloride, and silica. Sulfate concentration has ranged from 700 to 2,600 mg/L and averaged between 1,900 and 2,000 mg/L during the last couple of decades. The range in chloride content has been about 40-200 mg/L during that period. The water is usually extremely hard. Fluoride and boron can exceed 1.0 and 0.75 mg/L, respectively the maximum limits recommended for irrigation water, in saline low flows. Selenium usually exceeds 5 µg/L, the chronic toxicity level for aquatic life. Nitrate concentrations are always relatively low (usually 1-3 mg/L as nitrate-nitrogen). The relationships between specific conductance and dissolved solids, sulfate, sodium, calcium, magnesium, chloride, nitrate, fluoride, and boron concentrations are all highly significant and can be used to estimate the concentrations of these substances to varying degrees of accuracy.
The dissolved solids and sulfate concentrations of Arkansas River water entering Kansas often reach a maximum of 4,200-4,500 mg/L and 2,500-2,600 mg/L at flows near 100 cfs and below. The precipitation of gypsum in soils from saline river water used for irrigation in Colorado limits the sulfate and dissolved solids contents of the irrigation return flows that contribute to the high salinities. The chloride concentration is not generally limited by mineral precipitation in the return flows and is a better indicator of the extent of concentration of the river waters by evapotranspiration losses. The salinity of river water at the state line decreases with increasing river discharge at flows greater than 200 cfs. However, even the highest flows that have occurred during the last decade have been saline.
The salinity of the Arkansas River in eastern Colorado began to increase soon after the start of substantial irrigation diversions. Since the start of continuous records of both water quality and discharge at the state line in 1963, the salinity of Arkansas River water has continued to increase. The increases are reflected both as fewer occurrences of dissolved solids and sulfate concentrations substantially below the maximum limitation by gypsum precipitation in flows less than about 150 cfs, and by higher salinities in flows greater than this discharge. The past increases were caused mainly by the increased consumption of water leaving the residual salts in a smaller water volume. More recent salinity increases are probably mainly the result of flushing salts accumulated over decades in soils and shallow ground waters in the area irrigated by river water in Colorado. Assuming consumption remains nearly constant in the future, future salinity changes will depend on climatic changes and on whether the mass flow rate of dissolved solids into Kansas has increased to the level of the salt accumulation rate in Colorado.
After entering Kansas, the salinity of Arkansas River water does not change significantly as it passes through southwest Kansas. Most of the current spatial variations in the salinity within southwest Kansas are due to the differences in quality at the state line that are transferred downstream. The average river salinity in southwest Kansas prior to surface-water and ground-water irrigation in Colorado and Kansas is expected to have decreased downstream as a result of dilution by freshwater discharge from the High Plains aquifer. Substantial declines in the water levels of the High Plains aquifer, particularly since the 1970's, changed the average flow condition from one of ground water discharging to the river to one in which river water recharges the aquifer. As ground-water level declines in the High Plains aquifer extended from the Kearny-Finney counties area eastward along the river corridor in southwest Kansas, the location where the dilution was significant slowly moved farther downstream. Today, the dilution point is east of Dodge City.
The Arkansas River in southeastern Colorado and westernmost Kansas is one of the most saline rivers in the United States. Diversion of water for irrigation and evapotranspiration in Colorado have substantially decreased the flow and greatly increased the salinity of the river waters entering Kansas. In addition to salinity, the concentrations of many other dissolved constituents in the river water are high.
Ground-water levels have declined in the High Plains aquifer in southwest Kansas due to decreased recharge from the Arkansas River and pumpage from the aquifer. Arkansas River flow that enters Kansas from Colorado is lost between the state line and Dodge City because of infiltration through the streambed, diversion from the river for irrigation, and evaporation. Saline water from the river and from irrigated fields is infiltrating to and contaminating the ground water in the alluvial and High Plains aquifers in the upper Arkansas River corridor. Ground-water declines in the High Plains aquifer have also decreased the amount of fresh subsurface flow to the alluvium that diluted salinity and other constituent concentrations in the past. Another ground-water quality problem in the upper Arkansas River corridor is increasing nitrate concentrations. Municipal ground-water supplies that are or may be impacted by salinity and nitrate contamination include those for Syracuse, Lakin, Deerfield, Holcomb, Garden City, Cimarron, and Dodge City.
The distribution of salinity and the mechanisms for its entrance into and movement within the High Plains aquifer were not well known before this study. An assessment of the sources, migration, present distribution, and possible future extent of the ground water contamination is critical for developing plans for minimizing or mitigating ground-water quality problems in the river corridor. The Upper Arkansas River Corridor Study was developed to provide information regarding salinity within the Arkansas River and associated aquifers within the study area to enable agencies, municipalities, agriculture, and industries in the region to better manage water resources in order to minimize or mitigate water-quality problems.
The basic objectives of the study comprise major parts of the objectives listed under the water-quality and ground-water decline issues in the subsection on the Arkansas River Corridor Subbasin in the Upper Arkansas Basin section of the Kansas Water Plan:
The study was proposed as a 5-year plan in which the Kansas Geological Survey (KGS) would design and conduct hydrogeological and geochemical investigations in cooperation with several local and state agencies. This report addresses objectives related to the water quality of the Arkansas River within the study area. The particular objectives discussed within this report include:
Knowledge of the chemical characteristics of the Arkansas River is necessary for determining the salinity origin, the usability of the water, the quality of recharge as it affects ground-water quality, the impact on aquatic ecosystems, and the regulation of chemical loads from anthropogenic activities. The emphasis in this report is on the first three subjects.
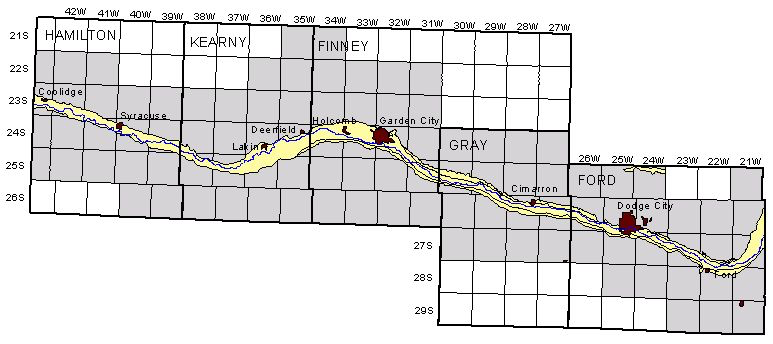
The study area includes the Arkansas River corridor from the Colorado state line through Hamilton, Kearny, Finney, Gray, and Ford counties (Figure 1). The area includes the Intensive Groundwater Use Control Area (IGUCA) of the upper Arkansas River valley, the portions of Hamilton, Kearny, and Finney counties that use ditch irrigation, the Garden City Study Area of the Division of Water Resources, and a buffer zone outside of these areas. The buffer zone was selected to include freshwaters in the High Plains aquifer just outside of the area affected by salinity. The study area lies within the High Plains region of the Great Plains physiographic province. There are no substantial tributaries to the Arkansas River from Hamilton County eastward to the middle of Ford County. Mulberry Creek joins the Arkansas River in eastern Ford County near the town of Ford.
Figure 1--Location of the area of the Upper Arkansas River Corridor Study within the 5-county region. The study area is shaded.
U.S. Geological Survey
The U.S. Geological Survey (USGS) collected water samples for chemical analysis of inorganic constituent concentrations from the Arkansas River near Coolidge for many years (Table 1). However, the number of samples generally decreased after 1981 such that only about 4 or 5 samples were obtained each year. In 1995, the USGS discontinued collecting samples from the river near Coolidge as a part of the overall reductions across the United States in stations funded primarily from direct USGS Congressional appropriations (Mason and Yorke, 1997). The USGS maintained the Coolidge site as a National Stream-Quality Accounting Network station. In this program, the USGS analyzed samples for major chemical properties, major, minor, and selected trace inorganic constituents, and sediment. The USGS also analyzed some water samples from the Coolidge station for many pesticides for a few years. They also periodically collected chemical-quality data for Arkansas River waters at Dodge City for a period of about 16 years that ended in 1977. They collected occasional samples from the river at Syracuse and Garden City for studies during the 1960's and 1970's. The periods of record are summarized in Table 1.
Table 1--U.S. Geological Survey stations in the study area with chemical-quality data for inorganic constituent concentrations in water samples collected from the Arkansas River.
| Station name | Station number |
Legal location | River mile |
Period of record for water samplesa |
|---|---|---|---|---|
| Arkansas River near Coolidgeb |
07137500 | 23S-43W-26BAB | 1099.3 | 1963-1995b |
| Arkansas River at Syracuse |
07138000 | 24S-40W-18BDB | 1080.9 | Sep 1969 Oct 1970 May 1971 Oct 1971 Jun 1974 - Oct 1974 |
| Arkansas River at Garden City |
07139000 | 24S-32W-19BDB | 1024.2 | Jun 1964 Jun 1965 |
| Arkansas River at Dodge City |
07139500 | 26S-25W-35BCC | 970.9 | Oct 1961 - May 1977 Apr 1987 - May 1987 |
|
a If a period is not indicated, only one sample was collected for the month. b Only one or two samples were analyzed during a few of these years. |
||||
The USGS measured specific conductance in one or more water samples per year at some discharge gaging stations as a part of their studies in the upper Arkansas River valley in the 1960's to early 1980's. They made some measurements when samples were collected for suspended sediment or other quality characteristics such pH, dissolved oxygen and severity of appearance factors, for example, oil and grease, odor, and floating debris. In the fall of 1985, the USGS started measuring pH and specific conductance during visits to Kansas gaging stations to measure river depths, widths, and flow velocities to revise rating curves of stage/discharge relationships. Formerly, they had measured only water temperatures for many years during the rating-curve measurements. The number of measurements varies from station to station and from year to year depending on the frequency of field visits necessary to maintain accurate rating curves. For example, they usually only make one measurement each year at the Frontier Ditch station, whereas they may make 6 to 8 measurements at the Coolidge gaging station. Table 2 lists the gaging stations in the upper Arkansas River valley with specific conductance data since 1964.
Most of the chemical and specific conductance data are printed in the annual USGS reports of water resources data for Kansas. The data are also available in digital form from the USGS or from the STORET system of the U.S. Environmental Protection Agency. Some older, miscellaneous data for sample analyses are only available in USGS reports.
Table 2--Federal gaging stations with specific conductance data in addition to those for samples collected for inorganic analysis since 1964 in the Arkansas River corridor study area. The number of measurements for each year usually varies from one to several.
| Station name | Station number |
Legal location | River mile |
Period of record |
|---|---|---|---|---|
| Frontier Ditch near Coolidge |
07137000 | 23S-43W-21ADC | - | 1986 - present |
| Arkansas River near Coolidgea |
07137500 | 23S-43W-26BAB | 1099.3 | Nov 1963 - Sep 1968 Jan 1976 - Sep 1981 |
| Arkansas River at Syracuse |
07138000 | 24S-40W-18BDB | 1080.9 | Oct 1975- Oct 1981 Apr 1983-present |
| Arkansas River at Kendall |
07138020 | 24S-39W-25DCC | 1066.7 | Jun 1979 Apr 1980 |
| Arkansas River at Garden City |
07139000 | 24S-32W-19BDB | 1024.2 | Oct 1984; Jun 1985 Apr 1987 - presentb |
| Arkansas River at Dodge City |
07139500 | 26S-25W-35BCC | 970.9 | Oct 1974 - Jun 1977a Jan 1986 - presentb |
| Mulberry Creek near Dodge City |
07139800 | 28S-25W-24B | - | Aug 1977; May 1978 May 1979 |
|
a Daily values for when river flow was sufficient for obtaining measurements. b Some years are missing values because flow was so low that rating curve measurements were not made. |
||||
Kansas Department of Health and Environment
The Kansas Department of Health and Environment (KDHE) has collected samples from the Arkansas River for many years (Table 3); chemical analyses include determination of pesticides as well as inorganic constituents. A water sample is currently collected by KDHE every two months when water is flowing at the sampling station. The data exist in digital form in the STORET system of the United States Environmental Protection Agency (US EPA). Discharge values taken from the USGS usually accompany the KDHE chemical quality data in STORET.
Upper Arkansas River Corridor Study
Although the first year of support by the Kansas Water Plan for the Upper Arkansas River Corridor Study was FY 1996, the KGS started selected collection of Arkansas River waters in 1993 to provide preliminary data for the study. Other state and local agencies, including the Division of Water Resources (DWR) of the Kansas Department of Agriculture (KDA), Groundwater Management District No. 3, Southwest Kansas Local Environmental Planning Group, Division of Plant Health of the KDA, and the KDHE have also collected river water samples for the study in cooperation with the KGS (Table 4). The samples represent both low-flow and high-flow conditions, including the high-flow event of the summer of 1995.
Table 3--Kansas Department of Health and Environment stations in the study area with chemical-quality data for Arkansas River waters.
| Station name | KDHE station no. |
Legal location | Period of record for water samples |
|---|---|---|---|
| Arkansas River near Coolidge |
000223 | 23S-43W-26BAB | Jul 1967 - Sep 1981 May 1983 - present |
| Arkansas River near Deerfield |
000598 | 24S-35W-14ACB | Apr 1990 - present |
| Arkansas River at Pierceville |
000286 | 25S-31W-13CCC | Dec 1973 - Apr 1977; Aug 1979 Apr 1980; Apr 1986 Oct 1987 - Jun 1990 Jul 1995 - present |
| Arkansas River near Garden Cityb |
002009 | 25S-31W-13CCC | Jun 1972c; Apr 1975c |
| Arkansas River near Dodge Cityd |
000285 | 27S-24W-13BCC | Jun 1972a; Apr 1975a Dec 1973 - Sep 1981 May 1983 - May 1987e May 1987 - Nov 1989 |
| Mulberry Creek near Dodge City |
000700 | 27S-22W-32BDD | Oct 1994 |
| Arkansas River near Ford |
000594 | 27S-22W-31DCD | Apr 90 - present |
|
a If a period is not indicated, only one sample was collected
for the month unless otherwise noted. b The sample location is essentially the same as the Pierceville station. The difference in the latitude-longitude location from the Pierceville location suggests that the sample site may have been downstream of the bridge south of Pierceville rather than upstream. c Several samples were collected during the month. d The sample location is at the bridge two miles southeast of Fort Dodge. e Only one sample per year. |
|||
Starting in 1997, the DWR began a cooperative program with the KGS for periodic field measurements of specific conductance and collection of Arkansas River waters at selected sites. The sample sites included the Arkansas River at Holly, Colorado and Cheyenne Creek near where it enters the Arkansas River just west of the Colorado-Kansas state line. The sampling program was initiated to supply additional data for the study and in response to the request of Kansas ditch companies for additional water-quality data. The program also helped offset the discontinuance of the USGS sampling of the river at the station near Coolidge during this study. The KGS provided a specific conductivity meter to the DWR for the conductance measurements. The DWR or the KGS transported or shipped the samples to the KGS chemical laboratory for analysis.
Table 4--Sample location and period for Arkansas River and Cheyenne Creek waters collected for this study by the Kansas Geological Survey and other agencies and analyzed at the Kansas Geological Survey. The sample sites for the Arkansas River at Holly and Cheyenne Creek are in Colorado. All the other sites are in Kansas. Additional information on the sample locations and specific sample dates are in Appendix A.
| Station name | Legal location | Year and number of water samples |
|---|---|---|
| Arkansas River at Holly | 23S-42W-14CCCB | 1997 (7), 1998 (11), 1999 (12), 2000 (2) |
| Cheyenne Creek near Coolidge | 23S-43W-20ADC | 1997 (7), 1998 (10), 1999 (8), 2000 (1) |
| Arkansas River near Coolidge | 23S-43W-26BAB | 1993 (1), 1994 (3), 1995 (3), 1996 (1), 1997 (10), 1998 (9), 1999 (12), 2000 (7) |
| Arkansas River at Syracuse | 24S-40W-18BDB | 1993 (1), 1994 (3), 1995 (2) |
| Arkansas River at Kendall | 24S-39W-25DCC | 1993 (1), 1994 (3), 1995 (1) |
| Arkansas River at Amazon Ditch headgates |
25S-38W-12BBB | 1995 (2), 1996 (2), 1997 (9), 1998 (8), 1999 (10), 2000 (3) |
| Arkansas River at Lakin | 24S-36W-34ACA | 1993 (1), 1994 (3), 1995 (1) |
| Arkansas River at Deerfield | 24S-35W-14ACB | 1993 (1), 1994 (3), 1995 (1) |
| Arkansas River at Holcomb | 24S-33W-7CCB | 1993 (1), 1994 (2) |
| Arkansas River at Garden City | 25S-31W-19BDB | 1995 (3), 1996 (13), 1997 (6), 1998 (4), 1999 (10), 2000 (3) |
| Arkansas River at Pierceville | 25S-31W-13CCC | 1996 (1) |
| Arkansas River at Charleston | 25S-30W-25BDD | 1995 (2), 1996 (1) |
| Arkansas River at Ingalls | 26S-29W-02ACA | 1996 (1) |
| Arkansas River at Cimarron | 26S-28W-11DCB | 1995 (3), 1996 (5) |
| Arkansas River at Howell | 26S-26W-21BCB | 1995 (2) |
| Arkansas River near Dodge Citya | 26S-25W-29CCCA | 1998 (1), 1999 (1) |
| Arkansas River at Dodge City | 26S-25W-35BCC | 1995 (2), 1997 (6), 1998 (5), 1999 (10), 2000 (1) |
| Arkansas River near Dodge Cityb | 27S-24W-5BBD | 1995 (3) |
| Arkansas River at Ford | 27S-22W-31DCD | 1995 (2) |
| Arkansas River near Kinsleyc | 25S-19W-9ADD | 1995 (2) |
| Arkansas River near Kinsleyd | 24S-19W-26DCD | 1995 (2) |
|
a Three miles west of Dodge City. b Between Dodge City and Fort Dodge. c Highway 183 bridge south of Kinsley d Highway 50 bridge east of Kinsley |
||
KGS and other agency staff collected the water samples in polyethylene containers and placed them in a cooler with ice for preservation at the collection site. The samples remained refrigerated before and during transfer to the KGS. The KGS kept the samples refrigerated until analysis by the analytical services staff. The laboratory filtered the samples through 0.45 µm membrane filter paper before analysis. The analyses therefore represent dissolved constituent concentrations. The KGS analyzed all samples for specific conductance and concentrations of sulfate and chloride. The KGS also analyzed selected samples for laboratory pH, alkalinity (bicarbonate and carbonate), calcium, magnesium, sodium, potassium, silica, fluoride, nitrate, and boron.
The laboratory used an automated titrimeter for the determination of alkalinity. Determination of pH and fluoride concentration involved specific ion electrodes. The method for determining concentrations of the anions chloride and sulfate was colorimetry in an automated, segmented flow instrument (Technicon AutoAnalyzer). The KGS used the AutoAnalyzer to measure nitrate concentration by UV spectrophotometry. The instrument for determination of calcium, magnesium, sodium, potassium, silica, and boron concentrations was an argon plasma inductively coupled spectrophotometer.
The KGS uses quality assurance/quality control procedures to ensure accurate analytical results. This includes pre-diluting samples into the optimum range of the analytical methods. If the sample constituent concentration exceeded or was near the upper limit of the analytical method range, the sample was diluted into the optimum range and reanalyzed for that constituent. The charge balance is calculated for all samples with determinations of all major and important minor constituent (calcium, magnesium, sodium, potassium, alkalinity, sulfate, chloride, nitrate, and fluoride); the error is usually within ±2% and is essentially always less than 3%. The analytical services laboratory participates in the USGS program for analysis of standard reference waters on a regular basis to provide for additional assurance of accuracy of results. Results from this program indicate low error in KGS analyses.
The KGS chemical analyses for the Arkansas River samples are listed in Appendix A.
The Arkansas River is very fresh (contains a relatively small amount of dissolved solids) as it enters the Great Plains from the Rocky Mountains. The concentration of the dissolved constituent sulfate is higher (often about 100 mg/L) than that of chloride (usually less than 10 mg/L) in the freshwater. The Arkansas River substantially increases in salinity across eastern Colorado before reaching Kansas. Flows entering Kansas are saline during both high and low discharge periods, although the salinity generally decreases with greater discharge. The water primarily contains high concentrations of sulfate, sodium, calcium, and magnesium, as well as elevated contents of many other inorganic constituents.
Most laboratories measure quantities of water by volumetric equipment for purposes of chemical analysis. Therefore, the mass-per-volume units that have become a common standard for reporting the concentration of major constituents are milligram/liter (mg/L) and for trace substances are microgram/liter (µg/L). The mass-per-mass units for mg/L that were formerly in much more common use than today are parts per million (ppm) and for µg/L are parts per billion (ppb). Although ppm and ppb are nearly the same as mg/L and µg/L, respectively, in fresh water, the greater the salinity of a water, the greater the difference in the units. For saline waters, analyses made using volumetric quantities of water must be corrected for density in order that ppm and ppb values are correct. The U.S. Geological Survey formerly used the units ppm and ppb for reporting water analyses but changed to the units mg/L and µg/L about 30 years ago (the units first appeared in the USGS reports Water Resources Data for Kansas in 1968). In some cases, it is useful to represent the concentration of major dissolved cations and anions in water in equivalent-weight units. The units milliequivalents per liter (meq/L) are obtained by multiplying the value in mg/L by the charge of the dissolved ion and dividing by the formula weight of the ion.
Some commercial laboratories report sulfate as sulfur when evaluating constituent concentrations relative to irrigation use. A concentration value listed as mg/L (or ppm) sulfur can be converted to sulfate (the form in which it exists in the waters of southwest Kansas) by multiplying by 2.996. Nitrate concentrations are usually reported as nitrate-nitrogen. The conversion factor for nitrate-nitrogen to nitrate is 4.427.
Major constituents
The chemical character of a water is determined by the major chemical properties and the relative concentrations of different dissolved constituents. The major dissolved constituents in Arkansas River water are those dissolved inorganic substances that are nearly always greater than 10 mg/L. The major dissolved cations (positively charged species dissolved in water) in the river water in southeastern Colorado and southwestern Kansas are sodium (Na), calcium (Ca), and magnesium (Mg). The major anions (negatively charged species) are sulfate (SO4), chloride (Cl), and bicarbonate (HCO3). Although most of the cations and anions exist as individual ions dissolved in the river water (as Na+, Ca2+, Mg2+, SO42-, Cl-, and HCO3-), substantial concentrations of selected ions are associated with one another (particularly calcium, magnesium, and sulfate which form the dissolved ion pairs CaSO4 and MgSO4). Therefore, the concentration of a constituent is best referred to as the total amount dissolved in the water. The concentration of dissolved silica, which is reported as SiO2, is usually in the range 10-24 mg/L in Arkansas River water. Essentially all of the silica dissolved in the river water occurs as undissociated silicic acid (H4SiO4).
The saline water in the Arkansas River in southwest Kansas is much higher in sulfate than chloride content. The relative order of mass concentrations (mg/L) of the major dissolved constituents in most flows of the Arkansas River in Kansas is sulfate > sodium > calcium ≈ bicarbonate > magnesium > chloride > silica. Salinities are smaller in high flows and calcium mass concentration generally exceeds that of bicarbonate and approaches that of sodium. Low flows contain greater dissolved solids and the mass concentration of calcium exceeds that of bicarbonate. Based on equivalent concentrations (that take into account the charge of the dissolved ions), the river waters are of sodium-sulfate chemical type during low to moderately high flows, and of calcium, sodium-sulfate type only during the highest flows. Mass and equivalent concentrations of sulfate are always the greatest of any dissolved constituent. Both sodium/chloride and sulfate/chloride ratios remain in a relatively narrow range for both low and high flows. Mass ratios are nearly always within 3.2 to 3.8 for sodium/chloride and 13 and 17 for sulfate/chloride.
The approximate maximum concentrations of major dissolved constituents in the Arkansas River in Kansas during low flows in the last decade are as follows: sodium 600 mg/L, calcium near 400 mg/L, magnesium 200 mg/L, sulfate 2,500 mg/L, bicarbonate near 400 mg/L, chloride 200 mg/L, silica 20 mg/L, and total dissolved solids 4,400 mg/L. The smallest concentrations in the last decade have occurred briefly during periods of heavy rainfall over the upper Arkansas River valley in Kansas and not during high flows released from Colorado; the minimum dissolved contents are generally in the range of the following values: sodium 130 mg/L, calcium 120 mg/L, magnesium 50 mg/L, sulfate 600 mg/L, bicarbonate 200 mg/L, chloride 40 mg/L, silica 10 mg/L, and total dissolved solids 1,000 mg/L. The typical composition of the river water during average flow is sodium > 400 mg/L, calcium > 300 mg/L, magnesium >150 mg/L, sulfate ≈ 2,000 mg/L, bicarbonate > 300 mg/L, chloride ≈ 120 mg/L, silica 16 mg/L, and total dissolved solids ≈ 3,300 mg/L.
Total dissolved solids
The concentration of total dissolved solids (TDS) is the best individual value representing the salinity of a water. Most of the TDS content consists of the major dissolved constituents. TDS concentrations can be measured by evaporation of a measured volume of water sample to dryness, using a drying temperature of greater than boiling (usually 180 °C although some earlier procedures used temperatures of 103-110 °C), and weighing of the residue. Dissolved solids contents can also be calculated by summing the concentrations for the dissolved constituents, assuming that all of the major dissolved substances have been determined in an analysis. If a complete analysis is available, the sum of constituents method saves much time in comparison to the time-consuming analytical procedure. The analytical method is also subject to a larger error than determinations of major constituents due to the difficulties in accurately measuring the small weight of the residue in comparison with the large weight of the container. In addition, the sum-of-constituents method may be preferable to the analytical procedure due to the different amounts of water of crystallization that various types of residues contain.
The residue left after evaporation of Arkansas River water to dryness would consist primarily of sodium, calcium, and magnesium sulfates and carbonates. During the drying, gypsum (CaSO4 · H2O) precipitates and then partially dehydrates at the higher temperatures of drying at the end of the procedure. However, Hem (1985) indicates that "even though dehydration of gypsum is supposed to be complete at 180 °C, it is not uncommon for water high in calcium and sulfate concentrations to yield a residue after drying for an hour at 180 °C that exceeds the computed dissolved solids by several hundred milligrams per liter." The retention of water of crystallization could explain why greater values have been reported for dissolved solids in Arkansas River waters by the residue analysis than by the constituent sum computation.
At temperatures greater than 100 °C, bicarbonate is unstable. Half of the bicarbonate decomposes to form carbonate, which combines with cations in the residue, and the other half is lost as carbon dioxide and water (Hem, 1985). The Kansas Geological Survey follows the sum-of-constituents procedure of the U.S. Geological Survey that accounts for this decomposition. The bicarbonate concentration is multiplied by a gravimetric factor (mg/L HCO3 × 0.4917 = mg/L CO3) to represent the amount of carbonate that would be left in the residue of the analytical method.
Although the KGS has determined dissolved solids for water samples in the past, the Survey now uses the sum-of-constituents procedure. The concentrations of the major dissolved substances sodium, calcium, magnesium, sulfate, bicarbonate, and chloride generally comprise over 98 percent of the dissolved solids in Arkansas River waters in southwest Kansas across the range of low to high flows. If silica has been determined, the total is about 99 percent. Although the KGS does not determine organic carbon in water samples, USGS data for river waters in Kansas indicate that the concentration of dissolved organic carbon is commonly less than 10 mg/L and is usually smaller than 20 mg/L. Some of the dissolved organic matter could volatilize during drying and part could be oxidized and lost as carbon dioxide. The effect of dissolved organic matter on the total dissolved solids concentration should be no more than one or two percent in high flows and less than a few tenths of one percent at low flows. Thus, an accurate calculation of TDS concentration for the Arkansas River in southwest Kansas can be made given only analytical data for the major dissolved constituents. If silica has not been determined, it can be estimated for the sum-of-constituents calculation by using a value in the range 10-20 mg/L for the highest to the lowest flows or smallest to greatest dissolved solids. The bicarbonate contribution to the total dissolved solids ranges from about 4 percent for the most saline waters up to 10 percent for the least saline flows. If highly accurate determinations of sodium, calcium, magnesium, sulfate, and chloride are available, the bicarbonate can be calculated by charge balance difference, and the dissolved solids concentration computed to give a value that is accurate within a few percent for the river waters.
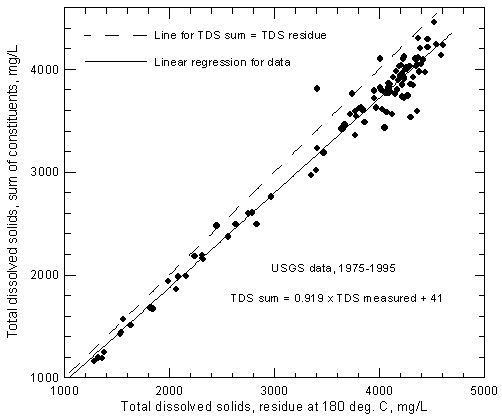
The USGS has reported TDS concentrations from the residue method along with complete analyses of major and minor constituents. Figure 2 shows the relationship of the measured TDS data to the computed dissolved solids concentrations for samples collected by the USGS from the Arkansas River near Coolidge. The last 21 years of record were selected for the figure. One record with a very high value for dissolved solids residue (much higher than any other value and not consistent with sum-of-constituents) was removed from the data set before plotting. The linear regression (best-fit straight line) for the data is
TDSsum = 0.919 TDSmeasured + 41
where the units are mg/L. Based on the regression, the dissolved solids determined by evaporation to dryness ranges from about 4.9% greater than a TDS sum of 1,100 mg/L to 7.9% greater than a TDS sum of 4,400 mg/L in which the bicarbonate concentration is multiplied by the 0.4917 factor. Figure 2 includes a one-to-one line representing TDS sums equaling measured TDS for comparison with the regression line. For consistency in studies that include both calculated and measured TDS concentrations of the river water, it is recommended that the TDS sum be used or that TDS measured values be converted to equivalent TDS sums. The latter can be achieved by using the above regression equation.
Figure 2--Comparison of concentrations of total dissolved solids calculated from a sum of constituents and measured by evaporation to dryness for Arkansas River near Coolidge based on U.S. Geological Survey data.
Specific conductance
The electrical conductivity of a water is a chemical property that is proportional to the TDS concentration. Conductivity is also one of the easiest measurements to make in the field or laboratory. Therefore, the conductivity of a water is often determined and used as a measure of salinity. For example, the conductivity, rather than the dissolved solids concentration, is the measurement commonly employed for designating the salinity hazard of a water for field crops.
The USGS has installed a continuous in-stream monitor for specific conductance at the Coolidge gaging station. At the time of this report, the USGS has been examining the results of the monitoring system and making adjustments to ensure that the configuration produces reliable and accurate results. The relationships between specific conductance and chemical parameters described following this subsection can be used to estimate concentrations of TDS and various major and minor dissolved constituents. If data from the USGS monitoring system become available in real time on the Internet, water-quality estimates based on the relationships and the on-line conductance values could be valuable for managing use of Arkansas River water.
Conductivity is measured with a cup or dip type cell with electrode surfaces that are configured such that an electric current will pass through a particular volume of water. The electrical conductivity of a substance is the reciprocal of resistance. The units of specific electrical conductance are defined as the reciprocal of the resistance of a centimeter cube of aqueous solution. The International System of Units for current scientific use expresses conductance as siemens (S), which is the same quantity as the mho. The expression mho was derived as the reverse spelling of the resistance unit ohm and can be found in older publications. The units most commonly used for specific electrical conductance of a water are microsiemen per centimeter (µS/cm), which are the same as the units micromho/centimeter (µmho/cm). Soil scientists generally use the units decisiemen per centimeter (dS/cm or one-tenth of a siemen per cm), which are the same as the units millimho per centimeter (mmho/cm) previously used.
The conductivity of an aqueous solution varies proportionally with the temperature. An increase in one °C in a fresh to slightly saline water results in an increase in about 2% in the specific conductance when the temperature is near 25 °C. Specific conductances values are therefore corrected for temperature and reported at the standard temperature of 25 °C. Older conductivity meters may require measurement of the temperature and meter adjustment or manual calculation of the temperature correction. Newer meters with temperature measurement can automatically correct for temperature to 25 °C.
Relationship of specific conductance and total dissolved solids
A plot of total dissolved solids concentration against specific conductance for Arkansas River water in southwest Kansas can be used for estimating dissolved solids content given a specific conductance measurement. The accuracy of the estimation depends not only on the accuracy of the conductance measurement but also the error in the dissolved solids determinations used to prepare the plot. Figure 3 represents a plot for Arkansas River water near Coolidge based on USGS data for 1975 to 1995. One record with an anomalously low conductance value for the dissolved solids content was removed from the data set before plotting. (Another value which was also anomalously low in the data file obtained from the STORET system of the U.S. Environmental Protection Agency, that also includes surface water records from the USGS, was corrected before use based on the non-anomalous value printed in a USGS Water Resources Data for Kansas report). For the 1975-1995 period, the range in the reported specific conductance is 1,540-6,010 µS/cm and the range in dissolved solids is 1,160-4,460 mg/L (sum-of-constituents values).
Figure 3--Concentration of calculated total dissolved solids versus specific conductance for the Arkansas River near Coolidge based on U.S. Geological Survey data.
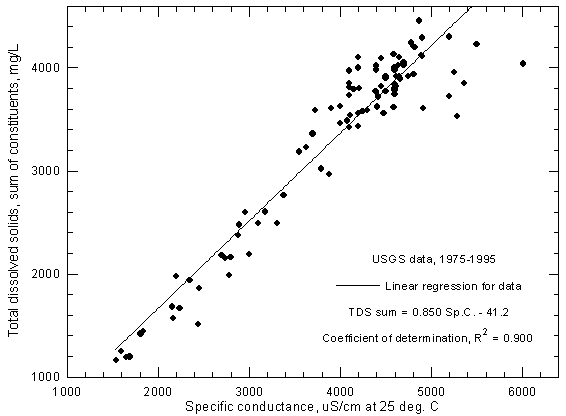
Figure 4 displays the dissolved solids (sum-of-constituents) and conductance relationship for Arkansas River water near Coolidge based on data of the Kansas Department of Health and Environment. One set of observations with an anomalously low conductance for the dissolved solids was removed from data set before plotting. The recorded ranges for the 1974-1996 period are 1,740-5,180 µS/cm for specific conductance and 1,180-4,300 mg/L for dissolved solids.
Figure 4--Concentration of calculated total dissolved solids versus specific conductance for the Arkansas River near Coolidge based on Kansas Department of Health and Environment data.
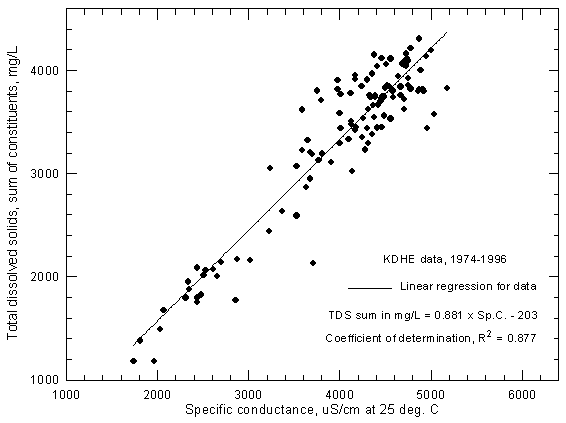
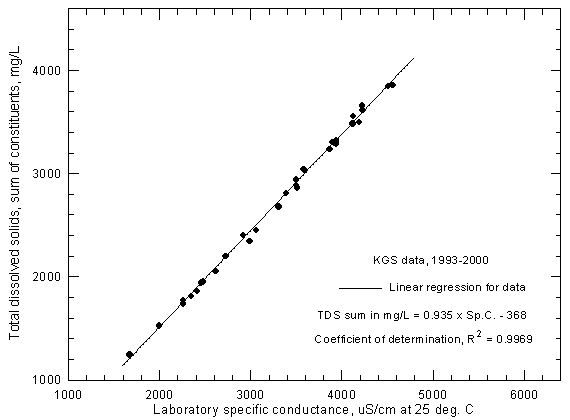
Figure 5 is a plot similar to Figures 3 and 4 but for Arkansas River water samples collected near Coolidge as a part of the KGS study. All data for samples in which the KGS determined all major constituents (Appendix A, Table A3), thereby allowing the TDS sum computation, are in the figure. The recorded ranges for the 1993-2000 data period are 1,675-4,560 µS/cm for specific conductance and 1,243-3,853 mg/L for dissolved solids. The specific conductance readings are laboratory measurements taken with the same conductivity probe and meter after the water sample temperature had adjusted to the laboratory room temperature. The KGS calibrated the meter and cell using a range of concentrations of two different types of inorganic salts for which specific conductance values are known. The dissolved solids sums are based on analytical data that has a small error. Charge balance errors in the complete analyses are nearly always below 2% for samples analyzed for this study.
Figure 5--Concentration of calculated total dissolved solids versus laboratory specific conductance for the Arkansas River near Coolidge based on Kansas Geological Survey data.
The scatter in the points relative to the linear regression lines in Figures 3 and 4 is much greater than in Figure 5. In order to answer whether most of this scatter is due to changes in the chemical character of the water from the 1970's and 1980's to the 1990's or to greater measurement error, data for the last 5 years of USGS and KDHE records for the Arkansas River near Coolidge were plotted separately. Although the scatter for the KDHE data is somewhat less than in Figure 4, the scatter patterns for the 1990's data are relatively similar to those in Figures 3 and 4, and show much greater deviations from the regression lines than for Figure 5. Therefore, the scatter is not due to changes in the chemistry but to error in the measurements.
Figures 3 and 4 point out the range in uncertainty that can be associated with estimating TDS concentrations using specific conductance. Most of the uncertainty is probably in the conductance values, which may include field measurements. Conductivity meters without temperature compensation require accurate temperature measurements for correction. The conductivity cell takes time to adjust to the temperature of the water. If the temperature of the water were substantially different from the cell before immersion in the water, and the measurement was made while the cell temperature was still changing, a significant error could be present in the measurement. The temperature correction of a meter is another source of error. The farther the water temperature from the 25 °C calibration reference, the greater the temperature correction error of the meter. Conductivity cells and meters can be calibrated for a particular conductance. However, the accuracy of the conductance reading decreases with increasing or decreasing conductance values from that calibration point. Therefore, the accuracy of the meter temperature and conductance calibrations, the time allowed for adjustment of cell temperature to water temperature, and the difference in the water conductance from the calibration point can all contribute significantly to the error in the measurement.
Figure 6 illustrates that most of the uncertainty in TDS-conductance graphs is usually in field conductance measurements taken during a wide range of temperatures during a year. The Division of Water Resources (DWR), Kansas Department of Agriculture, measured conductances in the field during 1997-2000 for all but one of the samples (a 1995 sample collected by the KGS) for which points appear in Figure 6. Based on the coefficient of determination, the degree of uncertainty in the TDS-conductance relationship in Figure 6 is approximately the same as for the USGS data in Figure 3.
Figure 6--Concentration of calculated total dissolved solids versus field specific conductance for the Arkansas River near Coolidge based on Division of Water Resources and Kansas Geological Survey data.
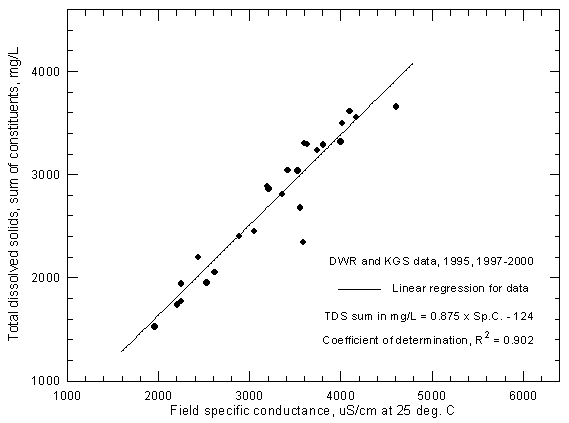
Figure 7 is a graph similar to Figure 5 but includes Arkansas River samples collected at additional sites on the Arkansas River through Hamilton, Kearny, Finney, Gray, and Ford counties in southwest Kansas Survey during 1993-2000 and analyzed by the Kansas Geological Survey. The ranges in specific conductance and dissolved solids are the same as for Figure 5 because the lowest and highest values are for the river near Coolidge. The data for both figures plot essentially along the same line indicating that the dissolved solids and conductance relationship was similar for all locations on the Arkansas River in southwest Kansas during the period.
Figure 7--Concentration of calculated total dissolved solids versus laboratory specific conductance for the Arkansas River near Coolidge based on Kansas Geological Survey data.
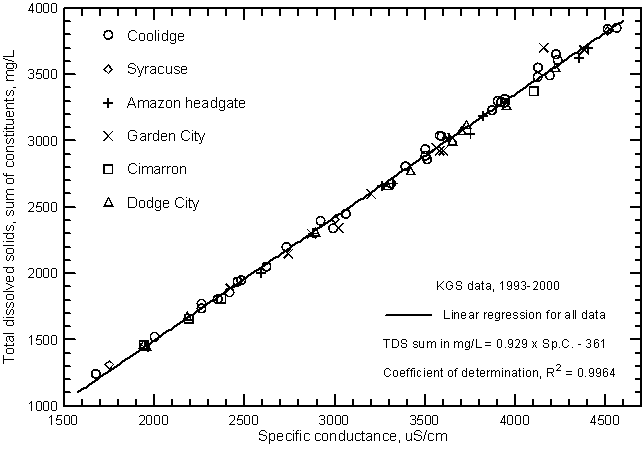
The linear regression or "best-fit line" through the dissolved solids and conductivity data graphs can be used to estimate dissolved solids from measured conductance. Although the highest correlation of the two variables is in Figures 5 and 7, the figure based on the measurements made by a particular agency could yield more accurate results for that agency. If the conductance meter used in the field is properly calibrated, the linear regression in Figure 7 would be the best for estimating TDS concentrations in the Arkansas River in southwest Kansas. Based on this regression, the TDS concentration equivalent to the sum-of-constituents (in mg/L) can be calculated from the specific conductance (in µS/cm or µmho/cm) by
TDS = 0.929 Sp.C. - 361
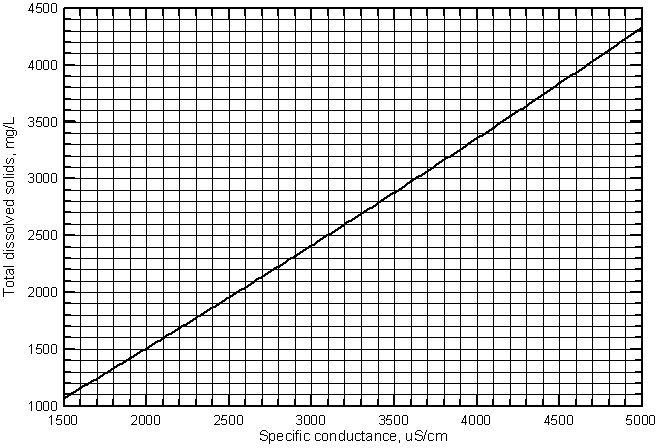
Although the relationship between the two variables is essentially linear in the conductance range shown, the equation cannot be used for accurate estimates of dissolved solids at low conductances for other waters (such as very fresh ground waters in the High Plains aquifer in southwest Kansas), because the relationship has a more pronounced curve at lower values. A second degree polynomial fits the lower values in Figure 7 slightly better than the linear regression. The polynomial equation that can be used in the place of the linear equation for a slightly better estimate of TDS from specific conductance is
TDS = -194 + 0.816 Sp.C. + 1.775 ´ 10-5 (Sp.C.)2
Figure 8 is a graph that displays the curve for this second-degree polynomial. A grid is included for easy estimation of the TDS concentration from a conductance value. A photocopy of this graph could be used in the field for estimation of TDS concentration based on a field conductance measurement.
Figure 8--Curve for estimating the concentration of total dissolved solids from specific conductance for the Arkansas River in southwest Kansas.
Relationship of specific conductance and major dissolved constituents
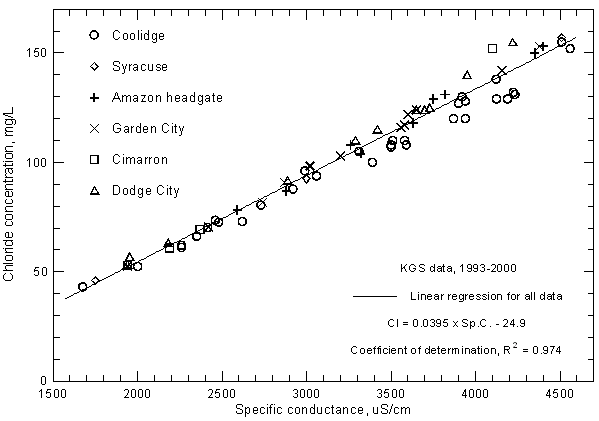
The correlations of specific conductance with dissolved concentrations of all but two of the major constituents are very high. Careful measurements of specific conductance in the field and laboratory can therefore be used to obtain good estimates of selected constituent contents. Figures 9 and 10 display the relationships with sulfate and chloride concentrations, respectively, for the same Arkansas River waters in the study area for 1993-2000 as in Figure 7. The coefficients of determination (R2) for the sulfate and chloride correlations are greater than 0.99 and 0.97, respectively. There is a slight curvature in the distribution of both sulfate and chloride concentrations with conductance just as for the relationship of TDS and conductance. The linear regression and second-degree polynomial equations for the sulfate and chloride concentrations versus conductance are
SO4 = 0.593 Sp.C. - 326
SO4 = -181 + 0.495 Sp.C. + 1.549 ´ 10-5 (Sp.C.)2
Cl = 0.0395 Sp.C. - 24.9
Cl = -15.8 + 0.0333 Sp.C. + 9.76 ´ 10-7 (Sp.C.)2
Figure 9--Sulfate concentration versus laboratory specific conductance for the Arkansas River in southwest Kansas based on Kansas Geological Survey data.
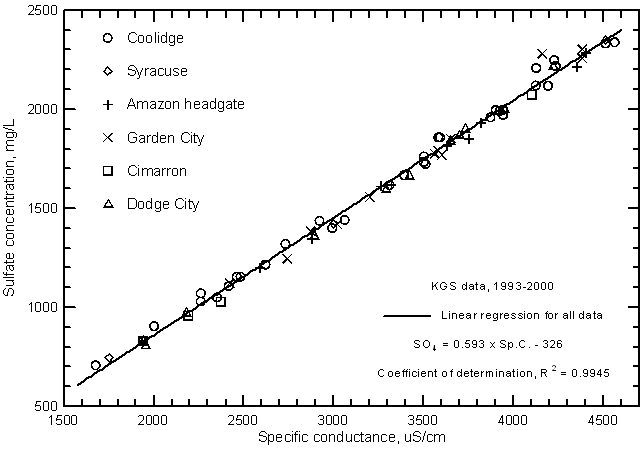
Figure 10--Chloride concentration versus laboratory specific conductance for the Arkansas River in southwest Kansas based on Kansas Geological Survey data.
Highly significant correlations (greater than the 99% level) exist between calcium, magnesium, and sodium concentrations with specific conductance as shown in Figures 11, 12, and 13, respectively. The coefficients of determination (R2) are over 0.99 for the magnesium and sodium correlations and nearly 0.97 for the calcium correlation. The linear regression equations for these relationships are
Ca = 0.0761 Sp.C. + 23.8
Mg = 0.0462 Sp.C. - 13.5
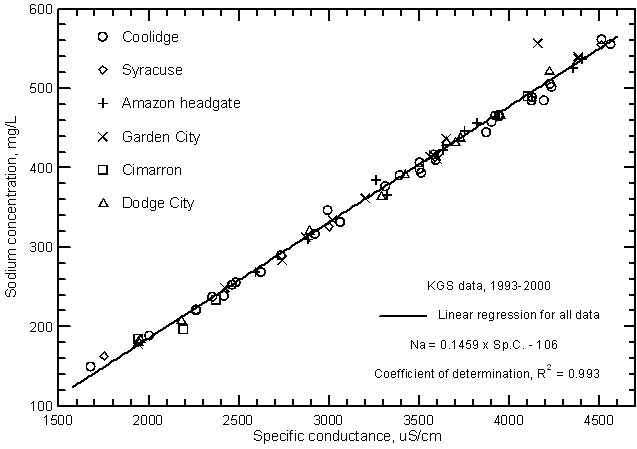
Na = 0.1459 Sp.C. - 106
Figure 11--Calcium concentration versus laboratory specific conductance for the Arkansas River in southwest Kansas based on Kansas Geological Survey data.
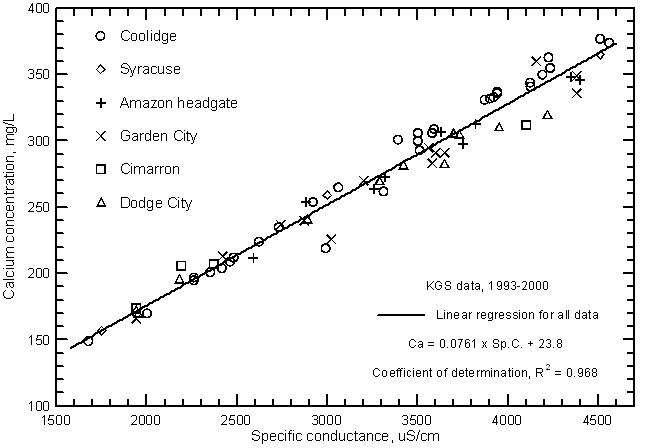
Figure 12--Magnesium concentration versus laboratory specific conductance for the Arkansas River in southwest Kansas based on Kansas Geological Survey data.
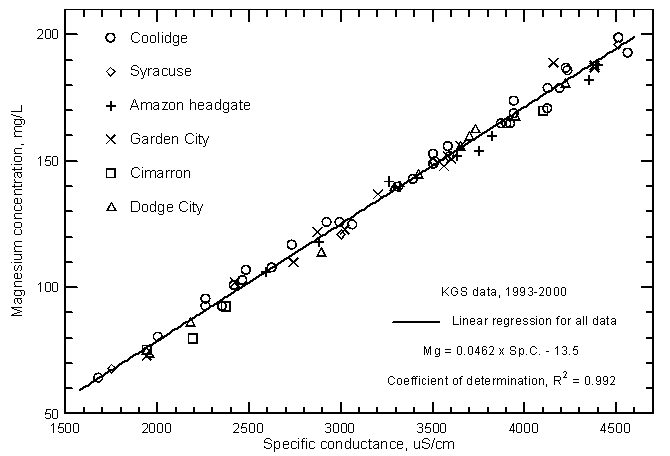
Figure 13--Sodium concentration versus laboratory specific conductance for the Arkansas River in southwest Kansas based on Kansas Geological Survey data.
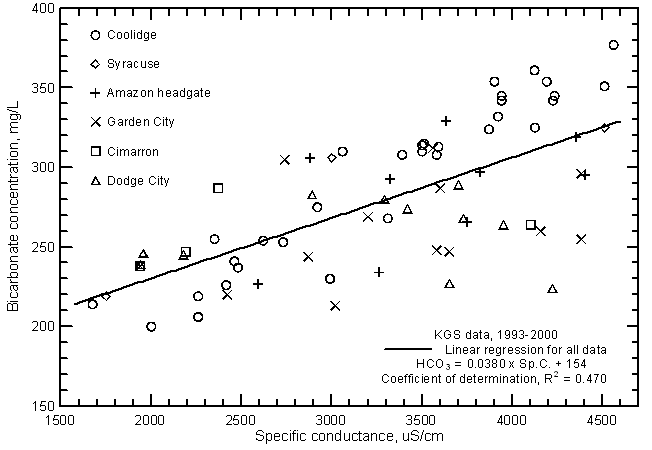
Although the significance of the correlation between bicarbonate concentration and specific conductance (Figure 14) is very high (greater than the 99% level), the coefficient of determination (R2) is less than 0.5. The total range (200-377 mg/L) in the bicarbonate content is a substantially smaller percentage of the average concentration in comparison with the other major dissolved constituents. Bicarbonate content generally increases with increasing conductance of the Arkansas River. However, the error in a concentration estimated from a conductance value could be as much as plus or minus 60 mg/L or about 1/3 of the total concentration range. The equation for the linear regression is
HCO3 = 0.0380 Sp.C. + 154
Figure 14--Bicarbonate concentration versus laboratory specific conductance for the Arkansas River in southwest Kansas based on Kansas Geological Survey data.
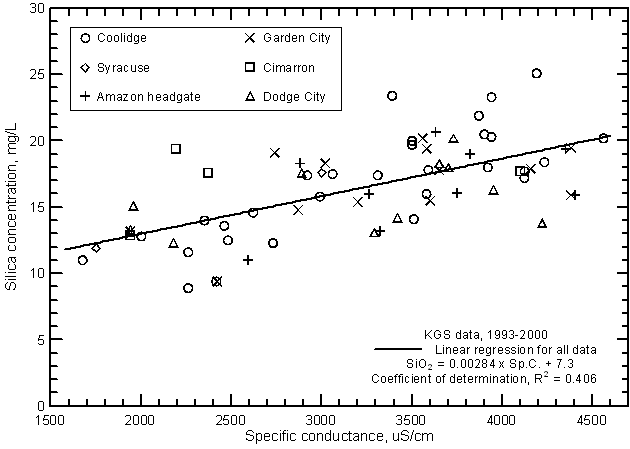
The relationship between specific conductance and silica concentration is significant (greater than the 99% level) (Figure 15) but, similar to the correlation with bicarbonate, the coefficient of determination (R2) is less than 0.5. Silica content generally increases with increasing conductance of the Arkansas River. However, the error in a concentration estimated from a conductance value could be as much as plus or minus 5 mg/L or about 1/3 of the total concentration range. The equation for the linear regression is
SiO2 = 0.00284 Sp.C. + 7.3
Figure 15--Silica concentration versus laboratory specific conductance for the Arkansas River in southwest Kansas based on Kansas Geological Survey data.
Other physical and chemical properties
The temperature of Arkansas River water generally reflects the average daily air temperature, although interactions with ground water in the alluvial aquifer can increase the temperature in the winter and decrease the temperature in the summer. The pH of the river water is nearly always within the range 7.5-8.5 and averages near 8 units.
Minor and trace constituents
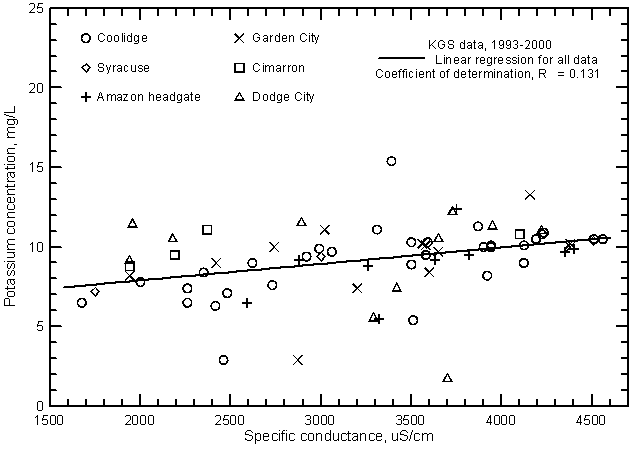
The potassium concentration of Arkansas River water in southwest Kansas is usually within the range 5-12 mg/L. The linear regression of potassium and specific conductance (Figure 16) is significant (at the 99% level) and therefore suggests that there is a relationship of potassium content with salinity. However, the coefficient of determination is low indicating that other factors are a more important control on the variation in potassium concentration than those controlling the river water salinity.
Figure 16--Potassium concentration versus laboratory specific conductance for the Arkansas River in southwest Kansas based on Kansas Geological Survey data.
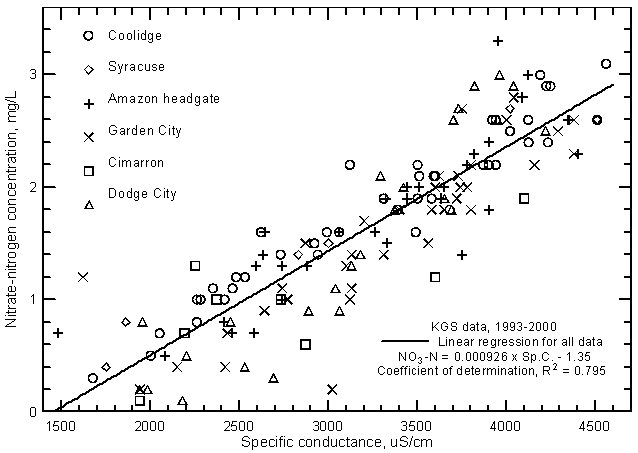
The nitrate concentrations in low flows of the Arkansas River in eastern Colorado and southwest Kansas typically range from 1 to 3 mg/L as nitrate-nitrogen. High flows contain smaller concentrations; nitrate-N contents are usually <2 mg/L and commonly <1 mg/L. For example, all samples collected along the river from Coolidge to Dodge City on July 25, 1995 during the peak flow period contained <0.5 mg/L nitrate-nitrogen. Nitrate contents are highly correlated (at greater than the 99% level) with the salinity of the river water as indicated by the relationship with specific conductance (Figure 17). Nitrate concentration can usually be accurately estimated to within about ±0.6 mg/L based on the equation for the linear regression
NO3 = 0.000926 Sp.C. - 1.35
Figure 17--Nitrate-nitrogen concentration versus laboratory specific conductance for the Arkansas River in southwest Kansas based on Kansas Geological Survey data.
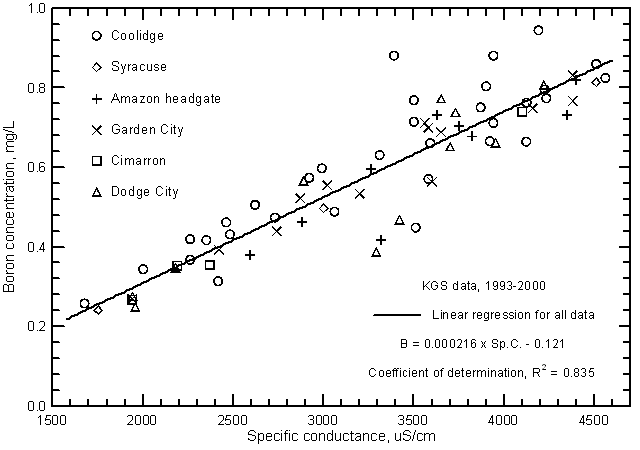
Other constituents that have elevated concentrations in the water of the Arkansas River in southwest Kansas and that exceed surface-water quality standards of the Kansas Department of Health and Environment for selected uses are fluoride, boron, and selenium. Both the fluoride and boron contents in the saline water of low flows can exceed the maximum recommended level of 1.0 mg/L and 0.75 mg/L, respectively, for these constituents in irrigation water. Both constituents are related to the salinity of the river water as indicated by the significant correlations with specific conductance (Figures 18 and 19). Although the boron concentration is generally less than the fluoride content of the river water, the boron range is greater than that for fluoride. This is also reflected in the substantially greater correlation of boron content and specific conductance than for fluoride concentration and conductance. Fluoride and boron concentrations can be estimated from the linear regression equations
F = 0.0000589 Sp.C + 0.81
B = 0.000216 Sp.C. - 0.121
Figure 18--Fluoride concentration versus laboratory specific conductance for the Arkansas River in southwest Kansas based on Kansas Geological Survey data.
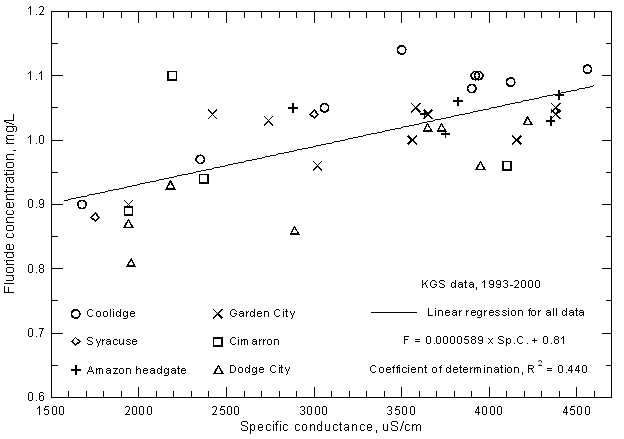
Figure 19--Boron concentration versus laboratory specific conductance for the Arkansas River in southwest Kansas based on Kansas Geological Survey data.
Based primarily on USGS and KDHE data, the river water entering Kansas from Colorado contains a selenium concentration that is nearly always greater than a criterion for aquatic life and the recommended limit for irrigation water. Pesticide concentrations are nearly always below detection. USGS and limited KGS data show that uranium concentration in the saline low flows generally exceeds the level of 20 µg/L proposed by the US EPA as a possible standard for drinking water. Boron, selenium, and uranium contents in waters from the Arkansas River and Lake McKinney in Kansas were observed to be as high as 0.64 mg/L, 10 µg/L, and 47 µg/L, respectively, in samples collected in 1988 (Mueller et al., 1991).
The main factor controlling the variation in the quality of Arkansas River water in southwest Kansas is the salinity of the water crossing the Colorado-Kansas state line. The single variable explaining the greatest amount of variation in constituent concentrations at the state line is the river flow. If flow is low, the salinity and concentrations of individual constituents are generally high and if flow is high, the salinity and concentration are lower. This is illustrated by the relationship between the TDS concentration and discharge in the Arkansas River near Coolidge (Figure 20). (The data for Figure 20 and other figures in this section of the report are included in Appendix B.)
Figure 20--Total dissolved solids concentration versus discharge for the Arkansas River near Coolidge, Kansas, 1963-1999.
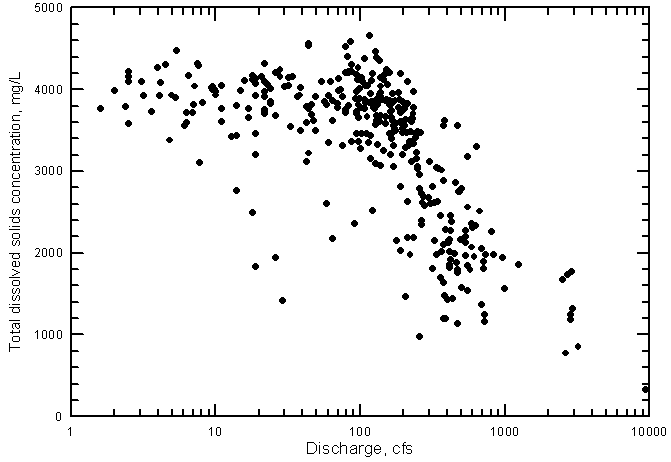
The decrease in TDS concentration with increasing discharge is not a simple relationship, however. At discharges near 100 cfs (ft3/sec)and below, the dissolved solids concentration reaches a maximum of about 4,200 to 4,500 mg/L (Figure 20). A substantial decrease in salinity does not generally occur until the discharge exceeds about 200 cfs. The TDS content of the river water crossing the state line very seldom is less than 1,000 mg/L, the classification limit between fresh and saline water. (The classification of freshwater as containing not more than 1,000 mg/L is in a Kansas statute related to ground-water quality protection. This division between freshwater and saline water also appears in widely-used literature such as Hem [1985].) Very high flow events are required to produce such a low TDS content.
Sulfate concentration shows a similar relationship with river discharge near Coolidge as for TDS (Figure 21). The sulfate concentration reaches a maximum of about 2,600 mg/L when the discharge falls to near 100 cfs and below. In contrast, the chloride concentration does not reach a maximum limit as do sulfate and dissolved solids contents but continues to increase with decreasing discharge below 100 cfs (Figure 22).
Figure 21--Sulfate concentration versus discharge for the Arkansas River near Coolidge, Kansas, 1963-1999.
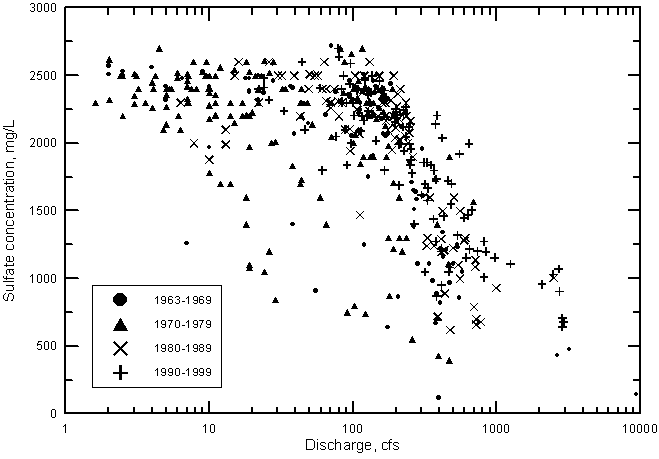
Figure 22--Chloride concentration versus discharge for the Arkansas River near Coolidge, Kansas, 1963-1999.
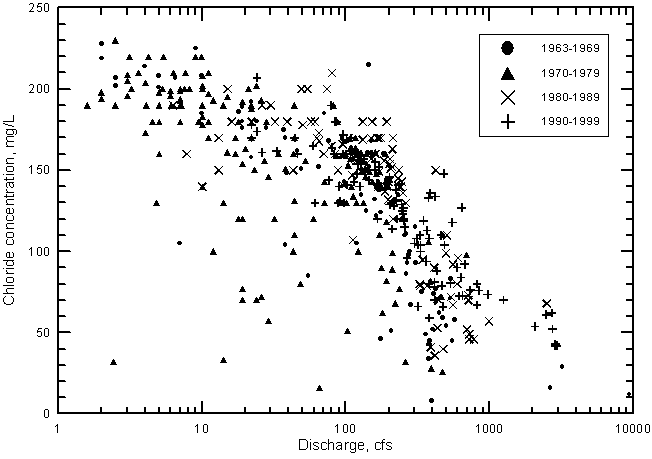
The cause of the maximum sulfate and dissolved solids contents during low flows is primarily related to gypsum (CaSO4 · 2H2O) solubility. Gypsum precipitates in soils and sediments when consumption of water concentrates the dissolved solids to over the gypsum saturation point. Parts of some fields in the area irrigated by diverted river water in eastern Colorado have become white during dry periods as a result of mineral precipitation from the water. The expected composition of most of the precipitated salts is a combination of gypsum and calcium carbonate (CaCO3). Some magnesium is also incorporated into the calcium carbonate formed, thus it is somewhat limited as well as calcium. The chloride concentration is not limited by mineral solubility until orders of magnitude higher concentrations. For example, the chloride concentrations increase about an order of magnitude in low Arkansas River flows from the most western irrigation ditches diverting river water in Colorado to the gaging station at Coolidge, Kansas. The other constituents increase in similar degree until the concentrations of calcium and sulfate reach levels where chemical precipitation occurs. The increase in sodium content generally parallels that of chloride, although cation exchange with calcium and magnesium on clays in river sediments and soils could slightly alter its concentration. Small amounts of chloride salts would only be present in the mineral precipitates if all of a particular volume of river water evaporated to dryness. Thus, chloride concentration does not reach a maximum limit with decreasing water flow in the river as do sulfate and dissolved solids but can continue to increase with decreasing discharge below 100 cfs. Therefore, chloride content is a better representative of the degree of concentration of dissolved salts in the river water as a result of consumptive losses.
The salinity of Arkansas River water in Colorado began to increase over the natural levels once substantial consumptive losses occurred as a result of large river diversions and ditch irrigation. In addition, the additional water applied to soils could have leached additional salts from the subsoils that had been weathered from bedrock. Sherow (1990) describes the changing salinity conditions that started to occur in the late 1800's in the irrigated corridor in Colorado. For example, he states "Moreover, salinity levels in the river flow increased with each reuse of the stream. By 1895 concentrations had reached such a point in the Arkansas River near La Junta that the Atchison, Topeka and Santa Fe Railway quit using river water in its locomotives' boilers, since mineral deposits had resulted in too many costly repairs" (page 31). In addition, Sherow described the exacerbation of the salinity problem from the invasion of the phreatophyte salt cedar. The salt cedar increased the consumption of water in the valley, leading to increased salinity in the remaining water. Dissolved salts taken up into the leaves of the phreatophytes were recycled into the soils after the leaves fell from the trees and decomposed.
After the substantial initial increase in salinity of Arkansas River water in Colorado, further increases in salinity occurred in the river water entering Kansas. Unfortunately, there are no substantial records of simultaneous water quality and discharge measurements on the Arkansas River near the state line until the fall of 1963. Thus, no direct comparison can be made of salinity at given discharge values. However, historical records of water-quality and discharge data for the river in the early 1900's can be used for indirect approximations of the change in salinity. This approach was used to estimate TDS and sulfate concentrations in the river water at Coolidge from 1906 to 1973. The approach involved examination of constituent to discharge ratios at Coolidge and other river sites downstream to Great Bend in order to appropriately compare water quality for similar flow conditions. The resulting estimates suggest that for comparable low flows TDS and sulfate concentrations increased from approximately 1,840 and 1050 mg/L, respectively, for 1906-1907 to 3,220 and 1,650 mg/L, respectively, for 1958-1960 to 3,560 and 2,120 mg/L, respectively, for 1973. Thus, the TDS and sulfate contents of low river flows appear to have approximately doubled during the period of 1906 to 1973 for the conditions examined. Although these estimates have a substantial degree of error based on the indirect approach, they do indicate at least a substantial increase in salinity occurred during the period.
Since the start of continuous records of both water quality and discharge in 1963, the general salinity level of Arkansas River water has continued to increase. This is indicated in Figures 21 and 22, which show the distribution of sulfate and chloride concentrations, respectively, with discharge for each decade. During both the 1960's and 1970's, there are many points in the figures at substantially smaller concentrations of sulfate and chloride than for the 1980's and 1990's. At flows greater than 300 cfs, the points with the highest sulfate or chloride concentrations for a given discharge range are generally for the 1990's.
The salinity increase during the 1964-1999 period is shown by the distribution of sulfate concentration in Figure 23 for river discharges greater than 100 cfs. This flow represents the approximate break between the nearly constant maximum concentrations of sulfate and TDS in low flows and the salinity decrease for maximum concentrations at flows greater than 100 cfs. The separation into the two populations allows statistical analysis of the population exhibiting a general salinity decrease with increasing discharge (the one appearing in Figure 23). The data are further split into two periods (1964-1970 and 1987-1999) in which flows ranged from near 100 cfs to at least about 3000 cfs. Conditions during the 1970's and early 1980's were drier and flows generally remained under several hundred cfs. The two curves plotted in the figure are computer calculated fits based on the log-log equation
log y = b log x + a.
Figure 23--Sulfate concentration versus discharge exceeding 100 cfs in the Arkansas River near Coolidge, Kansas. The two curves are best fit lines based on lease squares computation.
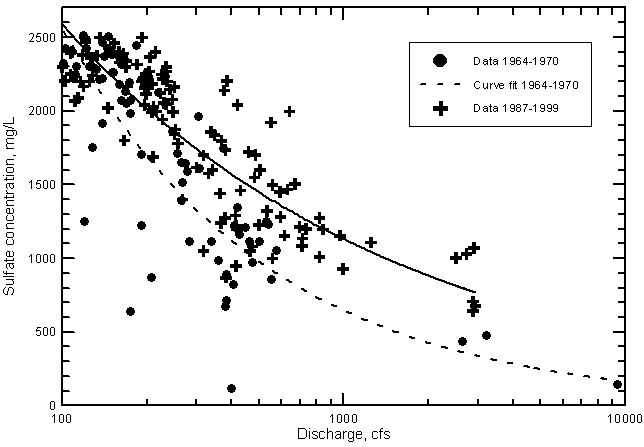
The data in Figures 20-22 are plotted as a linear-log graph to best show the change in the point distributions above and below the 100-200 cfs range. The axes in Figure 23 are also linear-log to be similar to Figures 20-22. If the sulfate concentration and discharge values are plotted on a log-log graph, the curves in Figure 23 appear as straight lines. Converting the sulfate and discharge to log values and plotting on a graph with linear axes also allows generation of linear regression lines (Figure 24). The central, thicker lines in the two sets of three solid and dashed lines in Figure 24 represent the regression lines for the two periods of data. The two lines (actually gentle curves) on either side of each of the central regression lines represent the 95% confidence intervals for the regression lines in each data set. The confidence intervals include The 95% confidence intervals overlap at discharges less than 200 cfs (log 200 = 2.30 on Figure 24). This means that the regressions for sulfate concentration versus discharge are not significantly different for the two periods at discharges below 200 cfs. At discharges greater than 200 cfs, the 95% confidence intervals do not overlap, indicating that the regression lines are significantly different for the two time periods for the higher flows. The significance of the difference increases with increasing discharge.
Figure 24--Sulfate concentration versus discharge exceeding 100 cfs for the Arkansas River near Coolidge, Kansas. The 95% confidence intervals are the two thinner lines above and below the thicker regression line.
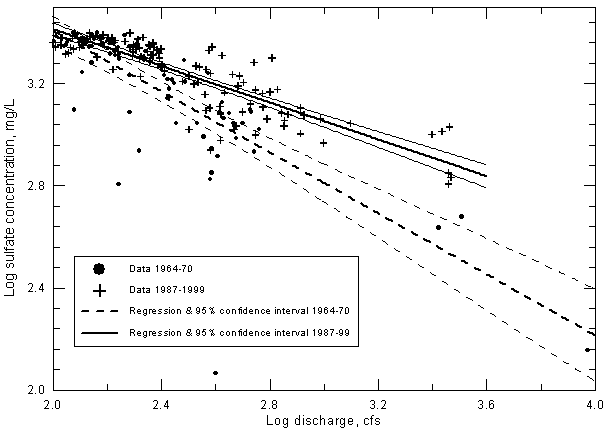
The coefficients of determination (R2) for the linear correlations between discharge and sulfate concentration on the log-log plot (Figure 24) are 0.618 for the period 1964-70 and 0.738 for 1987-99. The corresponding correlation coefficient r for each of the two curves is significant at greater than the 99% level, indicating that the correlation of sulfate with discharge is highly significant for both periods for discharges greater than 100 cfs.
Figure 23 shows that at a discharge of 500 cfs the difference in sulfate concentration indicated by the two curves is about 450 mg/L or an increase of over 40% from the value for the period 1964-1970 to the amount during 1987-1999. At 1,000 cfs the sulfate content and percentage increase are approximately 460 mg/L and 70%, respectively. The effect of removing the highest flow point {9,400 cfs within the period 1964-1970} on the differences is small (the sulfate concentration difference decreases by only about 20 mg/L and the percentage increase falls by only a few percent at 500 and 1,000 cfs).
There are two possible explanations for the increase in river water salinity shown in Figures 23 and 24, increased water use and consumptive loss, and a lag in the mass transfer of salts to Kansas. Increased use and consumption of water occurred in the river corridor in southeastern Colorado during the periods for data plotted in the figure, especially for water pumped from wells in the alluvial valley. Although the greater water consumption probably contributed to the salinity increase, the magnitude of the increase suggests that the mass transfer lag might be the major cause. Although the flows in the river and its tributaries in Colorado vary, over the long term the average annual salt load should be relatively similar for different periods. The diversion of water for irrigation in Colorado delays the movement of salt loads to Kansas by accumulating salts in the soils and shallow ground waters. These delays began with the first surface irrigation system and continued with further development of diversion systems and storage reservoirs away from the river. The salt mass would be expected to build up until flushing by rain and larger irrigation applications, higher irrigation return flows, and ground-water discharge carrying seepage from below irrigated fields finally bring the loads exiting Colorado to near their original average rate. The variations in the dissolved salt loads of the Arkansas River entering Kansas are large. During dry periods, carbonate and sulfate salts can precipitate from irrigation water in soils and along the banks of canals and the river. The salinities, which are limited by mineral precipitation, coupled with the low flows result in much smaller total salt loads entering Kansas than during large flushing events caused by particularly high rainfall and snowmelt.
The patterns of data points in Figures 20-23 suggest the character of the long-term salinity increases in Arkansas River water entering Kansas. Before irrigation development, the relationship between dissolved solids, sulfate, and chloride concentrations at the state line probably was a general decrease in concentrations for nearly all discharge ranges except those less than a few cfs. The typical distribution of points on concentration-discharge plots such as Figures 20-23 might have appeared as a curve starting from the lowest discharges and tracking though the lower range of concentrations for given discharges shown on the figures. During the initial development of irrigation systems in Colorado, the main salinity increase would have been due to consumption of water and concentration of the residual salts in the remaining water passed downstream to Kansas. This would have shifted the points upward on the concentration-discharge graphs because the concentrations would have been greater given the same discharge.
The quality of river waters affected by snowmelt and large regional or intense local precipitation events would have not been altered much soon after the initial irrigation development. As the salinities began to accumulate in the soils and alluvial ground waters, and in the waters stored in reservoirs, the mass of salts available for mixing would have increased to the point where they would begin to substantially affect the snowmelt and precipitation runoff. This would produce fewer of the points in the lower concentration range for given discharges on graphs such as Figures 20-23. Large flow events that have occurred during recent years in the Arkansas River result in appreciably less saline river water than during low flows. However, despite input of very fresh snowmelt and rain on occasion in Colorado, mixing with the great amount of saline water in reservoirs, ditch systems, and shallow aquifers, and flushing of readily leachable salts in soils of irrigated fields, produce slightly saline river water in Colorado by the time the water reaches Kansas. For example, during the summer of 1995, the freshest water observed entering Kansas had TDS and sulfate contents of about 1,200 and 700 mg/L, respectively.
When the salinities built up to the level where precipitation of gypsum in soils and sediments became appreciable, the total dissolved solids and sulfate concentrations would have reached maximum values as indicated in Figures 20, 21, and 23. As salt accumulation continued and more and more of the discharges in the 10-100 cfs range shifted to higher concentrations on the graphs, the frequency of waters that reached the mineral solubility limit increased. This would produce the pattern of larger discharges required to dilute Colorado lower flows below the solubility limit and substantially decrease concentrations as in Figures 20, 21, and 23. As accumulation of mineral salts began to impact most of the river corridor, the number of events in which concentrations in the river water were similar to pre-development conditions largely disappeared. This produced the distribution of points that has occurred during the last two decades.
The operation of John Martin Reservoir would be expected to have caused a decrease in the frequency of very low river flows crossing the Colorado-Kansas state line because of the water that can be called by irrigators from the reservoir. One of the expected effects of water storage in the reservoir, mixing of return flows entering the river upstream of the reservoir with the stored water, and mixing of the released water with downstream return flows is an increase in discharge at a given dissolved solids, sulfate, or chloride concentration. This would appear as a shift in points at greater than 100 cfs to the right on Figures 20-23. There are insufficient water-quality data existing before the construction and operation of John Martin Reservoir to examine specifically for the shift at the state line. Regular monitoring of water quality did not begin on the Arkansas River near the state line until the fall of 1963. However, trends observed by Lewis and Brendle (1998) for the Arkansas River below John Martin Reservoir based on data from 1955-1994 support the expected shift. Lewis and Brendle found that the change in operation of the reservoir since 1979 caused a narrowing of the specific conductance range in the river water below the reservoir. They found that the annual minimum conductance (that would occur in higher flows) increased from a range of about 500-1,000 µS/cm in 1955-1979 to about 1,000-1,500 µS/cm in 1980-1994 even though the median annual streamflow in the river increased significantly from the first to the second period. They stated that the changes in specific conductance (including a decrease in the annual maximum conductance) since 1979 probably were caused by decreased specific conductance in the reservoir inflow, the establishment of long-term storage and a permanent pool in the reservoir, and an increase in the mixing of water with different conductance values in the reservoir.
Based on these explanations, the change in the salinity of Arkansas River water entering Kansas can be summarized as follows:
Future changes in the salinity of Arkansas River waters entering Kansas will depend on water use and climatic changes in the basin in Colorado, and on whether the rate of salt accumulation in eastern Colorado is now approximately balanced by the salt load passing the state line. If water consumption decreases and the climate and the amount of freshwater removed in the upper reaches of the basin remain the same, the salinity could be expected to decrease, but only in a percentage approximately equivalent to the consumption decrease. If consumption decreases but water is removed from the upper parts of the basin, the salinity change will depend on the relative differences in the water consumption and transfer volumes and the mass of dissolved solids in the transferred water. Climatic fluctuations will continue to cause large variations in flows in the river and, therefore, large changes in the river salinity when flows exceed 100 cfs. A long-term climatic shift could cause either an increase in the frequency of low flow, high salinity conditions or of high flow, lower salinity events. The lag in the accumulation and removal of accumulated salts in the river corridor in eastern Colorado means that responses to water use and climatic changes are slow to approach a new, general equilibrium in the salinity-discharge relationship of water at the state line.
The Arkansas River is very fresh as it enters the Great Plains from the Rocky Mountains. The concentration of sulfate is relatively high (often about 100 mg/L) in comparison with that of chloride (usually less than 10 mg/L) in the freshwater. The salinity of the river water increases substantially as it crosses eastern Colorado. After entering Kansas, the salinity of Arkansas River water does not change significantly as it passes through southwest Kansas. Most of the current spatial variations in the salinity within southwest Kansas are due to the differences in quality at the state line that are transferred downstream. Other controls on the water quality include stream-aquifer interactions, loss of water from river surface evaporation and phreatophyte transpiration, and wastewater inflows such as from Garden City.
Changes in the flow due to irrigation diversions and infiltration to the alluvial and High Plains aquifers substantially affect the patterns of salinity-discharge relationships but these are primarily due to reduction of flow. This would have the effect of shifting the points on concentration-discharge graphs such as Figures 20-23 to lower discharge values at the same concentration level. Thus, concentration-discharge graphs for long-term data at locations downstream of the Amazon Ditch headgates continue to have appreciable scatter in the points for recent periods similar to the long-term data for the state-line river water. It may be possible that a similar shift of some points to lower discharges at the same concentration could occur at the state-line during another extended dry period similar to that of the 1970's.
An example of the spatial changes in river water-salinity in southwest Kansas due to flow variations at the state line is the passage of the large flow peak downstream during the summer of 1995. Larger than average snow melt from the Rocky Mountains in central Colorado and much rainfall in eastern Colorado filled the reservoirs of the Arkansas River and tributaries in the early summer of 1995. Colorado began to substantially increase the volume of water released from John Martin Reservoir from about July 1 to the middle of July. The flow was decreased near the end of July until reaching more typical amounts by early August. The river peak migrated downstream in the Arkansas River valley in Kansas. However, because large amounts of the flow infiltrated to the dry or nearly dry river bed from Finney County downstream, the Arkansas River did not flow in substantial amounts completely through to Dodge City until almost three weeks later. After the reservoir releases to Kansas were substantially decreased, the flow of the Arkansas River rapidly decreased in response to the combined effects of smaller upstream flow and infiltration to the alluvium where ground-water levels in the alluvial corridor were still below the river bed. The flow effectively ceased at Dodge City by the end of the third week in August.
The KGS collected information on the high-flow event as a part of the study. The KGS worked with staff of Southwest Groundwater Management District No. 3, the Kansas Department of Health and Environment in Dodge City, the Kansas Water Office, Big Bend Groundwater Management District No. 5, and the Division of Plant Health, Kansas Department of Agriculture to collect river water samples during the high-flow period. The samples were analyzed at the laboratories of the KGS and are in the tables in Appendix A.
Figure 25 shows the specific conductance results for the two most extensive sampling trips in southwest Kansas, one by GMD 3 on July 25, 1995 and one by the KGS with Gerald Hargadine of the KWO during August 7-8, 1995. The values of conductance for Arkansas River water just below John Martin Reservoir were obtained from the real-time data available on the USGS surface flow pages for Colorado on the Internet. The specific conductance was used as a measure of salinity and plotted versus river miles as designated by the USGS for gaging stations. River miles for locations without USGS gaging stations were estimated from maps.
Figure 25--Profiles of specific conductance along the Arkansas River during the high-flow event of July and August 1995.
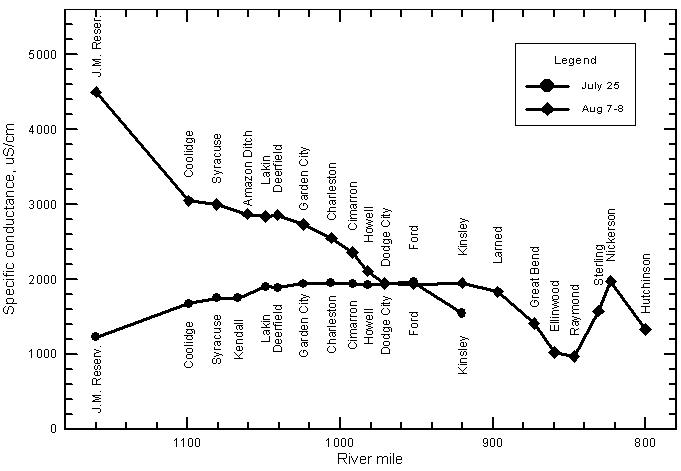
The freshest water collected from the river near Coolidge occurred on July 25; the specific conductance was 1,680 µS/cm, TDS content was 1,220 mg/L, and the sulfate concentration was 708 mg/L. Four days later (July 29) the discharge rate near Coolidge began to decrease. The salinity of the river water on July 25 was higher at locations downstream of Coolidge. On July 20, just after the flow front had passed Dodge City, the sulfate concentration was 977 mg/L between Dodge City and Fort Dodge. As fresher water continued to flow downstream, the sulfate content dropped to 835 on July 25, then to 813 mg/L on August 8 at Dodge City. The last of these three collection dates was during the recession portion of the flow at the gaging station. The last sample collected (August 15) before flow ceased (August 21) at Dodge City contained a much higher sulfate concentration of 1,317 mg/L.
The July 25 salinity profile along the river (Figure 25) approximately represents the time when the freshest river water was flowing into Kansas. The increase in salinity along the river on July 25 indicates the lag time for the fresher water to flow downstream. The front of Arkansas River flow had not quite yet reached Kinsley at this date. The Kinsley sample on this date was taken from shallow, nearly stagnant water in the river channel.
The August 7-8 profile indicates the great increase in salinity of the water flowing from below the John Martin Reservoir to Kansas once the flow rate greatly decreased. Similar to the July 25 profile, there is a lag effect for the salinity, only this time the salinity decreased along the profile because earlier, less saline water was still flowing at the downstream locations. It is possible that the water in the Arkansas River from Lakin to Kinsley reached a lower salinity between July 25 and August 7-8. However, the salinity probably did not become as low as that for the Coolidge sample due to mixing with more saline water from shallow stream-aquifer interactions along the river course, and the effects of river surface evaporation and phreatophyte transpiration. The leveling off of the specific conductance from Dodge City to Kinsley during August 7-8 supports this because if the water had been much fresher, a continued slight decrease from Dodge City to Kinsley would have been expected. The minimum conductance for the Arkansas River from Garden City to Kinsley between July 25 and August 7-8 probably was never lower than 1,800 µS/cm.
The chemical characteristics of Arkansas River remain essentially the same as the water flows through southwest Kansas. The relationships of the dissolved concentrations of different individual constituents to specific conductance, and thus to TDS content, do not change noticeably as shown by the points for different locations along the river in Figures 7-19. Ratios of dissolved constituent concentrations are more sensitive to changes because they include differences in two rather than one substance. A notable characteristic of the Arkansas River in southwest Kansas is the nearly constant ratio of sulfate/chloride for the entire salinity range and, therefore, flow of the river. Figure 26 shows points for the sulfate/chloride mass ratio versus TDS concentration for the same locations and time (1993-2000) as in Figures 7-19. Only KGS data are shown to reduce the possibility of greater analytical error in other data available during the period. The linear regression for the data shows no significant trend in the ratio with increasing TDS content. Although the general range in the sulfate/chloride ratio is essentially constant, there are small differences in the range from Coolidge to Dodge City. The average sulfate/chloride ratio for data in Figure 26 decreases from 16.1 at the Coolidge site to 15.6 at Garden City to 15.1 at Dodge City.
Figure 26--Sulfate/chloride mass ratio versus sulfate concentration for the Arkansas River in southwest Kansas based on Kansas Geological Survey data.
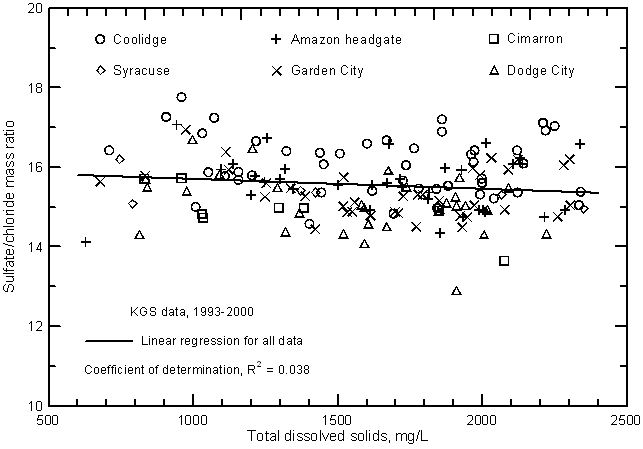
The slightly smaller sulfate relative to chloride concentration observed downstream from Coolidge to Dodge City could be the result of stream-aquifer interactions and wastewater inflows. Stream-aquifer interactions could include a small effect of seepage flowing from the ditch irrigated areas in Kansas into the alluvium and thence into the river. This would primarily be along the river from below the drain from Lake McKinney to near Deerfield where the ground-water levels are locally higher than the river. Sulfate/chloride ratios in the shallow, saline ground water at the multi-level observation well site in Deerfield are substantially lower than in saline ground water at the well sites in Garden City and Dodge City (Whittemore, et al., 2000). Precipitation of gypsum in the soils in the irrigated areas could cause removal of sulfate without reduction in chloride concentrations. The effect of municipal wastewater discharge from Garden City would be to dilute the river water salinity and slightly decrease sulfate/chloride ratios because the effluent is generally fresher and has a lower ratio than the saline river water.
Before irrigation ditch systems were constructed in the 1870's in Colorado, the Arkansas River flowed enough during most periods in southwest Kansas to maintain shallow water tables in the alluvium in the vicinity of the river. Some discharge from Cretaceous bedrock and the High Plains aquifer to the river valley also helped to keep water tables shallow. The river channel was much broader and shallower than today; human impacts decreasing the river flow have caused deepening and narrowing of the channel. During extended dry periods the shallow ground water in the floodplain probably became very slightly saline because evaporation of moisture from the sediment could occur as capillary action pulled water up above the water table. Transpiration by plants growing at elevations of the floodplain above the active river channel could also increase salinity during dry periods. As the river stage continued to fall during drought, some of the shallow, saline ground water in the alluvium underlying the floodplain would move along curved flow lines downward and towards the river and then upwards and to the river channel as discharge. This would result in moving the slightly saline water deeper into the alluvium before discharge to the river.
High flow events with fresh river water would have caused some infiltration of water into the floodplain sediments, thereby diluting the upper part of the slightly saline water but also driving some of the saline water deeper into the alluvium. When the high stage receded to low flows, the diluted ground water would then flow towards the river. Heavy rainfall would have also infiltrated to the shallow alluvial waters and caused dilution.
Ground water in the Dakota aquifer underlying the Arkansas River valley in eastern Colorado and southwestern Kansas is fresh but contains relatively high sulfate concentrations (usually 50-300 mg/L) in comparison with other constituent contents (Macfarlane et al, 1994). Before drilling of wells, the Dakota aquifer was artesian along the Arkansas River valley from southeastern Colorado into Hamilton County. The Dakota aquifer probably also discharged water to the river valley along other stretches downstream of Hamilton County through the study area. Some natural discharge of this water into the Arkansas River would have added fresh water of calcium-bicarbonate, calcium-sulfate, or mixed cation-anion type, with sulfate/chloride mass ratios from somewhat less than 10 to near 15. The higher sulfate concentrations of the bedrock discharge would have partly balanced dilution by surface recharge and High Plains aquifer discharge to the alluvial aquifer and river water. Thus, moderate concentrations of sulfate would have been expected in waters in the alluvium near the river and in lower river flows. Concentration of this water in the shallow alluvium and in the river by evapotranspiration would then have produced even higher sulfate contents.
Before human impacts, the combined effects of the evapotranspiration concentration of shallow ground waters during dry periods, dilution by flooding and infiltration of rainwater, and bedrock discharge would have reached a state of approximate equilibrium about which salinity from climatic changes would vary. Ground waters with somewhat elevated dissolved solids, but not the levels observed today, would be expected in the alluvial aquifer below the floodplain. In general, the farther downstream in the Arkansas River valley, the less saline the water in the alluvium would be because the increase in mean annual rainfall would cause increased dilution from direct infiltration and greater ground-water discharge from the High Plains aquifer to the valley.
After substantial irrigation diversion started in Colorado in the 1870's, the Arkansas River flow entering Kansas became more saline. After the 1880's, the Kansas diversions would have also decreased river flow somewhat, although the amounts used in Kansas have always been substantially less than those in Colorado. The more saline river waters from Colorado would not have affected the alluvial ground waters in southwest Kansas much during low-flow periods except in local areas of the broad river channel, because ground-water discharge to the river from bedrock, alluvium underlying higher terraces in the valley, and the High Plains aquifer, where present, would have prevented movement away from the channel zone. High flow events, however, would result in water infiltrating into the shallow alluvium covered by the flood waters, which would have been more saline than before irrigation began. The greater salinity of the high flow after the development of the irrigation diversion systems than before would have been derived from locally heavy rainfall flushing salts from irrigated fields and saline water from return-flow ditches. In addition, the front of a flood event caused by rains or snowmelt in the Rocky Mountains or locally heavy rain would mix with saline low-flow water to produce a mixture that would have been the first water to seep into the alluvium as the river stage rose.
The development of terraces on cultivated fields in the upland areas north and south of the river in Hamilton and possibly other counties changed the flow in ephemeral drainages that entered the valley. Before the terracing, runoff during rainstorms would have flowed into the valley and provided additional recharge of freshwater to the alluvial aquifer. Although the terracing could have increased local recharge of ground waters that might have eventually flowed in the subsurface towards the river, the expected net effect was a small decrease in the entrance of freshwater into the valley.
After ground-water use in the alluvial aquifer started near the turn of the century, the pumping wells produced local cones of depression in water-level surfaces that caused some of the slightly saline ground water in the shallow alluvium to migrate farther from the river. In addition, pumping from the Dakota aquifer in southeastern Colorado and far southwestern Kansas began to reduce the artesian head to levels such that today they are below the river channel. Thus, discharge of freshwater from the underlying Dakota aquifer to the river valley decreased. Continued pumping of the alluvial aquifer and development of the High Plains aquifer later caused further declines in ground-water levels. Once the water levels in the alluvium away from the river declined enough that river-water seepage became substantial, the alluvial water began to become appreciably more saline from the high TDS river water.
As water-level declines in the Ogallala portion of the High Plains aquifer became more pronounced from eastern Kearny County eastward through the study area, saline waters in the alluvial aquifer began to migrate farther from the river. When high flows recharged the alluvial aquifer, the mixture of water in the alluvium then contained a higher salinity than before the water-level declines. The return of the saline bank-storage water from the alluvium to the river soon after the high flow would not have diluted the lower, more saline flows as much as when the alluvial aquifer waters were fresher. Seepage from below ditch diversions and fields irrigated with river water in southwest Kansas also spread saline water farther from the river. This would have also increased the salinity of alluvial aquifer water that discharged to the river instead of infiltrating to the High Plains aquifer.
The average salinity of the Arkansas River in southwest Kansas prior to surface-water and ground-water irrigation in Colorado and Kansas is expected to have decreased downstream from the dilution by fresh ground-water discharge. The resultant effect of the processes described in the preceding paragraphs caused the salinity of the river water to stay approximately the same until it reached the stretch of the river alluvium where substantial amounts of fresh ground-water discharge diluted the salinity. As ground-water levels in the High Plains aquifer continued to decline along the Arkansas River corridor in southwest Kansas, the location where the dilution was significant slowly moved farther downstream. Today, the dilution point is east of Dodge City.
The downstream movement of the location where fresh ground-water discharge formerly diluted river water is illustrated by the increase in the salinity of lower flows in the Arkansas River water at Dodge City from before to after the 1970's. The change in the average discharge of the Arkansas River between Garden City and Dodge City (Figure 27) shows the reason for this change. The gaging station at Garden City did not operate from 1970 to 1986. Flow values for Garden City used in Figure 27 for this period are based on interpolation from discharges at Coolidge, Syracuse, Dodge City, and the irrigation diversions during 1970-1986, and the characteristics of the discharges at these locations and Garden City before and after the period. Except for unusually large flow years, such as 1965, the Arkansas River gained flow between Garden City and Dodge City up to the mid-1970's. During the late 1970's to early 1980's, the river was nearly dry at Dodge City. Thus, there was often no water to sample. When greater flows past Garden City were able to saturate the alluvial aquifer downstream to Dodge City, the river again flowed. The river water then mainly reflected the quality crossing the Colorado-Kansas state line or return of some of the bank storage of that saline water to the river. This condition has continued to the present.
Figure 27--Difference in annual discharge of the Arkansas River between Garden City and Dodge City, Kansas. Negative values indicate flow loss from Garden City to Dodge City.
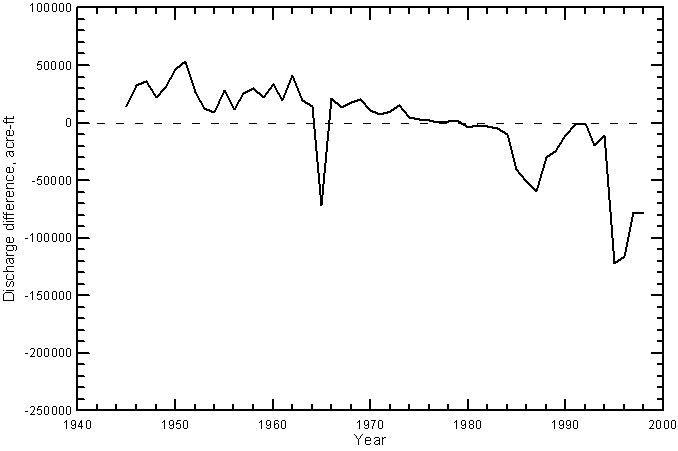
The chemistry of Arkansas River water in eastern Colorado is characterized primarily by high contents of the cations sodium, calcium, and magnesium (in order of decreasing equivalent concentrations), and the anion sulfate. Consumptive loss of water by evaporation and transpiration in eastern Colorado has greatly concentrated dissolved solids in the river. The dissolved constituents are naturally derived from flow of rain and ground water through soils and bedrock in Colorado. These constituents are then concentrated as a result of water being evaporated from reservoirs, irrigation ditches and laterals, and soils, and transpired by plants, especially in irrigated fields, while the dissolved salts remain behind in the residual water.
Water in the irrigation return flows from Colorado form much of the Arkansas River flow entering Kansas during the irrigation season. Concentrations of sodium, calcium, magnesium, sulfate, and chloride have been observed as high as 1,100, 410, 290, 3,700, and 290 mg/L, respectively, in ditch return flows in eastern Colorado (Cain, 1985); the highest specific conductance measured in the study by Cain was 6,940 µS/cm (µmho/cm) and the largest TDS content computed from these data is 5,800 mg/L. Water also seeps from the alluvium in eastern Colorado to form part of the Arkansas River flow. The ground waters in the alluvial aquifer underlying ditch irrigation in Colorado have also become saline. Cain (1985) reported dissolved sodium, calcium, magnesium, sulfate, and chloride contents as large as 1,000, 360, 320, 3,400, and 290 mg/L, respectively in ground waters in irrigated areas; the specific conductance and computed TDS concentration were as great as 6,410 µS/cm and 5,500 mg/L, respectively. Discharge of these ground waters to the Arkansas River can supply a substantial source of the river salinity. These data indicate how saline waters could potentially become in some localities of the alluvial aquifer in westernmost Kansas in the future if current conditions continue.
Increases in minor and trace constituent concentrations in the Arkansas River and irrigation return flows also occur. The increases in dissolved contents of many constituents are limited by chemical precipitation and adsorption reactions. Boron, selenium, and uranium concentrations were found as high as 2 mg/L, 68 µg/L, and 220 µg/L, respectively in surface waters collected from the Arkansas River valley in eastern Colorado during April, 1991 (Zielinski et al., 1995). The dissolved concentrations of all of these constituents were well correlated with one another, and were also well correlated with sodium, sulfate, and chloride contents (coefficients ≥0.82). This suggests that the source is the same and that the concentrations have also become elevated as a result of evapotranspiration consumption of water and concentration of the dissolved salts in the residual water.
The samples collected by the DWR and analyzed by the KGS for the Arkansas River at Holly and from Cheyenne Creek (Appendix A) show that most of the salinity variations in the Arkansas River near Coolidge are controlled by the salinity in the river at Holly. However, there are periods when the flow of Cheyenne Creek contains a substantially greater concentration of dissolved solids and other times when the Creek is substantially fresher than river water. These variations illustrate the types of changes in the return flows and tributaries entering the Arkansas River in Colorado. The result of these and other variations such as caused by reservoir storage and release is the broad scatter of points on graphs such as Figures 20-23.
Data collected for this project, which has high analytical accuracy, for the Arkansas River near Coolidge during 1993-2000 gives an average sulfate/chloride ratio of 16.1 with a range of 14.6 to 17.8. The very narrow range in the sulfate/chloride ratio for Arkansas River water entering Kansas during both high and lower flow conditions indicates that there are no significant sources affecting the the input of salinity in Colorado that would have a different composition than the main source and cause of salinity described above.
As described in the previous section on recent spatial variations in the river-water quality in Kansas, the chemical characteristics of the Arkansas River remain essentially the same as the water flows through southwest Kansas. Figure 26 showed that there is no significant trend in the sulfate/chloride ratio versus TDS concentration for 1993-2000. However, there is a small decrease in the sulfate/chloride ratio in the downstream direction from Coolidge to Dodge City as noted earlier. A decrease in the ratio suggests either a removal of sulfate from the water relative to chloride or addition of water with a lower sulfate/chloride ratio than in the river.
The most likely cause of the sulfate/chloride ratio decrease is removal of sulfate relative to chloride by precipitation of sulfate as gypsum in soils and sediments. Gypsum could form as the result of evapotranspiration loss concentrating dissolved salts in shallow groundwater in the alluvium that had entered as saline river water seepage. The precipitation of gypsum would cause removal of sulfate from solution relative to dissolved chloride. Evapotranspiration concentration of dissolved salts in the soils of the diversion ditches and of the fields irrigated by diverted river water could also result in gypsum precipitation. Discharge of alluvial ground water to the river along selected river sections and of irrigation return flow to the river with lower sulfate/chloride ratios could cause the slight decrease in the ratio downstream. As indicated earlier, sulfate/chloride ratios in the shallow, saline ground water at the multi-level observation well site in Deerfield are substantially lower than in saline ground water at the well sites in Garden City and Dodge City. The salinity at this site is derived primarily from seepage from diverted river water (Whittemore et al, 2000).
The only substantial inputs of water to the Arkansas River related to anthropogenic activities other than irrigation return flow would be effluents from municipal wastewater treatment plants, discharges from industrial operations, and stormwater runoff from cities. Stormwater runoff would be expected to be substantially less saline than high flows of the Arkansas River in southwest Kansas.
The largest discharge from a municipal wastewater facility in southwest Kansas is from Garden City. The design effluent flow of the Garden City plant is 4 mgd (million gallons per day), which is equivalent to 6.2 cfs. However, the actual flow would be less than the design flow. The average flow of the river at the Garden City gage for the last 25 years (1975-1999), which included many no or very low-flow years, was 95 cfs. The average flow during 1995-1999, a period of substantial river flows, was 310 cfs. During the last 25 years, the effluent flow from Garden City would have added about 5% of volume to the average flow of the river. During the last 5 years, the addition would have been less than 2% of the average river flow at Garden City. However, when there is no flow at the Garden City gage, the addition of the city effluent to the river downstream of the gaging station would generate the entire river flow. Under these conditions, the small effluent flow would be expected to disappear several miles downstream as the water in the channel infiltrated into the alluvial aquifer. The average sulfate and chloride concentrations of the treated effluent are 342 mg/L and 167 mg/L, respectively, based on the 12 monthly averages for 1999. The mean sulfate/chloride ratio for the effluent is 2.0. The average sulfate and chloride concentrations in Arkansas River water near Coolidge for 1975-1999 are 1,970 mg/L and 140 mg/L, respectively, giving a sulfate/chloride ratio of 14.1. The effect of the treated effluent from Garden City when the Arkansas River is flowing past Garden City would be to slightly dilute the sulfate concentration, very slightly raise the chloride content during average to high flow conditions, and very slightly decrease the sulfate/chloride ratio of the saline river water. However, the changes in the chloride content would generally not be detectable because they would usually be within the analytical error for chloride determination. During low river flows, the chloride content of the wastewater would be in the same range as that of the river water.
The other substantial discharge of wastewater to the Arkansas River in the Garden City area is from the Sunflower Electric power plant. The NPDES permitted discharge has a design flow of 0.477 mgd, which is equivalent to 0.74 cfs. This flow is less than one percent of the average river flow at Garden City over the last 25 years. The average sulfate and chloride contents of the wastewater are 2,300 mg/L and 208 mg/L, respectively, based on averages for the last 12 months of record from mid-1999 to mid-2000. Figure 23 includes the relationship between the discharge and sulfate concentration of the Arkansas River near Coolidge for the period 1987-1999. There is not as much chemical data for the river at Garden City as near Coolidge. The ratio between the annual river flow at Garden City and near Coolidge for 1987-1999 is 0.50. The average river flow for Garden City for 1987-1999 is 165 cfs. If the mean river water salinity is assumed to not change substantially from Coolidge to Garden City, then the average sulfate concentration for a flow of 165 cfs at Garden City (330 cfs near Coolidge) would be approximately 1,700 mg/L. If the full design flow of 0.74 cfs for the wastewater were to mix with the average flow at Garden City during 1987-1999, the increase in sulfate concentration would be less than 4 mg/L. At flows greater than 165 cfs at Garden City, the sulfate concentration would be lower in the river before mixing with the power plant effluent but the dilution factor would be greater. For example, if the river flow before mixing was 500 cfs and the sulfate content was 1,100 mg/L, the effect of the wastewater would be to increase the sulfate concentration by only about 2 mg/L. During low flows of the river at Garden City, the percent contribution of the power plant wastewater to the river volume would be larger, but the sulfate concentration of the river water before mixing with the wastewater would be higher. If the flow at the Garden City gage were about 50 cfs or less, the sulfate concentration would be expected to be in the range 2,300 ± 200 mg/L in the river water. This range is close to the average sulfate concentration of the power plant wastewater. Thus, the effect of the power plant at low flows is to add water that would generally be similar in sulfate content to that of the river water, whereas the effect at average and higher flows would be to increase the sulfate concentration by such a small amount that it would not be detectable based on the analytical error for sulfate determination. The average chloride content of the wastewater is less than the maximum chloride observed during low flow of the Arkansas River near Coolidge. The effect of the wastewater on the chloride concentration of average to high river flows would not be detectable. During low flows, the wastewater could raise the chloride content of the river water somewhat depending on the particular flow rates and chloride concentrations of each of the waters.
Selected chemical properties and concentrations of dissolved solids and several constituents in Arkansas River water in southwest Kansas exceed standards or guidelines for drinking, selected agricultural uses, and toxicity criteria for aquatic life. There are two types of standards for drinking water. The maximum contaminant level is a primary drinking water standard that is enforceable by law for public water supplies, whereas a maximum recommended or secondary standard is an unenforceable state or federal guideline.
The maximum TDS concentration recommended by the US EPA for drinking water is 500 mg/L if alternative fresher supplies are available. Many surface and ground waters in Kansas contain over this amount and many supplies of municipal water exceed the recommended standard for dissolved solids. In general, supplies with greater than 1,500 mg/L TDS are not used for drinking in Kansas. Only the largest flows in the Arkansas River contain less than this TDS content.
The main major constituent that affects the usability of Arkansas River water is sulfate. The recommended standard for drinking water is 250 mg/L sulfate. The US EPA has proposed a maximum contaminant level of 500 mg/L However, studies conducted for the US EPA indicate that adults can tolerate up to 1,200 mg/L without noticeable short-term effects. The investigators also attempted to determine the effect of high sulfate concentrations on infants but not enough individuals could be included where sulfate concentrations are high in public water supplies to produce statistically valid results. Arkansas River water contains a sulfate concentration that is usually a few to several times that of both the recommended standard and proposed maximum contaminant level.
The chloride content of Arkansas River waters in southwest Kansas does not exceed the recommended level of 250 mg/L for drinking waters. The high calcium and magnesium contents of the river make the water extremely hard. Total hardness (as mg/L CaCO3) usually exceeds 1,000 mg/L and nearly always is greater than 600 mg/L. In comparison, a water is considered hard and very hard if the total hardness exceeds 120 mg/L and 180 mg/L, respectively. Some individual homes with ground-water supplies affected by the large hardness of the river water use conventional water softeners based on ion exchange media. The use of the softeners decreases the calcium and magnesium contents and, therefore, the hardness but increases the sodium concentration in the water used as a result of the exchange for the calcium and magnesium. In addition, the wastewater discharge from the recharge of the softener exchange medium with dissolved rock salt (sodium chloride) contains a high chloride concentration.
Nitrate concentration is always relatively low in Arkansas River water. Nitrate-nitrogen values are generally <1 mg/L nitrate-nitrogen for high flows, 1-2 mg/L for moderate flows, and 2-3 mg/L for low flows. Pesticide concentrations are nearly always below detection. Uranium concentration in the saline low flows generally exceeds the level of 20 µg/L proposed by the US EPA as a possible standard for drinking water. Selenium concentrations do not exceed 25 µg/L, which is half the maximum contaminant level of 50 µg/L for drinking water. The US EPA has recently proposed 5 µg/L as the maximum contaminant level for drinking water for arsenic, although they will also consider alternative higher concentrations depending on public input and further review. Dissolved arsenic concentrations in Arkansas River water at the Colorado-Kansas state line are in the range <1-3 µg/L with a median value of about 1 µg/L. This range is based primarily on analyses by the USGS during 1975 to 1991. The KDHE also has determined arsenic contents of Arkansas River water but the quantifiable limit of their measurement was not as low as that of the USGS until about 1993. Recent values of the KDHE for total arsenic in the river water near Coolidge have also been in the range <1-3 µg/L. Therefore, arsenic does not exceed the standard currently proposed by the US EPA for drinking water.
A constituent that is high in the river water and which exceeds surface-water quality criteria of the Kansas Department of Health and Environment for aquatic uses is selenium. The river water entering Kansas from Colorado contains a selenium concentration that is nearly always greater than 5 µg/L, the chronic criterion for aquatic life support, and that occasionally exceeds 20 µg/L, the acute criterion for aquatic life.
The sulfate concentration of Arkansas River water entering Kansas usually exceeds the KDHE criterion of 1,000 mg/L for water supplies for stock. The same concentration limit is included in recommendations for stock water by a national agency of Canada (Environment Canada, 1978). However, sulfate concentrations of several hundred mg/L have been found to cause problems for many young livestock. Thus, Arkansas River water is not generally usable for livestock watering. Figure 9 shows that the specific conductance of the river water would need to be less than 2,400 for the sulfate concentration to be smaller than 1,000 mg/L.
The common level of dissolved solids in the river is great enough to reduce yields of crops when used as irrigation water in comparison with use of freshwater based on information of the U.S. Department of Agriculture and Kansas State University. The salinity hazard for field crops is high to very high, depending on the soil type and the dissolved solids content, for most of the flows. However, most of the studies of salinity hazards to crops are based on irrigation waters high in chloride or high in both chloride and sulfate concentrations. Studies being conducted elsewhere in the U.S. on the impact of high sulfate waters used for irrigation will allow better assessment of the salinity hazard of Arkansas River waters.
Other constituents that have concentrations that can exceed levels recommended by the KDHE for irrigation use are fluoride, boron, and selenium. Both the fluoride and boron contents in the saline water of low flows of the Arkansas River in southwest Kansas can exceed the maximum recommended levels of 1.0 mg/L and 0.75 mg/L, respectively. Figures 18 and 19 show that the specific conductance of the river water would need to exceed about 3,000 and 4,000 µS/cm for the fluoride and boron concentrations to be greater than 1.0 and 0.75 mg/L, respectively. The error in this estimation from conductance is lower for the boron than the fluoride concentration. Selenium concentrations can occasionally exceed the 20 µg/L level recommended for irrigation in saline low flows.
Cain, D.L., 1985, Quality of the Arkansas River and irrigation-return flows in the lower Arkansas River valley, Colorado: U.S. Geological Survey, Water-Resources Investigations Report 84-4273, 85 p. [available online]
Hem, J.D., 1985, Study and interpretation of the chemical characteristics of natural waters, 3rd edition: U.S. Geological Survey, Water-Supply Paper 2254. [available online]
Lewis, M.E., and Brendle, D.L., 1998, Relations of streamflow and specific-conductance trends to reservoir operations in the lower Arkansas River, southeastern Colorado: U.S. Geological Survey, Water-Resources Investigations Report 97-4239, 48 p. [available online]
Macfarlane, P.A., Whittemore, D.O., Doveton, J.H., Chu, T., Smith, M., Feldman, H., Myers, N.C., and Gillespie, J.B., 1994, The Dakota Aquifer Program: Annual Report, FY93: Kansas Geological Survey, Open-File Report 94-1, 115 p. [available online]
Mason, R.R., and Yorke, T.H., 1997, Streamflow information for the Nation: U.S. Geological Survey, Fact Sheet FS-006-97, 4 p. [available online]
Mueller, D.K., DeWeese, L.R., Garner, A.J., and Spruill, T.B., 1991, Reconnaissance investigation of water quality, bottom sediment and biota associated with irrigation drainage in the middle Arkansas river basin, Colorado and Kansas, 1988-89: U.S. Geological Survey, Water-Resources Investigations Report 91-4060, 84 p. [available online]
Sherow, J.E., 1990, Watering the Valley: Development along the High Plains Arkansas River: University Press of Kansas, Lawrence, KS, 222 p.
Whittemore, D.O., Young, D.P., and Healey, J.M., 2000, Multi-level observation well sites: Kansas Geological Survey Open-File Report 2000-42, report for the Kansas Water Office. [available online]
Zielinski, R.A., Asher-Bolinder, S., and Meier, A.L., 1995, Uraniferous waters of the Arkansas River valley, Colorado, U.S.A.: a function of geology and land use: Applied Geochemistry, v. 10, p. 133-144.
Chemical Properties and Concentrations of Dissolved Constituents in Arkansas River and Cheyenne Creek Samples Analyzed by the Kansas Geological Survey for the Upper Arkansas River Corridor Study.
Specific Conductance and Concentrations of Total Dissolved Solids, Sulfate, and Chloride Constituents in Arkansas River Water near Coolidge, Kansas from Analyses by the U.S. Geological Survey, the Kansas Department of Health and Environment, and the Kansas Geological Survey. The river discharge for the sampling collection dates is also listed.
Kansas Geological Survey
Placed online Aug. 1, 2001
Comments to webadmin@kgs.ku.edu
The URL for this page is http://www.kgs.ku.edu/Hydro/UARC/quality-report.html