Kansas Geological Survey, Open-file Report 2000-73
Part of the Upper Arkansas River Corridor Study
KGS Open File Report 2000-73
A Report to the Kansas Water Office, Contract No. 00-113
A Kansas Water Plan Project
Problem
Objectives and Scope of Work
Location and Description of Study Area
Upper Arkansas River Corridor Study
Kansas Geological Survey Study of Irrigation Water Quality
Southwest Kansas Groundwater Management District No. 3
Kansas Department of Health and Environment
Southwest Kansas Local Environmental Planning Group
U.S. Geological Survey
Chemical Characteristics of Ground Water in the Alluvial and High Plains Aquifers
Major Constituents
Total Dissolved Solids
Specific Conductance
Relationship of Specific Conductance and Total Dissolved Solids
Relationship of Specific Conductance and Major Dissolved Constituents
Minor Constituents
Calculated Properties
Chemical Characteristics of Ground Water in the Cretaceous Bedrock
Spatial Variations in Ground-water Quality
Preparation of Data and Generation of Sulfate Distribution Maps
Salinity Distribution in the Quaternary Alluvial Aquifer
Salinity Distribution in the High Plains Aquifer
Areal Distribution
Vertical Distribution
Nitrate in the Alluvial and High Plains Aquifers
Temporal Variations in Ground-water Quality
Salinity Variations
Hamilton County
Kearny County
Finney County
Gray County
Ford County
Nitrate Variations
Sources of Salinity in the Ground Water
Usability of Ground Water in the River Corridor
Water Quality Relative to Drinking-Water Standards
Water Quality Relative to Agricultural Uses
Appendix A. Kansas Geological Survey Analyses of Ground Water in the Upper Arkansas River Corridor
Appendix B. Data File Used for Generating Sulfate Concentration Map for the Quaternary Alluvial Aquifer in the Upper Arkansas River Corridor
Appendix C. Data File Used for Generating Sulfate Concentration Map for the High Plains Aquifer in the Upper Arkansas River Corridor
This project was funded (in part) by the Kansas Water Plan. Susan Stover, Gerald Hargadine, and Thomas Stiles of the Kansas Water Office assisted in coordination of activities related to the study contracts and review of documents that led up to this report.
Appreciation is expressed to Julie Grauer (now head of the Subbasin Program), Eric Hargett, Kari Eck, and Jeff Lanterman (now in the Stafford Office of the Division of Water Resources) of the Upper Arkansas River Subbasin Water Resources Management Program and Mark Rude, Commissioner of the Garden City Office, Division of Water Resources, Kansas Department of Agriculture (KDA) for cooperative work on the project. Diane Coe, Southwest Kansas Groundwater Management District No. 3 and Director of the Southwest Kansas Local Environmental Planning Group supplied computer files of ground-water quality data and worked with the Kansas Geological Survey (KGS) to verify information in the data. Georgia Shrauner and Jerry Wilson of the KDA collected ground-water samples as a part of the KGS cooperative sampling and analysis program. Georgia Shrauner also assisted in selecting irrigation well sites for resampling that had been sampled by the KGS during 1975.
Wayne West, City Administrator of Deerfield, and Perry Smith, Water Superintendent of Holcomb assisted the KGS in the sampling of the municipal wells of the cities. Staff of the City of Garden City assisted the DWR in sampling the sand hills municipal wells. David Glenn, Water Utilities Superintendent of Garden City provided analytical data for municipal well samples. Other staff of the City of Garden City assisted the KGS in answering questions concerning the municipal wells.
John Healey of the Kansas Geological Survey (KGS) prepared and operated the pumping equipment used to collect water samples from observation wells. Jill Whitmer assisted in field chemical measurements, collection, and analysis of some of the water samples from observation wells. Gwen Macpherson of the Department of Geology at the University of Kansas assisted Jill Whitmer in determination of trace substances in observation well samples. Lawrence Hathaway, Truman Waugh, and L. Michael Magnuson of the analytical services group of the KGS analyzed all the water samples collected for the study for major and minor dissolved constituents. Jeffrey Schloss, Data Manager of the Geohydrology Section at the KGS assisted in obtaining electronic data for the project and preparing coverages for map production and web site pages. Jamie Katz of the KGS assisted in the preparation of the GIS coverages of sulfate data points for use in contour digitizing. David Young of the KGS and Eric Hargett of the DWR provided useful suggestions that were used to clarify the report text.
This report describes the ground-water quality of the upper Arkansas River corridor in southwest Kansas and includes the chemical data for ground waters sampled and analyzed for the Upper Arkansas River Corridor Study. The study is a Kansas Water Plan project conducted for the Kansas Water Office during 1995-2000. The study area comprises the Arkansas River corridor in Hamilton, Kearny, Finney, Gray, and Ford counties. The main problem is the contamination of ground waters in the alluvial and High Plains aquifers by saline water of the Arkansas River that enters Kansas from Colorado.
The increase in salinity of the ground waters in the river corridor derives primarily from infiltration of saline waters from the Arkansas River. The seepage occurs from the river channel into the alluvial aquifer and then into the underlying High Plains aquifer, and also from below irrigation canals, ditches and fields irrigated with the river water. Dissolved solids contents in ground waters unaffected by the river water are as low as less than 300 mg/L. These waters are primarily calcium-bicarbonate in chemical type. With increasing salinity, the water type changes to calcium-sulfate to calcium, sodium-sulfate to sodium, calcium-sulfate and finally to sodium-sulfate. The TDS concentration ranges to over 4,000 mg/L in ground waters affected by saline river water and ditch irrigation. Sulfate concentration ranges from less than 30 mg/L in the freshest waters to over 2,700 mg/L in the most saline ground waters. The chloride concentration is less than 10 mg/L in the freshest ground water and is usually less than 300 mg/L in the most saline water affected only by saline river water and ditch irrigation. Sulfate/chloride ratios range from as low as near one for some fresh waters to over 16 for some saline ground waters. Saline waters with chloride levels substantially greater than 300 mg/L or with relatively low sulfate/chloride ratios in comparison with other ground waters impacted by river water derive additional chloride from waste sources. These include saltwater discharge from conventional water softeners. The high calcium and magnesium contents of the ground waters made saline by river water seepage make the waters extremely hard. Hardness (as CaCO3) substantially exceeds 1,000 mg/L in many of the saline ground waters. Nitrate-nitrogen concentrations range from less than one mg/L to over 30 mg/L. There are both fresh and saline ground waters with nitrate-nitrogen levels exceeding the drinking water standard of 10 mg/L. The source of high nitrate in ground waters is not the Arkansas River, which has nitrogen-nitrate contents that are nearly always less than 3 mg/L. The relationships between specific conductance and dissolved solids, sulfate, sodium, calcium, magnesium, chloride, potassium, boron, and hardness concentrations and also sodium adsorption ratio and soluble sodium percentage are all highly significant and can be used to estimate the concentrations of these substances to varying degrees of accuracy.
Water-quality data indicate that the dissolved solids contents of the alluvial and High Plains aquifers were much smaller before the start of ditch irrigation and ground-water pumping. Ground water in the High Plains aquifer is expected to have been fresh (less than 1,000 mg/L total dissolved solids content) throughout the entire corridor of the upper Arkansas River before the late 1800's. However, the dissolved solids concentration was generally greater north of the Arkansas River in eastern Kearny, northern Finney, and northwest Gray counties than south of the river. The area with the highest natural background of dissolved solids is the Scott-Finney depression that extends from southern Scott County through part of Finney County to the Arkansas River. The TDS and sulfate concentrations are just over 1,000 and around 500 mg/L, respectively, in a small area of northern Finney County near the Scott County line. The background dissolved solids decrease towards the Arkansas River. Ground waters in the High Plains aquifer before ditch irrigation and ground-water development were fresh, with less than 50 mg/L sulfate concentration at Lakin, less than 120 mg/L at Deerfield, less than 80 mg/L at Holcomb and Garden City, and less than 60 mg/L at Cimarron and Dodge City.
In general, current sulfate contents of the alluvial aquifer decrease eastward from Hamilton County through Ford County. The sulfate values typically exceed 2,000 mg/L in the ground water in Hamilton County. Sulfate concentrations in most of the alluvial aquifer from Kearny County through Finney County range between 1,500 and 2,000 mg/L. In Gray County, the area with 1,500-2,000 mg/L sulfate content narrows within the alluvial valley to be mainly near the Arkansas River. The band of 1,500-2,000 mg/L sulfate concentration in the alluvium along the river extends to near Dodge City. A zone of ground water with 1,000 to 1,500 mg/L sulfate concentration follows the alluvium near the river past Dodge City. In general, ground water salinity in the alluvial aquifer near the edges of the alluvium in Gray and Ford counties is substantially less than near the river.
The present sulfate concentration in the High Plains aquifer is greater than 1,000 mg/L in the ground water underlying most of the Quaternary alluvium in Kearny County and under substantial parts of the alluvial aquifer in Finney County. The area with ground waters containing over 1,000 mg/L sulfate extends into part of the ditch irrigation service area to the north of the alluvial valley and east of the Amazon canal in Kearny and Finney counties. South of the Arkansas River in eastern Kearny and western Finney counties, an area of elevated sulfate concentrations (greater than 100 mg/L) extends south of the alluvial aquifer boundary. Essentially all the saline water in the High Plains aquifer in the Arkansas River corridor in Gray and Ford counties underlies the Quaternary alluvium. A band of ground water with greater than 500 mg/L sulfate content extends from southeast of Garden City through most of Gray County. In Ford County, only isolated areas of the High Plains aquifer (primarily in the Dodge City area) contain greater than 500 mg/L sulfate concentration. The ground water in the High Plains aquifer south of areas affected by the river water is fresh along the river corridor, with sulfate concentrations less than 50 mg/L. Ground waters in the upper Dakota aquifer underlying the upper Arkansas River corridor are fresh.
The salinity of municipal well waters pumped from the High Plains aquifer has substantially increased along the upper Arkansas River corridor since the early 1900's. The sulfate concentration exceeds 1,000 mg/L in the High Plains aquifer underlying Lakin, which now obtains fresh ground water for its public supply from an area a couple miles northwest of the city. The sulfate concentration has increased to appreciably over 250 mg/L in water pumped from the main wells at Deerfield and the high capacity wells of Holcomb. Sulfate values have increased greatly in the ground water pumped from the High Plains aquifer for supplies within Garden City. There is a large range in the water quality under the city, with a few wells that pump water with over 1,000 mg/L sulfate content when operating. The spatial and temporal variations in the salinity are both large. The two most northerly wells in the group of 7 sand hills wells of Garden City located a few miles south of the Arkansas River recently began to draw in saline ground water. Sand hills well 5 yielded water with a sulfate content exceeding 700 mg/L when sampled in 2000. Although some ground waters in the High Plains aquifer in Gray County have increased substantially in salinity, the water supply of Cimarron, located at the edge and to the north of the alluvial aquifer, has only been affected by a small amount. The salinity has increased greatly in the municipal well waters of Dodge City pumped from the High Plains aquifer underlying the river alluvium. Three of these wells produce water with over 500 mg/L sulfate content. In comparison, the water from city wells in the High Plains aquifer located at the edge of the alluvial valley has either changed little or has only increased a small amount in sulfate concentration. Dodge City wells to the north of the alluvial valley yield freshwater that is unaffected by the saline water in the alluvial aquifer.
Substantial thicknesses of clay layers underlying parts of the alluvial aquifer and within much of the High Plains aquifer retard the downward movement of saline water from the alluvium and irrigated areas. However, gravel packs of large capacity wells (mainly irrigation wells) without grout seals or in which the grout seals are not deep enough to seal off shallow saline water can allow flow across the clay layers. The wells allowing gravel-pack flow include actively used, plugged, and abandoned wells. The usual method of plugging an abandoned well involves sealing the inside of the casing and not the gravel pack in the annular space outside the casing. Abandoned, unplugged wells with corroded casing could allow direct flow down the casing opening to the water table. Cross flow of shallow aquifer water to deeper zones can explain the substantial variations in salinity and nitrate concentrations observed for the High Plains aquifer. Although expensive, sealing of the gravel pack in abandoned wells is an important approach to preventing shallow contamination in the wellhead protection area of a municipal well in the river corridor.
The Arkansas River in southeastern Colorado and westernmost Kansas is one of the most saline rivers in the United States. Diversion of water for irrigation and evapotranspiration in Colorado have substantially decreased the flow and greatly increased the salinity of the river waters entering Kansas. In addition to salinity, the concentrations of many other dissolved constituents in the river water are high.
Ground-water levels have declined in the High Plains aquifer in southwest Kansas due to decreased recharge from the Arkansas River and pumpage from the aquifer. Arkansas River flow that enters Kansas from Colorado is lost between the state line and Dodge City because of infiltration through the streambed, diversion from the river for irrigation, and evapotranspiration by phreatophytes. Saline water from the river and from irrigated fields is infiltrating to and contaminating the ground water in the alluvial and High Plains aquifers in the upper Arkansas River corridor. Ground-water declines in the High Plains aquifer have also decreased the amount of fresh subsurface flow to the alluvium that diluted salinity and other constituent concentrations in the past. Another ground-water quality problem in the upper Arkansas River corridor is increasing nitrate concentrations. Municipal ground-water supplies that are or may be impacted by salinity and nitrate contamination include those for Syracuse, Lakin, Deerfield, Holcomb, Garden City, Cimarron, and Dodge City.
The distribution of salinity and the mechanisms for its entrance into and movement within the High Plains aquifer were not well known before this study. An assessment of the sources, migration, present distribution, and possible future extent of the ground water contamination is critical for developing plans for minimizing or mitigating ground-water quality problems in the river corridor. The Upper Arkansas River Corridor Study was developed to provide information regarding salinity within the Arkansas River and associated aquifers within the study area to enable agencies, municipalities, agriculture, and industries in the region to better manage water resources in order to minimize or mitigate water-quality problems.
The basic objectives of the study comprise major parts of the objectives listed under the water-quality and ground-water decline issues in the subsection on the Arkansas River Corridor Subbasin in the Upper Arkansas Basin section of the Kansas Water Plan:
The study was proposed as a 5-year plan in which the Kansas Geological Survey (KGS) would design and conduct hydrogeological and geochemical investigations in cooperation with several local and state agencies. This report addresses objectives related to the quality of ground water within the study area. The major objectives discussed within this report include:
Knowledge of the chemical characteristics of the ground water and spatial distribution of dissolved constituents is necessary for determining the impact on water use in the corridor. Information on the spatial changes and temporal variations in the ground-water quality salinity are needed to compare to changes in water levels and ground-water flow so that conceptual models of the fate and transport of the river water can be developed. The findings on ground-water quality, along with the results from other reports of this study on the aquifer hydrogeology and river-water quality, form the basis for developing and interpreting a numerical model of salinity movement.
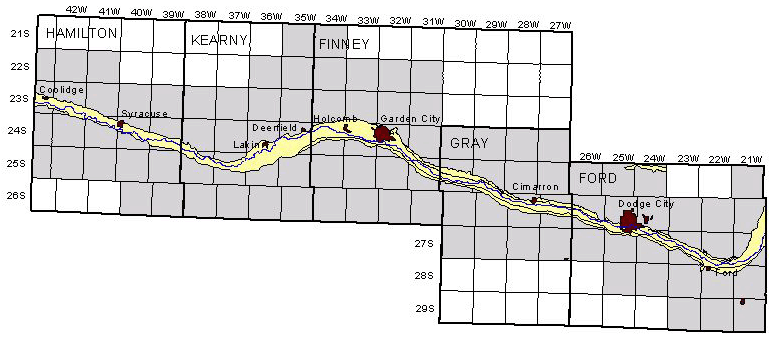
The study area includes the Arkansas River corridor from the Colorado state line through Hamilton, Kearny, Finney, Gray, and Ford counties (Figure 1). The area includes the Intensive Groundwater Use Control Area (IGUCA) of the upper Arkansas River valley, the portions of Hamilton, Kearny, and Finney counties that use ditch irrigation, and a buffer zone outside of these areas. The buffer zone was selected to include freshwaters in the High Plains aquifer just outside of the area affected by salinity. The study area lies within the High Plains region of the Great Plains physiographic province. There are no substantial tributaries to the Arkansas River from Hamilton County eastward to the middle of Ford County. Mulberry Creek joins the Arkansas River in eastern Ford County near the town of Ford. In addition to the High Plains and overlying alluvial aquifers, the study area includes the alluvial aquifer in the bedrock trough underlying and to the south of the Arkansas River valley in Hamilton and western Kearny counties. Ground water is also obtained for water supplies within the study area from the Cretaceous bedrock (primarily the Dakota Formation) underlying productive portions of the High Plains aquifer and in locations where the High Plains aquifer is not present or its saturated thickness is too thin to supply water to wells.
Figure 1--Location of the area of the Upper Arkansas River Corridor Study within the 5-county region. The study area is shaded.
The KGS collected and analyzed water samples from observation wells installed during the study and from municipal supply and stock wells in the study area. As a part of a cooperative program with the Kansas Department of Agriculture (KDA), the KGS analyzed water samples that the KDA collected from irrigation wells. For selected sampling periods, the KGS worked with the KDA to select wells that would provide special information for the Upper Arkansas River Corridor Study in addition to meeting the needs of the KDA. The KGS analyzed the samples collected by the KDA for inorganic constituents, including nutrients, and supplied the results to the KDA. The KGS arranged with the Division of Water Resources (DWR) of the KDA to sample waters from 7 municipal wells of Garden City that the KGS then analyzed. The KGS analyzed a total of 226 samples of ground-water that were associated with the Upper Arkansas River Corridor Study. These analyses are listed in Appendix A.
KGS and other agency staff collected the water samples in polyethylene containers. Samples for complete determination of major and minor constituents and most samples for selected conservative constituents were placed in a cooler with ice for preservation at the collection site. The samples remained refrigerated before and during transfer to the KGS. The KGS kept the samples refrigerated until analysis by the analytical services staff. The laboratory filtered the samples through 0.45 µm membrane filter paper before analysis. The analyses therefore represent dissolved constituent concentrations. The KGS analyzed all samples for specific conductance and concentrations of sulfate and chloride. The KGS also analyzed selected samples for laboratory pH, alkalinity (bicarbonate and carbonate), calcium, magnesium, sodium, potassium, strontium, silica, fluoride, nitrate, and boron.
The laboratory used an automated titrimeter for the determination of alkalinity. Determination of pH and fluoride concentration involved specific ion electrodes. The method for determining concentrations of the anions chloride and sulfate was colorimetry in an automated, segmented flow instrument (Technicon AutoAnalyzer) up to 1999. During 1999-2000, the KGS used a flow injection instrument to measure chloride and sulfate contents. The KGS used the AutoAnalyzer to measure nitrate concentration by UV spectrophotometry. The instrument for determination of calcium, magnesium, sodium, potassium, silica, and boron concentrations was an argon plasma inductively coupled spectrophotometer.
The KGS uses quality assurance/quality control procedures to ensure accurate analytical results. This includes pre-diluting samples into the optimum range of the analytical methods. If the sample constituent concentration exceeded or was near the upper limit of the analytical method range, the sample was diluted into the optimum range and reanalyzed for that constituent. The charge balance is calculated for all samples with determinations of all major and important minor constituent (calcium, magnesium, sodium, potassium, alkalinity, sulfate, chloride, nitrate, and fluoride); the error is usually less than 2% and is essentially always less than 3%. In general, the charge balance error is greater for samples that are very fresh because the constituent concentrations are small. All of the analyses in Appendix A for which all the major constituents were determined (204 samples) and that contained greater than 300 mg/L TDS had charge balance errors less than 2%. Ten of the 204 analyses had charge balance errors between 2.1% and 2.5% and contained less than 300 mg/L. The analysis for the sample with the lowest TDS (185 mg/L) had a charge balance error of 3.1%. The average charge balance error for the analyses in Appendix A is -0.3%.The analytical services laboratory participates in the USGS program for analysis of standard reference waters on a regular basis to provide for additional assurance of accuracy of results. Results from this program indicate low error in KGS analyses.
The KGS chemical analyses for ground waters sampled in the Upper Arkansas River Corridor Study are listed in Appendix A. The appendix includes data for municipal, irrigation, industrial, and stock wells, multi-level observation wells installed as a part of the corridor study, and observation wells constructed for a cooperative KGS and DWR project. Sulfate and chloride concentration data for all the analyses are included in Appendices B and C, which are the files used to generate sulfate distribution maps for the alluvial and High Plains aquifers, respectively, in the river corridor.
The KGS conducted a sampling and analysis program from 1974-1980 to determine the quality of irrigation waters in the High Plains aquifer. The sampling of irrigation wells in Hamilton, Kearny, Finney, and Gray counties occurred during the end of July 1975 and 1976 (Hathaway et al., 1977 and 1978a) whereas the water collection in Ford County was at the end of July 1977 (Hathaway et al., 1978b). The data were used in evaluating changes in water quality in the High Plains aquifer. Selected data were used to aid the generation of the sulfate distribution map for the Quaternary alluvial aquifer (Appendix B).
The Southwest Kansas Groundwater Management District No. 3 (GMD3) initiated a program of sampling wells to determine water quality in 1988 (Coe, 1998). The GMD3 selected wells approximately 6 miles apart in the District area for the sampling program. The District area includes all of 8 counties and part of 4 counties in southwest Kansas. The 1998 report on the results described the network as consisting of 363 wells of which there are 315 irrigation, 31 domestic, 11 stock, and 6 industrial wells. Most of the wells were sampled in 1988-1990, 1991-1993, and 1996-2000. The GMD3 obtained well depth and age from water use reports and water right information for many of the wells. The District sent most of the samples to Servi-Tech Laboratories of Dodge City for analysis.
The GMD3 extracted data for Hamilton, Kearny, Finney, Gray, and Ford counties in 1995 and 2000 and sent electronic files of the water-quality data to the KGS for use in the corridor study. The KGS worked with the GMD3 on examination of the well locations and analytical data in the data set for quality control. The charge balance error calculations indicate that the quality of the analyses is generally very good; errors are less than 5% for most of the analyses and the number of analyses with errors greater than 10% is less than a couple percent of the total. The more recent data contained a smaller percent of error; about 3% of the analyses prior to 1994 had greater than 10% charge-balance error, whereas only two out of over 400 analyses of samples collected after 1995 had errors slightly greater than 10% (both less than 10.2%). Most of the analyses with more than 10% error were freshwaters with sulfate concentrations less than 50 mg/L. Thus, these data were used for generating maps because the errors were not large enough to change the characterization of the water as fresh with low sulfate content. The other data with greater than 10% error either were used because the error was not substantially over 10% and possible error in the sulfate determination would not have significantly changed the interpretation for map generation, or were not used because there are data for later samples from the same well with error less than 10%. The KGS examined the information on location, depth, and use of the wells to assign aquifer codes to the samples. The KGS also assigned most probable aquifer codes to wells without depth values based on comparing well location and use to the hydrogeology and typical well construction for the area around each well. Selected data for the GMD3 water-quality program are included in Appendices B and C.
The Kansas Department of Health and Environment (KDHE) has conducted sampling of a network of wells across Kansas for about a decade. The network comprises about 450 wells. There are from 4 to 5 wells per county in the upper Arkansas River corridor. The U.S. Geological Survey (USGS) originally established a ground-water sampling network in the 1960's that grew to about 500 wells. The KDHE took over sampling of the network and analysis of the samples in 1990. The data are included in the STORET database of the U.S. Environmental Protection Agency as well as in KDHE databases. The KDHE data file includes information on the aquifer from which the wells draw ground water. Data for the network were examined for this report.
The KDHE analyzes samples of public supply waters as a part of the state program to ensure that drinking waters are safe. Some of the samples are from wells but many of the samples are taken from the point of entry into a water system or from the distribution system. The KGS obtained data from the KDHE and extracted selected analyses for use in this report. All data for samples designated as collected from wells were evaluated for this report. However, only selected analyses for samples from the point of entry or distribution system were considered in this report because many water-supply systems have more than one well that may be connected together and sampled as a mixture at the entry or in the distribution system. The records considered were those where it was clear that the record referred to the point of entry from an individual well or the system is small and there is only one well. Only a few records for samples from the distribution system were used; these are for small systems with only one well. The main constituents of interest are sulfate, chloride, and nitrate. These substances, especially sulfate and chloride, are conservative and their concentrations would not be substantially affected by chlorination of the water at the well.
Selected KDHE data from the ground-water monitoring network and the databases for public supply waters are included in Appendices B and C.
The Southwest Kansas Local Environmental Planning Group (SWKLEPG) collected water samples from domestic wells in an area that included all five counties of the upper Arkansas River corridor. The SWKLEPG conducted the sampling program during 1991-1996. The number of wells sampled was smaller than that for the GMD3 program in the five counties of the upper Arkansas River corridor. The KGS obtained electronic files of these data and selected those records for which there was sufficient location information to be useful for this study. The location and any depth information available for wells in the data set were examined relative to typical well construction in the area surrounding the wells and most probable aquifer codes assigned to the records. Nearly all of the domestic wells located in the areas of the corridor that overlie the High Plains aquifer are screened in the lower part of the aquifer and are sealed through the upper portions of the High Plains aquifer and any alluvium. This construction is designed to prevent contamination through the annual space from shallow ground waters. Selected SWKLEPG data are included in Appendices B and C.
Chemical data for ground waters were extracted for the river corridor from the QWDATA database of the USGS. The records include samples collected primarily by the USGS, including sampling as a part of the USGS-KGS cooperative studies of the five counties in the upper Arkansas River corridor conducted from the late 1930's to 1941 and published as KGS Bulletins (Waite, 1942; McLaughlin, 1943; Latta, 1944). Chemical data from USGS publications examined for this report (such as Meyer et al., 1969 and 1970) are also in the QWDATA database. Selected USGS data are included in Appendices B and C.
The ground water in the Quaternary alluvial aquifer that underlies the current floodplain of the Arkansas River is generally saline (greater than 1,000 mg/L total dissolved solids {TDS}) along most of the Arkansas River corridor from the Colorado-Kansas state line through Ford County. The ground water in the High Plains aquifer ranges widely in quality from very fresh (less than 500 mg/L TDS) to the south of the alluvial valley of the river to saline underneath parts of the river valley and the ditch irrigation areas. The saline water primarily contains high concentrations of sulfate, sodium, calcium, and magnesium, as well as elevated contents of many other inorganic constituents. Water in the upper Dakota aquifer underlying the upper Arkansas River corridor in southwest Kansas is fresh. The pH of the ground water in the High Plains and alluvial aquifers averages 7.6 and is usually in the range 7-8 units in comparison to the pH of the river water, which is nearly always within the range 7.5-8.5 and averages near 8 units.
Most laboratories measure quantities of water by volumetric equipment for purposes of chemical analysis. Therefore, the mass-per-volume units that have become a common standard for reporting the concentration of major constituents are milligram/liter (mg/L) and for trace substances are microgram/liter (µg/L). The mass-per-mass units for mg/L that were formerly in much more common use than today are parts per million (ppm) and for µg/L are parts per billion (ppb). Although ppm and ppb are nearly the same as mg/L and µg/L, respectively, in freshwater, the greater the salinity of a water, the greater the difference in the units. For very saline waters, analyses made using volumetric quantities of water must be corrected for density in order that ppm and ppb values are correct. The U.S. Geological Survey formerly used the units ppm and ppb for reporting water analyses but changed to the units mg/L and µg/L about 30 years ago (the units first appeared in the USGS reports Water Resources Data for Kansas in 1968). In some cases, it is useful to represent the concentration of major dissolved cations and anions in water in equivalent-weight units. The units milliequivalents per liter (meq/L) are obtained by multiplying the value in mg/L by the charge of the dissolved ion and dividing by the formula weight of the ion. The equivalent concentration is useful when considering the charge or combining capacity of the dissolved constituents. The equivalent concentration is used in describing a water in terms of a chemical type, such as calcium-carbonate, sodium-sulfate, etc.
Some commercial laboratories report sulfate as sulfur when evaluating constituent concentrations relative to irrigation use. A concentration value listed as mg/L (or ppm) sulfur can be converted to sulfate (the form in which it exists in the waters of southwest Kansas) by multiplying by 2.996. Nitrate concentrations are usually reported as nitrate-nitrogen. The conversion factor for nitrate-nitrogen to nitrate is 4.427.
The chemical character of a water is determined by the major chemical properties and the relative concentrations of different dissolved constituents. The major dissolved constituents in ground water of the upper Arkansas River corridor in southwest Kansas are those dissolved inorganic substances that are usually greater than 10 mg/L. The major dissolved cations (positively charged species dissolved in water) in the ground water in the river corridor are sodium (Na), calcium (Ca), and magnesium (Mg). The major anions (negatively charged species) are sulfate (SO4), chloride (Cl), and bicarbonate (HCO3), although nitrate (NO3) sometimes exceeds 10 mg/L in the ground waters. Although most of the cations and anions exist as individual ions dissolved in the ground water (as Na+, Ca2+, Mg2+, SO42-, Cl-, HCO3-, NO3-), substantial concentrations of selected ions are associated with one another (particularly calcium, magnesium, and sulfate which form the dissolved ion pairs CaSO4o and MgSO4o). Therefore, the concentration of a constituent is best referred to as the total amount dissolved in the water. The concentration of dissolved silica, which is reported as SiO2, is usually in the range 16-36 mg/L in ground water of the river corridor. Essentially all of the silica dissolved in the ground water occurs as undissociated silicic acid (H4SiO4).
The freshest ground water (less than 300 mg/L TDS) in the High Plains aquifer of the river corridor is primarily calcium-bicarbonate in chemical type, meaning that calcium is the main cation and bicarbonate is the main anion in the water when equivalent concentrations are considered. Some very fresh ground waters may also be calcium, magnesium-bicarbonate or calcium-bicarbonate, sulfate in chemical type. If two cations or anions are included in the chemical type label, the equivalent concentration of the second of the cations or anions is smaller but relatively close to that of the first cation or anion.
As dissolved solids in the fresh ground waters in the High Plains aquifer increase, the concentration of sulfate increases whereas the bicarbonate content does change appreciably. The water changes from calcium-bicarbonate type to calcium-bicarbonate, sulfate type, to calcium-sulfate, bicarbonate type, and finally to calcium-sulfate type as the TDS approaches 1,000 mg/L in ground waters in the alluvial and High Plains aquifers. Further increases in TDS are accompanied by a greater rate of increase in the sodium content than in the calcium concentration. The sodium content is close to that of calcium for ground waters in the alluvial and High Plains aquifers with between 2,000 and 3,500 mg/L TDS content. The chemical water type for this TDS range is usually calcium, sodium-sulfate to sodium, calcium-sulfate. Above 3,500 mg/L TDS, the water is generally of sodium-sulfate type because the sodium is usually substantially greater than the calcium concentration.
As the TDS increases in the saline ground waters affected by seepage of Arkansas River water, the chemical composition approaches that of the river water. The saline water in the Arkansas River in southwest Kansas is much higher in sulfate than chloride content. The relative order of mass concentrations (mg/L) of the major dissolved constituents in most flows of the Arkansas River in Kansas is sulfate > sodium > calcium ≈ bicarbonate > magnesium > chloride > silica. Salinities are smaller in high river flows and calcium mass concentration generally exceeds that of bicarbonate and approaches that of sodium. Low river flows contain greater dissolved solids and the mass concentration of calcium exceeds that of bicarbonate. The river waters are of sodium-sulfate chemical type during low to moderately high flows, and of calcium, sodium-sulfate type only during the highest flows. Mass and equivalent concentrations of sulfate are always the greatest of any dissolved constituent in the river waters.
Sulfate mass and equivalent concentrations in ground waters in the alluvial and High Plains aquifer are nearly always the highest of any dissolved constituent for TDS contents greater than 700 mg/L. The sulfate content comprises greater than 50% of the TDS concentration in most of the ground waters with greater than 1,000 mg/L and usually constitutes from 55-60% of the TDS. Sulfate concentration ranges from less than 30 mg/L in the freshest waters to over 2,700 mg/L in the most saline ground waters. The chloride concentration is less than 10 mg/L in the freshest ground waters but does not exceed 300 mg/L in the most saline waters affected only by saline river water and ditch irrigation. Calcium and magnesium contents range from less than 60 and 20 mg/L, respectively, in the freshest waters to over 400 and 200 mg/L, respectively, in the most saline ground waters. Sodium ranges from less than 20 mg/L to over 700 mg/L in the freshest and most saline ground waters, respectively. Bicarbonate contents are usually in the range 160-240 mg/L for the freshest ground waters and generally between 300 and 450 mg/L for the most saline waters. The maximum concentrations are somewhat greater than for the maximum values in the most saline waters of the Arkansas River in Kansas due to additional concentration of dissolved constituents by evapotranspiration consumption of water. The maximum values for dissolved calcium, magnesium, sodium, bicarbonate, sulfate, and chloride occur in ground waters of the Quaternary alluvial aquifer in Hamilton County.
Dissolved nitrate in ground waters in the Arkansas River corridor is usually a minor constituent but can be a major constituent when in high concentrations in a freshwater or slightly saline water. Nitrate concentrations range from less than 1 to over 30 mg/L as nitrate-nitrogen (less than 4 to greater than 130 mg/L as nitrate) in the ground waters. This compares to nitrate-nitrogen values of less than 3 mg/L in most flows of the Arkansas River.
The concentration of total dissolved solids (TDS) is the best individual value representing the salinity of a water. Most of the TDS content consists of the major dissolved constituents. TDS concentrations can be measured by evaporation of a measured volume of water sample to dryness, using a drying temperature of greater than boiling (usually 180 °C although some earlier procedures used temperatures of 103-110 °C), and weighing of the residue. Dissolved solids contents can also be calculated by summing the concentrations for the dissolved constituents, assuming that all of the major dissolved substances have been determined in an analysis. If a complete analysis is available, the sum of constituents method saves much time in comparison to the time-consuming analytical procedure. The analytical method is also subject to a larger error than determinations of major constituents due to the difficulties in accurately measuring the small weight of the residue in comparison with the large weight of the container. In addition, the sum-of-constituents method may be preferable to the analytical procedure due to the different amounts of water of crystallization that various types of residues contain.
The residue left after evaporation of ground water in the Arkansas River corridor to dryness would consist primarily of sodium, calcium, and magnesium sulfates and carbonates. During the drying, gypsum (CaSO4 · H2O) precipitates and then partially dehydrates at the higher temperatures of drying at the end of the procedure. However, Hem (1985) indicates that "even though dehydration of gypsum is supposed to be complete at 180 °C, it is not uncommon for water high in calcium and sulfate concentrations to yield a residue after drying for an hour at 180 °C that exceeds the computed dissolved solids by several hundred milligrams per liter." The retention of water of crystallization can result in greater values of TDS reported for ground waters by the residue analysis than by the constituent sum computation.
At temperatures greater than 100 °C, bicarbonate is unstable. Half of the bicarbonate decomposes to form carbonate, which combines with cations in the residue, and the other half is lost as carbon dioxide and water (Hem, 1985). The Kansas Geological Survey follows the sum-of-constituents procedure of the U.S. Geological Survey that accounts for this decomposition. The bicarbonate concentration is multiplied by a gravimetric factor (mg/L HCO3 × 0.4917 = mg/L CO3) to represent the amount of carbonate that would be left in the residue of the analytical method.
Although the KGS has determined dissolved solids for water samples in the past, the Survey now uses the sum-of-constituents procedure. The concentrations of the major dissolved substances silica, sodium, calcium, magnesium, sulfate, bicarbonate, chloride, and nitrate generally comprise over 98 percent of the dissolved solids in the ground waters of southwest Kansas. Although the KGS does not determine organic carbon in water samples, USGS data for ground waters in Kansas indicate that the concentration of dissolved organic carbon is usually less than a few mg/L. Some of the dissolved organic matter could volatilize during drying and part could be oxidized and lost as carbon dioxide. The amount of dissolved organic matter would have an insignificant contribution to the total dissolved solids concentration. Thus, an accurate calculation of TDS concentration for the ground waters in southwest Kansas can be made given only analytical data for the major dissolved constituents. If silica has not been determined, it can be estimated for the sum-of-constituents calculation by using a value in the range of 20-30 mg/L for most ground waters in the river corridor.
The range in the TDS concentrations for ground waters from the upper Arkansas River corridor analyzed for this study is 185-4,919 mg/L.
The electrical conductivity of a water is a chemical property that is proportional to the TDS concentration. Conductivity is also one of the easiest measurements to make in the field or laboratory. Therefore, the conductivity of a water is often determined and used as a measure of salinity. For example, the conductivity, rather than the dissolved solids concentration, is the measurement commonly employed for designating the salinity hazard of a water for field crops.
Conductivity is measured with a cup or dip type cell with electrode surfaces that are configured such that an electric current will pass through a particular volume of water. The electrical conductivity of a substance is the reciprocal of resistance. The units of specific electrical conductance are defined as the reciprocal of the resistance of a centimeter cube of aqueous solution. The International System of Units for current scientific use expresses conductance as siemens (S), which is the same quantity as the mho. The expression mho was derived as the reverse spelling of the resistance unit ohm and can be found in older publications. The units most commonly used for specific electrical conductance of a water are microsiemen per centimeter (µS/cm), which are the same as the units micromho/centimeter (µmho/cm). Soil scientists generally use the units decisiemen per meter (dS/m or one-tenth of a siemen per meter), which are the same as the units millimho per centimeter (mmho/cm) previously used.
The conductivity of an aqueous solution varies proportionally with the temperature. An increase in one °C in a fresh to slightly saline water results in an increase of about 2% in the specific conductance when the temperature is near 25 °C. Specific conductances values are therefore corrected for temperature and reported at the standard temperature of 25 °C. Older conductivity meters may require measurement of the temperature and meter adjustment or manual calculation of the temperature correction. Newer meters with temperature measurement can automatically correct for temperature to 25 °C.
The specific conductance values measured in the laboratory by the KGS were made with the same conductivity probe and meter after the water sample temperature had adjusted to the laboratory room temperature. The KGS calibrated the meter and cell using a range of concentrations of two different types of inorganic salts for which specific conductance values are known. The range in the specific conductance values for ground waters from the upper Arkansas River corridor analyzed for this study is 295-5,670 µS/cm.
A plot of TDS concentration against specific conductance for ground water in the Arkansas River corridor in southwest Kansas can be used for estimating dissolved solids content given a specific conductance measurement. The accuracy of the estimation depends not only on the accuracy of the conductance measurement but also on the error in the dissolved solids determinations used to prepare the plot. Figure 2 is a TDS-conductance graph for analyses of ground waters from the river corridor (including a few samples from northern Grant and Haskell counties) made by the KGS during the initial investigations for the Upper Arkansas River Corridor Study during 1994 and for the study during 1995-2000. The ground-water data for Figure 2 and other figures in the sections on specific conductance relationships are based on the data in Appendix A.
Figure 2--Concentration of calculated total dissolved solids versus laboratory specific conductance for ground waters of the upper Arkansas River corridor based on Kansas Geological Survey analyses.
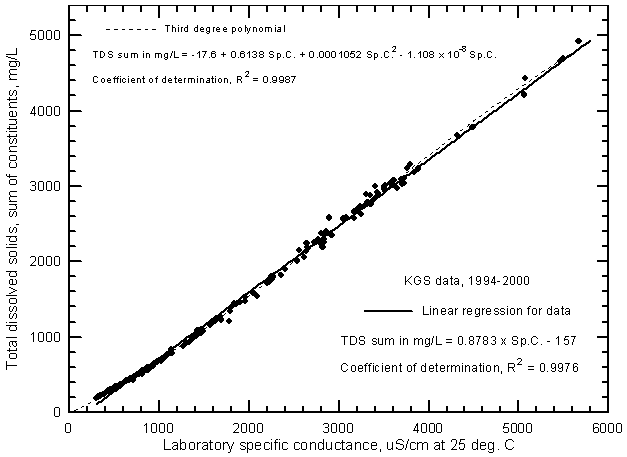
There is little scatter of the data about the linear regression or "best-fit line" in Figure 2, indicating that the specific conductance and TDS concentrations are highly correlated for ground waters in the river corridor. The line does not fit the data for ground waters with low TDS concentrations as well as the saline waters. For example, if the line were extrapolated to lower conductance and TDS values, it would not pass near the origin of the axes. The data show a curvilinear relationship for conductances below 1,200 µS/cm or TDS contents below 800 mg/L. However, a good estimate of the TDS concentration in mg/L can be estimated from the following equation for the linear regression (where specific conductance is in µS/cm or µmho/cm)
TDS = 0.8783 Sp.C. - 157
The main error expected for such an estimate is the accuracy in the measured conductance. If a conductance meter used in the laboratory is properly calibrated and the measurement properly corrected to 25 °C, the estimate can be relatively accurate. If the conductance is measured in the field, additional errors in the conductance measurement due to differences in the temperature of the conductance cell and the water, and error in the correction of the measurement to 25 °C, can lead to more uncertainty in the estimate. However, even with a field meter, the TDS estimate using the above equation should be accurate enough to clearly differentiate substantial differences in dissolved solids levels.
The curve and equation for the regression of the data with a third-degree polynomial is also in Figure 2. This equation provides a more accurate estimate for the entire range of the data and would be appropriate for estimating the TDS content of ground waters in the river corridor with conductance values less than 1,200 µS/cm. Alternatively, a separate linear regression could be determined using the set of data with conductances less than 1,200 µS/cm and applied to estimating the TDS for fresh ground waters. Figure 3 is a graph that displays the curve for the third-degree polynomial on a grid for easy estimation of the TDS concentration from a conductance value. A photocopy of this graph could be used in the field or laboratory for estimation of TDS concentration for ground waters based on a field conductance measurement.
Figure 3--Curve for estimating the concentration of total dissolved solids from specific conductance for the Arkansas River and ground waters in the river corridor in southwest Kansas.
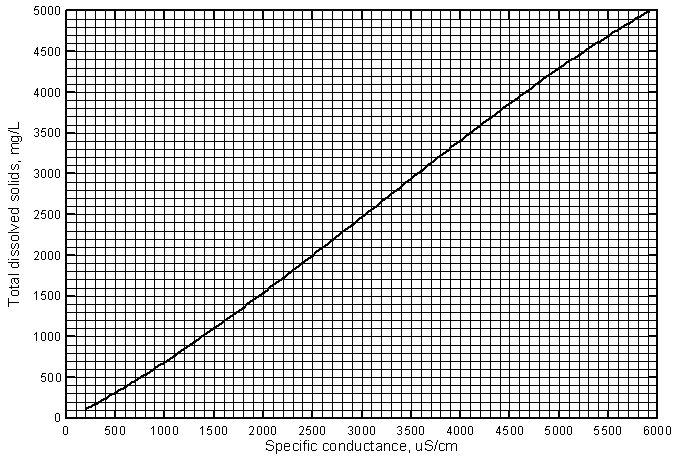
Figure 4 illustrates the similarity of the linear regressions for ground-waters and Arkansas River water in the river corridor in southwest Kansas. Only the regression lines are shown. The line for the ground-water data is for samples with conductances greater than 1,200 µS/cm. The equation for the line is
TDS = 0.9136 Sp.C. - 269
Figure 4--Concentration of total dissolved solids versus laboratory specific conductance for the Arkansas River and ground waters in the upper Arkansas River corridor based on Kansas Geological Survey analyses.
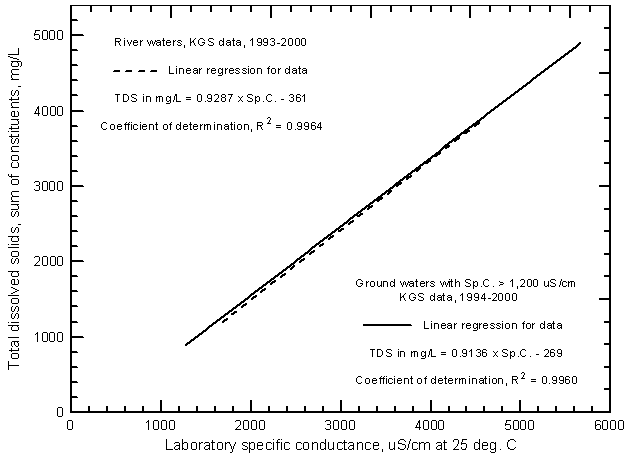
The line for the Arkansas River is for samples collected as part of the KGS study from near the Colorado-Kansas state line to Dodge City (see Figure 7 in Whittemore, 2000). Although the regression lines deviate slightly at lower water salinities, the difference is so small that it could potentially be due to analytical errors rather than indicating a significant difference in the relationship for lower TDS concentrations. The even closer similarity of the polynomial shown on Figure 2 and the second-degree polynomial for river water (Figure 8 in Whittemore, 2000) indicates that the third-degree polynomial used for Figure 3
TDS = -17.6 + 0.6138 Sp.C. + 0.0001052 (Sp.C.)2 - 1.108 x 10⁻⁸ (Sp.C.)3
is suitable for estimating TDS concentrations from conductance measurements for both ground waters and Arkansas River waters in the river corridor in southwest Kansas.
The correlations of specific conductance with dissolved concentrations of all but one of the major constituents are very high. Careful measurements of specific conductance in the field and laboratory can therefore be used to obtain good estimates of selected constituent contents. Figure 5 displays the relationships with sulfate concentration for the same ground waters in the study area for 1994-2000 as in Figure 2 plus additional analyses for which the KGS determined only conductance and sulfate, chloride, and in many cases, nitrate concentrations. The coefficient of determination (R2) for the sulfate correlations is greater than 0.99. There is a slight curvature in the distribution of both sulfate concentrations with conductance just as for the relationship of TDS and conductance. Just as for the relationship between conductance and TDS, a third-degree polynomial fits the entire set of data better than the linear regression. The linear regression and third-degree polynomial equations for the sulfate concentration versus conductance are
SO4 = 0.5589 Sp.C. - 244
SO4 = -132 + 0.3309 Sp.C. + 0.0001002 (Sp.C.)2 - 1.181 x 10⁻⁸ (Sp.C.)3
Figure 5--Sulfate concentration versus laboratory specific conductance for ground waters in the Arkansas River corridor in southwest Kansas based on Kansas Geological Survey data.
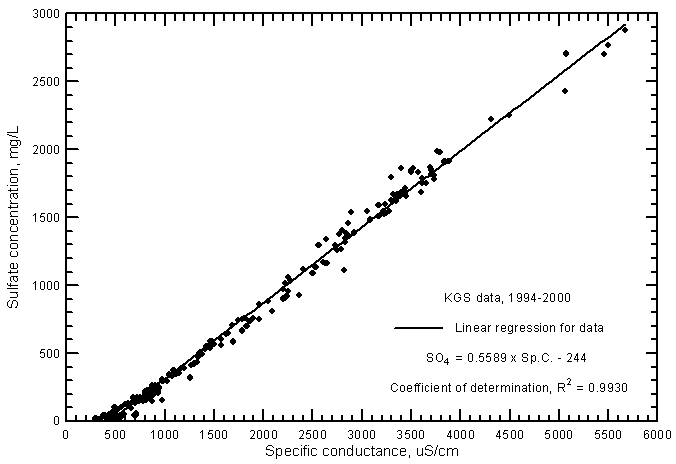
The linear regression for sulfate versus conductance for the ground waters (Figure 5) is very similar to that for Arkansas River waters (Figure 9 in Whittemore, 2000). However, there is a very slight shift of the linear regression to lower sulfate concentrations for a given conductance at high conductance values.
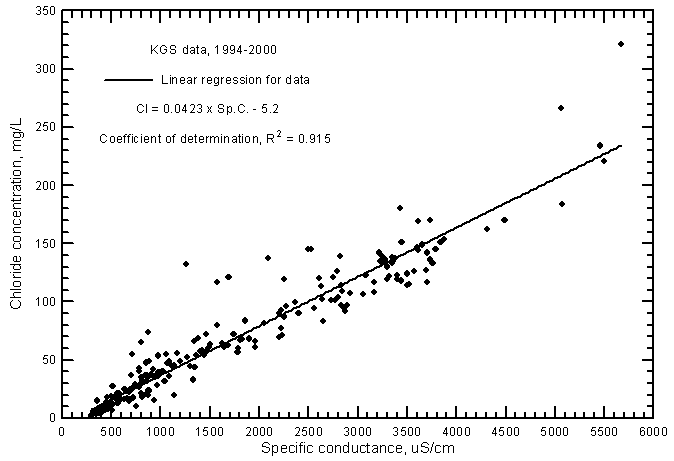
The correlation of chloride concentration with specific conductance (Figure 6) is also highly significant (greater than the 99% level) but the coefficient of determination (R2) is not nearly as great as for the sulfate-conductance relationship. Fitting a second-degree polynomial to the data produces essentially the same R2 as for the linear regression. Thus, the generation of a polynomial fit is not justified as it is for the sulfate-conductance relationship. The R2 (0.915) is not nearly as high for the ground waters as for Arkansas River waters (0.974) in southwest Kansas. In addition, the linear regression in Figure 6 for the ground waters is at higher chloride concentrations for given conductance values than for the line for Arkansas River waters (Figure 10 in Whittemore, 2000). The linear regression for ground waters is
Cl = 0.0423 Sp.C. - 5.2
Figure 6--Chloride concentration versus laboratory specific conductance for ground waters in the Arkansas River corridor in southwest Kansas based on Kansas Geological Survey data.
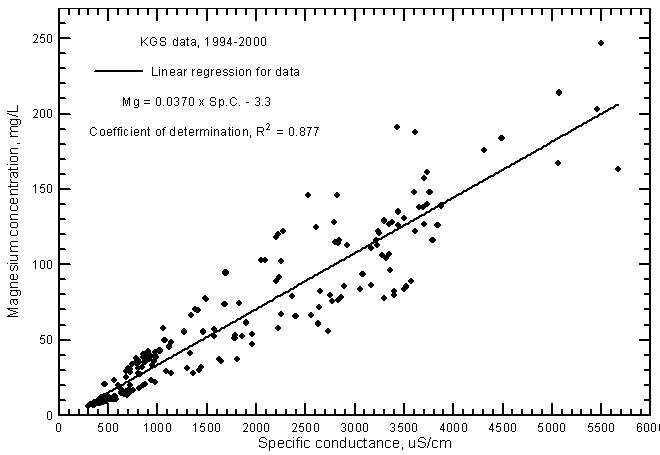
Highly significant correlations (greater than the 99% level) exist for calcium and magnesium concentrations with specific conductance as shown in Figures 7 and 8, respectively. The data set used for these graphs is the same as that for the TDS-conductance figure. The coefficients of determination (R2) are over 0.915 and 0.877 for the calcium and magnesium correlations, respectively. The linear regression equations for these relationships are
Ca = 0.0992 Sp.C. + 16.3
Mg = 0.0370 Sp.C. - 3.3
The R2 values are not as high for the ground waters as for Arkansas River waters in southwest Kansas. As for the chloride-conductance relationship, the regression line for calcium (Figure 7) is at greater calcium concentrations for given conductance values than for the line for Arkansas River waters (Figure 11 in Whittemore, 2000). The regression line for magnesium in ground waters (Figure 8) is close to that for Arkansas River waters (Figure 12 in Whittemore, 2000) at low concentrations and conductances but is higher than that for river waters at high values.
Figure 7--Calcium concentration versus laboratory specific conductance for ground waters in the Arkansas River corridor in southwest Kansas based on Kansas Geological Survey data.
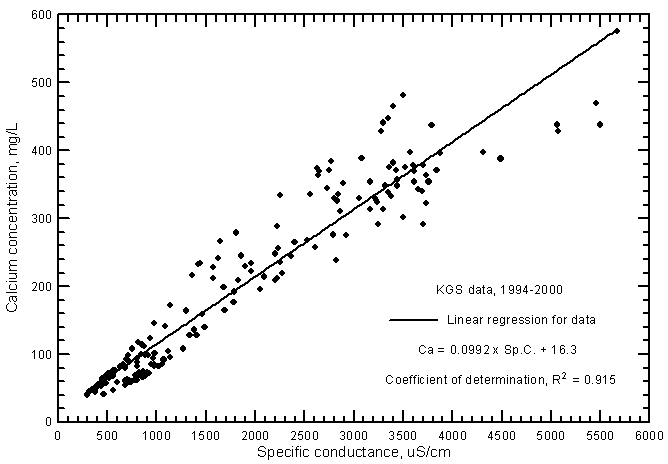
Figure 8--Magnesium concentration versus laboratory specific conductance for ground waters in the Arkansas River corridor in southwest Kansas based on Kansas Geological Survey data.
The distribution of data points on a sodium concentration versus specific conductance plot has a pronounced curve (Figure 9). An approximate estimate of sodium content can be calculated with the linear regression equation
Na = 0.1246 Sp.C. - 64
Figure 9--Sodium concentration versus laboratory specific conductance for ground waters in the Arkansas River corridor in southwest Kansas based on Kansas Geological Survey data.
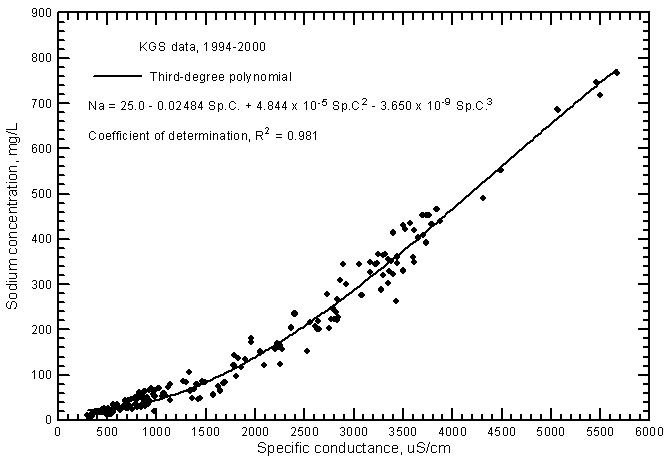
The R2 for the linear relationship is 0.942. However, estimates of sodium content are not very good at low conductance values (less than 800 µS/cm), intermediate conductances (between 1,200 and 2,600 µS/cm), and high conductances (greater than 4,500 µS/cm). A much better estimate can be determined from the third-degree polynomial shown in Figure 9
Na = 25.0 - 0.02484 Sp.C. + 4.844 x 10⁻⁵ (Sp.C.)2 - 3.650 x 10⁻⁹ (Sp.C.)3
The R2 for the polynomial fit is 0.981. Although a second-degree polynomial gives nearly the same R2 (0.978), estimates of sodium concentration at the highest conductance values would be greater than measured in comparison with use of the third-degree polynomial. The portion of the linear regression for sodium versus conductance for Arkansas River waters (Figure 13 in Whittemore, 2000) with the highest values is nearly the same as for corresponding values in Figure 9 for ground waters. However, the sodium concentrations at low conductance values for the ground waters are somewhat smaller than sodium contents at corresponding conductances for the river waters.
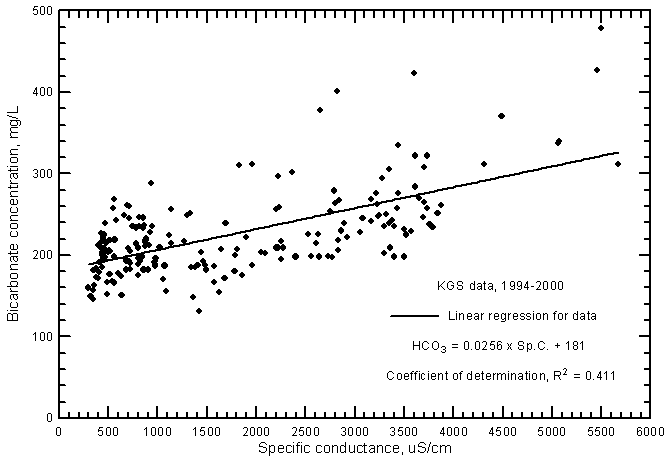
Although the significance of the correlation between bicarbonate concentration and specific conductance (Figure 10) is very high (greater than the 99% level), the coefficient of determination (R2) is less than 0.5. The total range (131-479 mg/L) in the bicarbonate content is a smaller percentage of the average concentration in comparison with the other major dissolved constituents. Bicarbonate content generally increases with increasing conductance of the ground waters. However, the error in a concentration estimated from a conductance value could be over 100 mg/L. The equation for the linear regression is
HCO3 = 0.0256 Sp.C. + 181
Figure 10--Bicarbonate concentration versus laboratory specific conductance for ground waters in the Arkansas River corridor in southwest Kansas based on Kansas Geological Survey data.
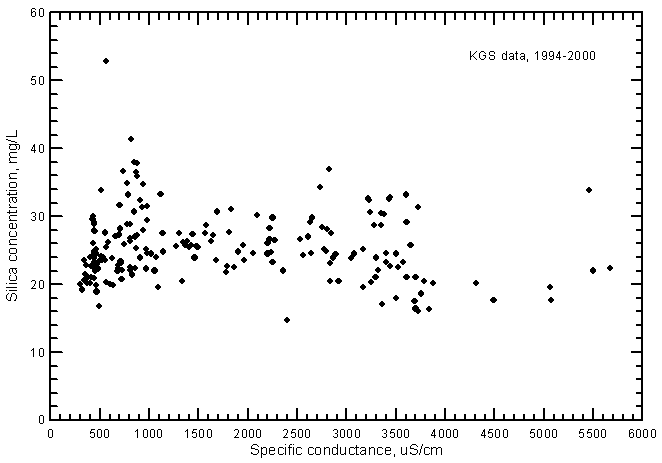
There is no significant correlation between specific conductance and silica concentration (Figure 11). This contrasts with the silica-conductance relationship for Arkansas River waters, which is directly proportional and significant at the 99% level. The silica content of the ground waters can be just as high in the freshwaters as in the saline waters. The silica content comprises as little as 1% of the TDS concentration for saline waters but contributes as much as 10% of the TDS for fresh ground waters.
Figure 11--Silica concentration versus laboratory specific conductance for ground waters in the Arkansas River corridor in southwest Kansas based on Kansas Geological Survey data.
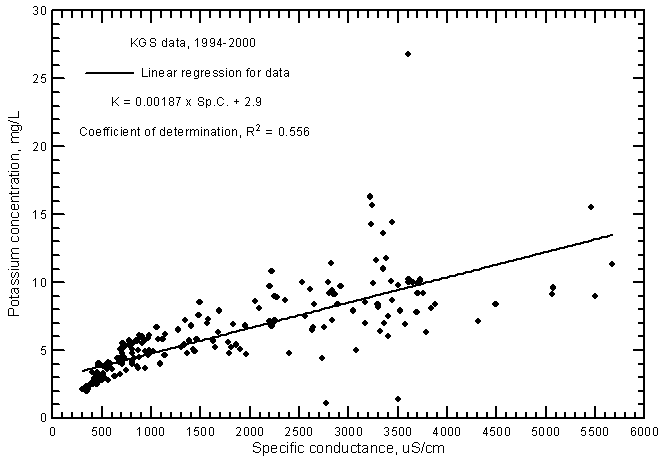
The potassium concentration of ground waters in the Arkansas River corridor is usually within the range 2-15 mg/L. The variation in potassium content increases substantially with increasing conductance. The linear regression of potassium and specific conductance (Figure 12) is highly significant (at the 99% level) and therefore indicates that there is a relationship of potassium content with salinity. However, the coefficient of determination (R2) is not as high as for the major cations, indicating that different factors such as adsorption in clays are an important control on the variation in potassium concentration as well as simple mixing of fresh ground waters with infiltrating river water. The R2 is appreciably greater for the ground water than for Arkansas River water because the fresh ground water has a low concentration and relatively low variation in potassium content, thereby providing a wider range of differing values from low to higher salinities for the regression. The potassium concentration in the ground water is in about the same range as for the Arkansas River during 1993-2000 if only those waters with the conductance range of the river waters are considered. The linear regression relationship between potassium and conductance for the ground waters is
K = 0.00187 Sp.C. + 2.9
Figure 12--Potassium concentration versus laboratory specific conductance for ground waters in the Arkansas River corridor in southwest Kansas based on Kansas Geological Survey data.
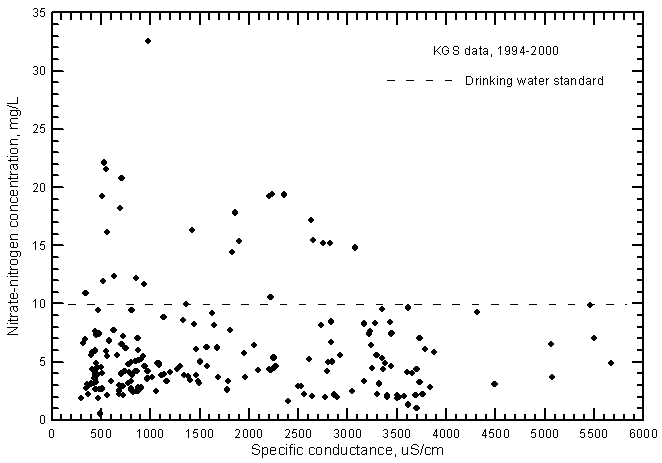
The nitrate-nitrogen concentrations in most of the ground water samples range from 2 to 10 mg/L as nitrate-nitrogen, although many values exceed the drinking-water standard (maximum contaminant level) of 10 mg/L (Figure 13). A linear-regression for the nitrate-conductance plot is not statistically significant and therefore is not drawn. In general, the lower the salinity of the ground water, the greater the range in nitrate concentration. The nitrate concentrations are greater in most ground waters than in the Arkansas River waters, which nearly always contained a range of 0.2-3 mg/L during 1993-2000. Even though the range in nitrate was much smaller for the river waters, the nitrate-conductance correlation was positive and highly significant (Figure 17 in Whittemore, 2000).
Figure 13--Nitrate-nitrogen concentration versus laboratory specific conductance for ground waters in the Arkansas River corridor in southwest Kansas based on Kansas Geological Survey data.
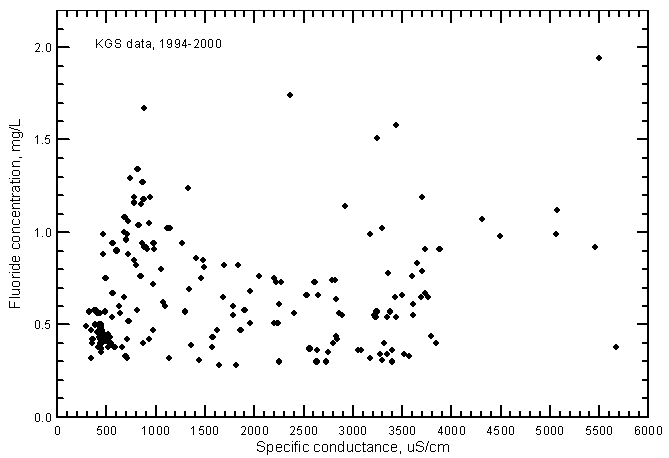
Fluoride concentrations in most of the ground water samples range from 0.3 to 1.2 mg/L; the total range is 0.28-1.95 mg/L (Figure 14). A linear-regression for the fluoride-conductance plot is not statistically significant and therefore is not drawn. Although the range in fluoride content was greater in the ground water than in Arkansas River water during 1993-2000, the average fluoride concentration in the ground waters is less than that for the river waters. Just as for the case of nitrate versus conductance, the fluoride-conductance correlation was positive and highly significant for the river waters (Figure 18 in Whittemore, 2000) but not the ground waters.
Figure 14--Fluoride concentration versus laboratory specific conductance for ground waters in the Arkansas River corridor in southwest Kansas based on Kansas Geological Survey data.
Boron concentrations are directly correlated with specific conductance in ground waters in the river corridor (Figure 15). The relationship is highly significant with an R2 of 0.790. The boron concentrations range from 0.014 to nearly 1 mg/L in the ground waters.
Figure 15--Boron concentration versus laboratory specific conductance for ground waters in the Arkansas River corridor in southwest Kansas based on Kansas Geological Survey data.
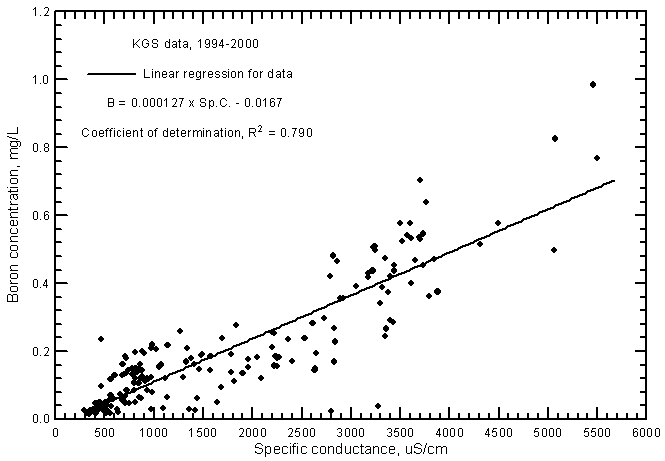
The R2 of the linear regression for Arkansas River waters (0.835) is greater than for the ground waters even though the range for the river waters (0.22-0.97 mg/L during 1993-2000) was somewhat less than for the ground waters (see Figure 19 in Whittemore, 2000). The boron concentrations tend to be slightly less in the ground waters at given conductance values than for the river waters. Boron can be estimated in the ground waters using the linear regression equation
B = 0.000127 Sp.C. - 0.0.167
The hardness of a water represents the amount of dissolved calcium and magnesium and has been used as a measure of the ability of a water to combine with soap and create carbonate scale deposits. The total hardness is usually expressed in mg/L (or ppm) as CaCO3 and is calculated using calcium and magnesium concentrations in mg/L (or ppm) from the following relationship
Total hardness as CaCO3 = 2.497 Ca + 4.116 Mg
The range in the total hardness of the ground waters in the river corridor is 125-2,110 mg/L (Figure 16). Even the freshest ground waters are hard (120-180 mg/L of total hardness as CaCO3) because the waters are calcium-bicarbonate in chemical type. The saline ground waters are extremely hard (very hard is greater than 180 mg/L). The hardness is highly correlated to the salinity as represented by specific conductance. An excellent estimate of the total hardness can be calculated from the second-degree polynomial
Total hardness as CaCO3 = -50.7 + 0.5124 Sp.C. - 2.492 x 10⁻⁵ (Sp.C.)2
Figure 16--Total hardness versus laboratory specific conductance for ground waters in the Arkansas River corridor in southwest Kansas based on Kansas Geological Survey data.
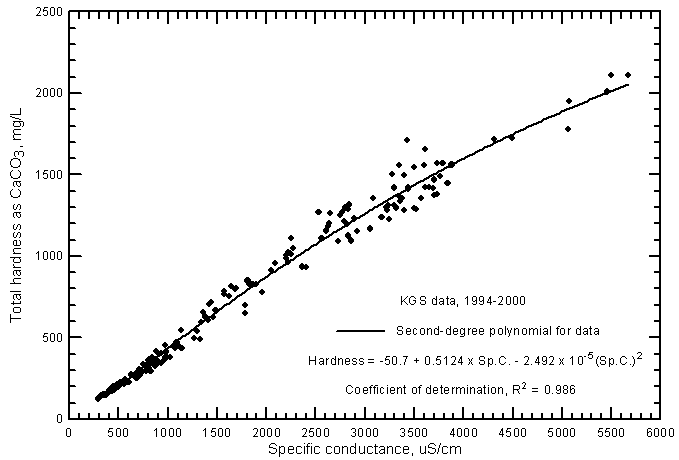
The R2 for the polynomial fit to the data is 0.986. Although the R2 of the linear regression for the data is nearly as great (0.979), the polynomial equation gives a substantially better estimate of the hardness at high conductances. The linear regression equation is
Total hardness as CaCO3 = 0.3999 Sp.C. + 27.2
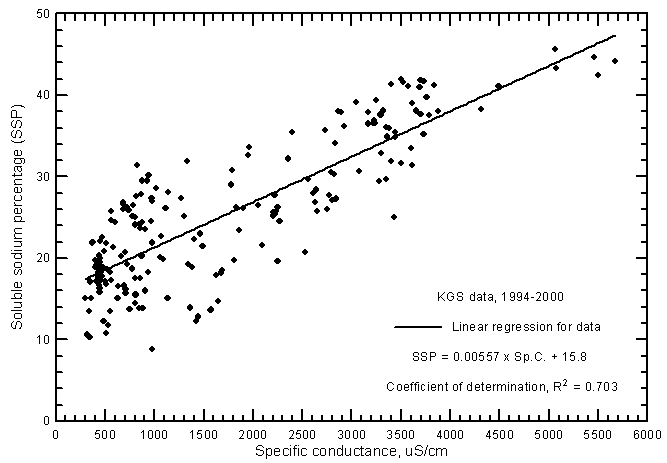
Two properties that calculated as a measure of the sodium (alkali) hazard of an irrigation water to a soil are the sodium-adsorption ratio (SAR) and soluble sodium percentage (SSP). The SAR of a water was defined by the U.S. Salinity Laboratory (1954) as
******************************SAR = Na/Ö [0.5(Ca + Mg)]
where the sodium, calcium, and magnesium are dissolved concentrations in milliequivalents per liter (meq/L). Although the SAR has been in wide use nationally, the SSP has also been applied by Kansas State University to representing sodium hazard. The equation for computing SSP is
SSP = Na/(Total cation content) x 100
where the cation concentrations are also in meq/L and the total cation content is usually the sum of the dissolved sodium, calcium, and magnesium. SAR values ranged from 0.28 to 7.27 and SSP from 8.8% to 45.6% for the ground waters from the river analyzed by the KGS during 1994-2000. The correlation between SAR and specific conductance (Figure 17) is greater than for SSP and conductance (Figure 18) as represented by the R2 values of 0.929 and 0.703, respectively, for the linear regressions. This is illustrated by the smaller scatter in the data points on the SAR-conductance plot than for the SSP-conductance graph. The scatter in the SAR and SSP values is about the same for the most saline waters but the scatter of SSP data is much greater for fresh and slightly saline waters than for SAR data. The linear regression equations for estimating SAR and SSP values for ground waters are
SAR = 0.001238 Sp.C. - 0.087
SSP = 0.00557 Sp.C. + 15.8
Figure 17--Sodium-adsorption ratio versus laboratory specific conductance for ground waters in the Arkansas River corridor in southwest Kansas based on Kansas Geological Survey data.
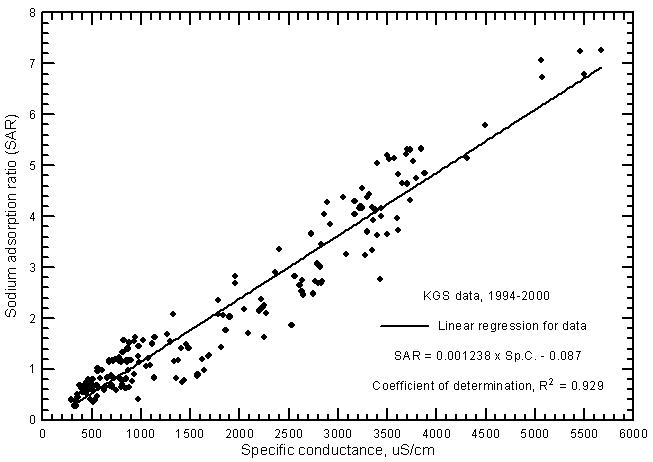
Figure 18--Soluble sodium percentage versus laboratory specific conductance for ground waters in the Arkansas River corridor in southwest Kansas based on Kansas Geological Survey data.
Ground water in the upper Dakota aquifer underlying the Arkansas River corridor in southwest Kansas is fresh as indicated by a map of TDS concentration in Macfarlane et al. (1998). Water quality data for the Dakota aquifer can be obtained from the following page of the KGS Internet site for the Dakota aquifer: http://www.kgs.ku.edu/Dakota/vol2/qualDB/quality.htm.
The chemical water type in the upper Dakota aquifer in the corridor region ranges widely from calcium, magnesium-bicarbonate to sodium-bicarbonate to calcium-sulfate. Softening of the ground water occurs in portions of the aquifer and produces waters with relatively low calcium and magnesium but elevated sodium concentrations in comparison with unsoftened waters. The softening results from exchange of calcium and magnesium for sodium on clays in the aquifer sediments during ground-water flow.
Water in the Dakota aquifer is used for irrigation, stock, municipal, and industrial supplies in the river corridor. Some wells are screened within both the High Plains and Dakota aquifers. Others are screened only in the Dakota aquifer. The freshwater in the Dakota aquifer is especially valuable for supplies needing good quality water for drinking, stock, and selected industrial uses. For example, Garden City has two municipal wells screened in the Dakota aquifer north of the Arkansas River and the Sunflower electric power plant has Dakota wells along with High Plains aquifer wells for water supply south of the river (near Holcomb). The TDS concentrations of Garden City well 26 and a Dakota well of the power plant were 267 and 279 mg/L in 2000 and 1991, respectively, based on KDHE (Garden City well) and KGS (power plant well) analyses. The TDS of the other Dakota well (No. 27) of Garden City contained a TDS of 435 mg/L in 2000.
The quality of water in the Dakota aquifer contrasts substantially with the saline water in the overlying alluvial and High Plains aquifers. For example, a water sample collected on 11/29/99 and analyzed as a part of this study from a stock well in the Arkansas River valley in western Kearny County was very fresh. The specific conductance was 433 µS/cm, the TDS content was 263 mg/L, and the laboratory pH was 7.2 units. The concentrations of the cations calcium, magnesium, and sodium were 53.0, 13.9, and 19.1 mg/L, respectively, and of the anions bicarbonate, sulfate, chloride, fluoride, and nitrate (as nitrate-nitrogen) were 203, 56.7, 5.4, 0.64, and <0.1 mg/L, respectively. The silica and boron contents in the sample were 10.9 and 0.058 mg/L, respectively. The well is located at the southern edge of the Quaternary alluvial valley of the Arkansas River in Sec. 11, T. 25 S., R. 38 W. The well is 200 ft deep and has a casing of 120 ft meaning that water is derived from the Dakota aquifer at a depth interval of 120-200 ft. Two observation wells installed by the KGS in the Quaternary alluvium to the east and east-northeast in the same section as the stock well yielded saline waters with TDS contents of 3,010-3,030 mg/L and sulfate concentrations of 1,750-1,820 mg/L (Appendix A). Thus, there is a substantial salinity gradient across the shale in the Dakota strata between the alluvium and the Dakota sandstone units.
The chloride concentration of ground waters in the upper Dakota aquifer underlying the Arkansas River corridor in southwest Kansas are usually less than 50 mg/L. The sulfate concentration in the upper Dakota aquifer is variable but is generally less than 250 mg/L in the river corridor in Hamilton and Kearny counties and less than 100 mg/L in most of the parts of Finney, Gray, and Ford counties that underlie the corridor. For example, the 2000 samples (analyzed by KDHE) of water from the Dakota wells of Garden City yielded water with chloride and sulfate concentrations of 6.4 and 67 mg/L, respectively, for well 26, and 17.8 and 166 mg/L, respectively, for well 27. A Dakota well of the Sunflower power plant pumped water with sulfate and chloride contents of 5.6 and 74 mg/L, respectively, when sampled and analyzed by the KGS in 1991. Some local areas of the Dakota aquifer may contain ground waters with between 250 and 500 mg/L sulfate. Most of the sulfate in the Dakota aquifer is probably generated by oxidation of pyrite in some of the shales and fine-grained sandstone layers. The presence of greater amounts of pyrite undergoing weathering in zones screened by wells can result in production of higher sulfate contents than usual. However, the amount of water yielded from these wells would be expected to be smaller than from more permeable portions of the aquifer with better water quality.
Where the confining units (shales and limestones) of upper Cretaceous strata overlie the Dakota aquifer, some secondary gypsum may be present that was generated through oxidation of pyrite followed by precipitation in the presence of calcium dissolved from carbonate minerals in the rocks. There are some domestic and stock wells in this confining strata north of the Arkansas River in areas where the High Plains aquifer is not present or has too thin a saturated thickness to be a water supply. Some of these wells can have elevated TDS and sulfate concentrations.
Nitrate contents of ground waters in the Dakota aquifer in the river corridor are typically very low (usually less than 2 mg/L and typically less than 1 mg/L as nitrate-nitrogen). For example, both the municipal wells of Garden City in the Dakota aquifer and a Dakota well of the Sunflower power plant yielded waters with a nitrate-nitrogen concentration appreciably less than 1 mg/L. Fluoride concentrations are about 1 mg/L or greater in ground water of the upper Dakota strata. The higher concentrations are in the aquifer where it is confined north of the Arkansas River. The elevated fluoride is generated by dissolution of minerals containing both calcium and fluoride because natural softening of the water during ground-water flow decreases the dissolved calcium concentration. In general, the farther to the north of the boundary of the confined Dakota strata, the greater the fluoride content in the region of the Arkansas River corridor in southwest Kansas. The fluoride concentrations of the ground waters from Garden City well 26 and 27 were 1.0 and 1.4, respectively, in 2000. The fluoride content for water from a Dakota well of the Sunflower power plant was 1.1 mg/L in 1991.
Some wells located in the Arkansas River corridor that obtain water from the Dakota aquifer have been constructed with screened intervals in both the Dakota strata and portions of the High Plains and/or alluvial aquifers with saline water. Thus, saline water from the unconsolidated aquifer(s) can mix with the fresh Dakota water during pumping of the wells. Other wells constructed to be open only to the Dakota in areas with overlying saline water do not have a good seal in the annular space (between the borehole wall and the well casing) across the High Plains or alluvial aquifers. These wells can allow some downward seepage of saline water within the annulus and increase the dissolved solids concentrations of what would otherwise be expected to be freshwater drawn from the well. An observation that often is an indicator of the seepage from the High Plains or alluvial aquifers being mixed with the Dakota ground water is an elevated nitrate content (greater than 2 mg/L nitrate-nitrogen).
The following section focuses on the distribution of salinity and nitrate concentrations in the alluvial and High Plains aquifers in the Arkansas River corridor. Four map plates (Whittemore and Schloss, 2000) were generated illustrating the sulfate distribution, one for the Quaternary alluvial aquifer and one for the High Plains aquifer and the older alluvium underlying the sand dunes along the southern part of the bedrock trough in Hamilton and western Kearny counties.
Data of the KGS, GMD3, KDHE, SWKSLEPG, and USGS were examined to prepare files containing sulfate and chloride data for the Quaternary alluvial and High Plains aquifers in the upper Arkansas River corridor. The files examined included several thousand records of ground-water analyses for the corridor area. An intermediate file of about 1,900 records for the period of 1975 to the present was created that included sulfate and chloride concentrations. Many of the records did not contain an indication of the aquifer from which the water was extracted. Therefore, maps and databases (such as for water well logs available on the KGS Internet site) containing information on geology and well construction were examined for characteristics that would allow assignment of most probable aquifer to these records. After this assignment, wells that included Cretaceous bedrock units were eliminated from the file.
Many of the well locations included more than one sample. The data file was therefore examined to determine the most representative sulfate and chloride concentrations for each unique well location. If there were two samples for a unique well location, the latest analysis was selected. If there were more than two analyses for a unique well location and there was little change or a consistent trend with time to the sulfate concentration, the latest analysis was used. If there were more than two analyses for a unique well location and the sulfate concentration fluctuated, the last two or three years of analytical values were averaged to give the best representation. An exception to this last step was made in cases where there was a large time gap between the last analysis and the prior analyses; in this case, the last year was used. In a few cases, there were samples for different wells with the same legal location; an average of the analyses was then computed.
Two separate files were then created, one for wells producing from the Quaternary alluvial aquifer and one for wells pumping water from the High Plains aquifer and older alluvium underlying the sand hills in the southern part of the alluvial trough in Hamilton and western Kearny counties. These files match the two different layers selected for numerical simulation of ground-water flow and sulfate movement in the upper Arkansas River corridor. Some analyses are for wells that probably pump from both the alluvial and High Plains aquifers or that pump primarily from the High Plains aquifer and include water that has traveled down the gravel pack from the alluvial aquifer into the High Plains sediments. These analyses were included in both files to increase the coverage of sulfate data for both aquifer maps.
Data from 1975 to the present were included in the file for the Quaternary alluvial aquifer rather than only later values due to the limited number of analyses available for the study area. An observation made during the inspection of well logs for aquifer assignments was the much larger number of wells that have been plugged that produced from the alluvial aquifer in comparison to those that were completed in the High Plains aquifer. The logic used was that, if an older analysis indicates a high sulfate value, the present sulfate concentration in the aquifer is most likely about the same or greater than the early value. If the concentration for an older analysis is lower than for nearby data points, the more recent data can be used during generation of contours for the sulfate map. Only data from the last 14 years (1987-2000) were retained for the file for the High Plains aquifer because the ground water has been changing in quality recently in many areas. The window of 14 years was selected rather than the last decade to increase the coverage of points for the map.
There are 93 records in the water-analysis file for the Quaternary alluvial aquifer. The analyses and information on the wells and samples are in Appendix B. There are 743 records in the water-analysis file for the High Plains aquifer and older alluvial aquifer underlying the sand dunes in the river valley in Hamilton and western Kearny counties (Appendix C).
The two data files were used to generate point maps of sulfate concentration. Contours for the point maps were drawn by hand directly in ArcView. These maps are better than computer generated maps because a knowledge of the water quality, geology, hydrology, well construction, and other factors was used to determine the location and shape of the contours. The contours were overlain on coverages of cultural, geologic, and hydrologic features in ArcView to produce the final maps.
The contoured areas in the sulfate concentration map for the Quaternary alluvial aquifer (Plate A and Plate C, Whittemore and Schloss, 2000; click here for a larger version of Plate C, which shows more detail) extend within the boundaries of the coverage for the Quaternary alluvium. The sulfate concentrations in ground waters in the Quaternary alluvium range up to 3,090 mg/L in Hamilton County based on the available data. In general, sulfate contents of the alluvial aquifer decrease eastward from Hamilton County to Ford County. The sulfate values typically exceed 2,000 mg/L in the ground water in Hamilton County. Sulfate concentrations in most of the alluvial aquifer from Kearny County through Finney County range between 1,500 and 2,000 mg/L. In Gray County, the area with 1,500-2,000 mg/L sulfate content narrows within the alluvial valley to be mainly near the Arkansas River. The sulfate values in the ground water near the boundaries of the alluvium are generally between 500 and 1,000 mg/L. The band of 1,500-2,000 mg/L sulfate concentration in the alluvium along the river extends to near Dodge City. A zone of ground water with 1,000 to 1,500 mg/L sulfate concentration follows the alluvium near the river past Dodge City. Ground water in the alluvial aquifer near the edges of the alluvium in the Dodge City area contains less than 1,000 mg/L sulfate.
There is very little data past Fort Dodge for ground waters in the Quaternary alluvium. However, based on the data and the quality of higher flows of the Arkansas River, sulfate contours where estimated for the stretch of the valley east of Fort Dodge to the eastern boundary of Ford County. The sulfate content of the river water when it flowed through Ford County during 1996 to the first half of 2000 was usually greater than 1,000 mg/L. The great loss of river water to the aquifer meant that the alluvium received saline water. The sulfate concentration of the infiltrating water was probably diluted somewhat by ground water in the alluvium with somewhat lower salinity and areal recharge from precipitation. In the past, discharge of fresh ground water from the High Plains aquifer to the river valley in Ford County kept the water in most of the alluvial aquifer fresh. Currently, the only location where freshwater is expected to discharge to the alluvium in Ford County is in the eastern part of the county. The sulfate concentration probably drops to less than 1,000 mg/L near the river in eastern Ford County.
The chloride concentration for the water with the highest sulfate content located in Hamilton County is 331 mg/L. The highest chloride content in the alluvial aquifer of the 5-county study area is 750 mg/L; the sulfate concentration for this water is only 366 mg/L. As indicated in a previous section, the sulfate content of alluvial ground waters usually comprises 55-60% of the TDS concentration. The ground water with the chloride greater than the sulfate content is located near an industrial facility east of Dodge City and must have been affected by waste sources to give such a low sulfate/chloride ratio.
Areal Distribution
The contoured areas in the sulfate distribution map for the High Plains aquifer in the study area includes the older alluvial aquifer south of the Quaternary alluvium in Hamilton and western Kearny counties (Plate B and Plate D, Whittemore and Schloss, 2000; click here for a larger version of Plate D, which shows more detail). The older alluvium under the sand dune area has much fresher waters than in the Quaternary alluvial aquifer. The ground water at the eastern end of this older alluvium flows directly into the High Plains aquifer as the aquifer deepens across the Bear Creek fault zone. If the older alluvium had been included in the sulfate distribution map for the Quaternary alluvial aquifer, an artificial boundary would have been needed to separate the older alluvium from the High Plains aquifer. Inclusion with the High Plains aquifer fits better the hydrogeologic framework of the system, and also fits this same selection for model layers in the numerical simulation of ground-water flow for the river corridor study.
There are few data for the area of the older alluvial aquifer in Hamilton and western Kearny counties. Based on the existing data, the aquifer in most of the area contains freshwater with sulfate concentrations less than 200 mg/L. One well water contains a sulfate content of about 1,500 mg/L and is located near the Colorado-Kansas line about one mile south of the Quaternary alluvial aquifer. The saline water observed at this well indicates that saline ground water has migrated either from the Quaternary alluvium to the north or across the state line from Colorado. The ground water in the alluvial trough becomes fresher south of the location with saline water.
The contour lines for the High Plains aquifer in Plate B and Plate D (Whittemore and Schloss, 2000) extend to the edge of the aquifer extent or to the boundary of the unsaturated or thinly saturated portion of the aquifer. The data for the High Plains aquifer in Kearny County indicate that the sulfate concentration is greater than 1,000 mg/L in the ground water underlying most of the Quaternary alluvium. The area with ground waters containing over 1,000 mg/L sulfate extends into part of the ditch irrigation service area to the north of the alluvial valley and east of the Amazon canal. Most of the rest of the area in Kearny County east of the Amazon canal and north of the Quaternary alluvium has ground water with sulfate levels greater than 500 mg/L. In the vicinity of Deerfield, there is water in the High Plains aquifer that contains between 250 and 500 mg/L dissolved sulfate. To the west of the Amazon canal, most of the ground water generally has sulfate levels of less than 200 mg/L, although waters with less than 50 mg/L are present in some locations, including northwest of Lakin.
South of the Arkansas River in south-central to east-central Kearny County, the 500 mg/L contour line for sulfate concentration in the High Plains aquifer is approximately coincident with the southern boundary of the Quaternary alluvium. The 250, 100, and 50 mg/L contour lines extend into the region south of the alluvial aquifer boundary. In south-central and southeastern Kearny County, the ground waters in the High Plains aquifer are very fresh, with sulfate levels less than 50 mg/L, including the area of the Bear Creek Fault zone.
Parts of the High Plains aquifer underlying the alluvial aquifer in Finney County contain over 1,000 mg/L sulfate. These areas of saline water extend from the Kearny County line to several miles southeast of Garden City. The rest of the area underlying the alluvium ranges widely in salinity, with sulfate concentrations as low as less than 100 mg/L. In general, the farther to the east, the smaller the percentage of the High Plains aquifer with saline waters underlying the alluvium. The region with sulfate contents exceeding 1,000 mg/L extends to the north of the alluvial aquifer in the area formerly or presently irrigated with Arkansas River waters. The 500 mg/L contour reaches into some areas north of the present boundaries of ditch irrigation but within locations of past ditch irrigation.
The most northerly band of water with greater than 250 mg/L sulfate is within the Scott-Finney depression or basin. Natural TDS concentrations are elevated in the ground water in the depression as a result of surface water draining into the poorly-drained basin where evapotranspiration has concentrated dissolved salts over thousands of years. The ground water can slowly flow out of the basin, but the flow is not fast enough to dilute and remove the saline water infiltrating from the surface. Therefore, the conditions allow accumulation of ground water with higher TDS levels than at the sides. The band with sulfate contents exceeding 250 mg/L that extends from the Scott County line probably was present before ditch irrigation in the late 1800's to as far south as the north part of T. 23 S., R. 33 W. Thus, a significant amount of the dissolved solids in the ground waters within the peninsular-shaped area with sulfate levels greater than 500 mg/L in T. 22 S., R. 33 W. (Plate B and Plate D, Whittemore and Schloss, 2000) is expected to be natural.
Starting several miles north and east of Garden City, waters in the High Plains aquifer are fresh. Sulfate concentrations range between 50 and 300 mg/L in most of the aquifer in north-central Finney County and the strip of the aquifer just to the north of the Gray County line. The freshwaters in the High Plains aquifer extend to and below part of the northern area of the Quaternary alluvium in R. 31 W.
Ground waters in the High Plains aquifer with more than 100 mg/L dissolved sulfate reach up to 2 miles south of the Quaternary alluvium in the region from the Kearny County line to Garden City in Finney County. South of the Garden City area, pumping by wells has pulled saline water underlying the alluvium into locations where the water was formerly fresh. The lower hydraulic head created by pumping in the region has allowed saline water from the alluvial aquifer to seep into the underlying High Plains aquifer and move to the south. Local pumping has increased the migration within selected parts of the High Plains aquifer. This has produced irregular contour lines for sulfate concentration. The ground waters in southern Finney County have less than 50 mg/L sulfate content. The area of very fresh ground water is close to the southern boundary of the alluvial aquifer in R. 31 W.
Essentially all the saline water in the High Plains aquifer in the Arkansas River corridor in Gray and Ford counties underlies the Quaternary alluvium. A band of ground water with greater than 500 mg/L sulfate content extends from southeast of Garden City through most of Gray County. Only isolated areas of the High Plains aquifer (primarily in the Dodge City area) contain greater than 500 mg/L sulfate concentration. However, there are a few locations in Gray County where some ground water with elevated sulfate content has reached beyond the alluvial boundaries a short distance to the north and south. To the north of the Arkansas River valley, the sulfate concentration of water in the High Plains aquifer generally decreases across northern Gray County into northern Ford County. Ground water in northwestern Gray County usually has between 100 and 300 mg/L sulfate and ground water in northeastern Gray County has less than 100 mg/L sulfate content. From northeasternmost Gray County through northern Ford County, much of the High Plains aquifer contains water with less than 50 mg/L sulfate. The ground water in the High Plains aquifer south of the Arkansas River alluvium in Gray and Ford counties nearly always has sulfate concentrations less than 50 mg/L.
Vertical Distribution
The only locations where definitive data exist for the current vertical distribution of salinity in the High Plains aquifer in the river corridor are the sites with multi-level wells installed as part of the Upper Arkansas River Corridor Study. The results for these sites are described in Whittemore et al. (2000). Figure 19 summarizes the sulfate distribution with depth at all three of the multi-level well sites. The salinity in the High Plains aquifer at the Deerfield site, located within the city limits, continually decreases with depth. Substantial thicknesses of clay layers in the subsurface retard the downward movement of saline water at the location. The High Plains aquifer at the Garden City site contains sediments that are generally more permeable than those at the Deerfield location. Saline water from the overlying alluvial aquifer has been able to penetrate to the bottom of the High Plains aquifer at the site. Although the location of the Dodge City site relative to the Arkansas River is similar to that of the Garden City site, there is a sharp gradient from saline water in the alluvium to freshwater throughout the underlying main portion of the High Plains aquifer. The coarse nature of the alluvium, the abundance of low permeability sediments underlying the alluvium, the small downward head gradient in the underlying aquifer, and the discontinuous presence of water in the river channel are major factors explaining why the saline water has not appreciably penetrated below the alluvial aquifer. Substantial declines in the water levels in the High Plains aquifer along with a supply of saline Arkansas River water to the alluvial aquifer could lead to migration of salinity below the alluvial aquifer.
Figure 19--Sulfate concentration in waters pumped from all of the multi-level wells at the Deerfield, Garden City, and Dodge City sites in 1999. The bottom of the graph represents the depth to bedrock at the Deerfield site. The shallowest wells at Deerfield and Dodge City are in the alluvial aquifer and the shallowest well at Garden City is in the transition zone from the alluvial to the High Plains aquifer.
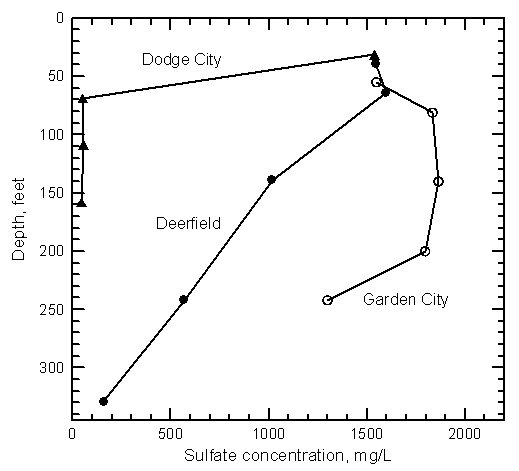
The three multi-level well sites are examples of three different types of vertical salinity distributions that are present in the High Plains aquifer. Another possible distribution that could be present is related to flow of shallow saline water down the gravel packs of large capacity wells without grout seals or in which the grout seals do not seal off shallow saline water. Most of the wells of this type are irrigation wells. The gravel-pack flow was described earlier as a part of the corridor study in Whittemore and Butler (1997a). After a well is drilled,gravel packs are placed in the annular space between the well screen and the outer borehole wall. The gravel pack extends above the screened interval and usually upwards through most of the aquifer in irrigation wells. More recent public supply and domestic wells have grout seals in the well annulus that extend to substantial depths and seal off the shallower parts of the aquifer. Many older irrigation wells may not have had much of the annular space sealed at the surface. Newer irrigation wells generally have a grout seal that extends only 10 or 20 feet below the land surface based on well logs (WWC-5 records). Thus, shallow ground water with high sulfate concentrations can enter a gravel pack and flow down across clay layers directly into the High Plains aquifer, thereby circumventing low-permeability zones. The borehole conditions that allow the movement of water flowing down the gravel pack to enter the aquifer at the screened interval as well as at shallower depths below the water table are explained further in Whittemore and Butler (1997b).
The wells allowing gravel-pack flow include both actively used and abandoned wells. The usual method of plugging an abandoned well involves sealing the inside of the casing. However, this does not seal the gravel pack in the annular space outside the casing. Abandoned, unplugged wells with corroded casing could allow direct flow down the casing opening to the water table.
A significant difference in the hydraulic head of the shallow and deep aquifers is needed for the gravel-pack flow in the saturated zone. The result of the flow in the gravel pack can be the movement of shallow ground water to the screened interval of the well. This can occur because fine-grained sediment circulated during the drilling of the borehole partially plugs coarser sediment along the borehole wall. When the well is developed, the fine-grained sediment is removed from the screened interval but much of the fines may remain in the borehole wall above the screen. (Whittemore and Butler, 1997b). If saline water flowing down the gravel pack enters the High Plains aquifer at the screened interval when a well is not being pumped, the saline water would move in the direction of ground-water flow at the location. Although much of the water would be removed from the deep aquifer when the well is pumped, the length of time during which irrigation wells are inactive during each year can allow saline water to move beyond the radius of pumping capture. The result could be a salinity distribution in which, starting at the water table, the salinity decreases with depth to above the screened interval, increases within the upper depths of the top screened interval, and then decreases with depth.
Nitrate concentration ranges from less than two mg/L to over 20 mg/L as nitrate-nitrogen in the alluvial and High Plains aquifers in the upper Arkansas River corridor. Nitrate-nitrogen concentration in Kansas ground water that has not been affected by anthropogenic sources are nearly always less than 3 mg/L. Concentrations above 3 mg/L indicate that nitrate from non-natural sources such as human or animal waste or fertilizers has entered the ground water (Townsend and Young, 1999). Ground water in the alluvial aquifer tends to have higher nitrate concentration than in the High Plains aquifer because the water is shallower and more susceptible to surface sources of nitrate. There is no clear areal pattern in the nitrate content of the ground water in the High Plains aquifer. Elevated concentrations occur both within and outside the area of the High Plains aquifer underlying the alluvial aquifer. There is also no statistically significant association of nitrate content with the salinity of the ground waters in the corridor as indicated in Figure 20. If the linear regression line were shown in Figure 20, it would be nearly horizontal at about 6 mg/L nitrate-nitrogen. Nitrate-nitrogen concentrations exceeding the drinking-water standard occur in both saline ground water that occurs within the river valley and ditch irrigation area and in the freshest water in the High Plains aquifer outside these areas.
Figure 20--Nitrate-nitrogen versus sulfate concentration for ground waters in the Arkansas River corridor in southwest Kansas based on Kansas Geological Survey data.
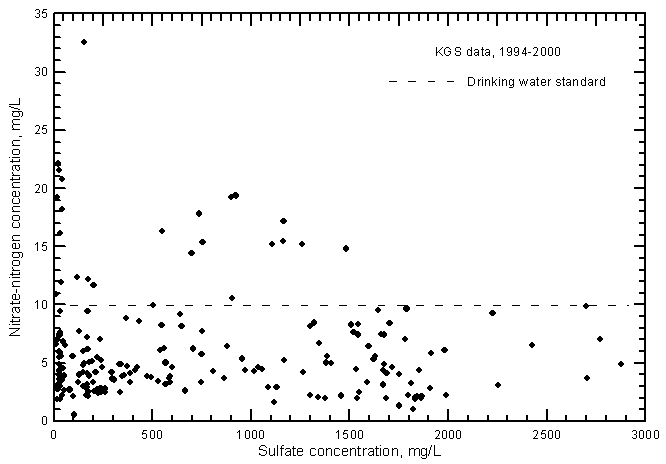
Ground water in areas of the alluvial aquifer near the Arkansas River is impacted substantially by river-aquifer interactions. The nitrate-nitrogen content of the Arkansas River during 1993-2000 almost always ranged between 0.2 and 3 mg/L and averaged between 1.5 and 2 mg/L (see Figure 17 in Whittemore, 2000). Thus, ground water in the alluvium in areas near the river that have never been or have been little used for cropland generally reflect the low nitrate content of the river water and can contain less than 3 mg/L as nitrate-nitrogen.
Dissolved nitrate concentrations generally decrease with depth in the High Plains aquifer. For example, nitrate-nitrogen contents decrease steadily with depth from over 9 mg/L in shallow ground waters to less than 3 mg/L near the bottom of the High Plains aquifer at the multi-level observation well site in Deerfield installed for this study (see Figure 6 in Whittemore et al., 2000). However, in locations where the land overlying the alluvial aquifer has not been used for crops for a substantial period, the nitrate concentration at shallow depths may not be substantially different from that in deeper ground waters. Ground water at the multi-level well site at Garden City exhibits this nitrate distribution; the nitrate-nitrogen contents at the 5 different depths are all within the range 1.8-2.5 mg/L (see Figure 11, in Whittemore et al., 2000). In locations relatively close to the Arkansas River where the ground water in the alluvial aquifer does not underlie cropland, but is in an area adjacent to cropland, the nitrate concentration in alluvial ground waters can actually be less than in ground water in the underlying High Plains aquifer. This is the case for the multi-level well site installed west of Dodge City where the nitrate-nitrogen concentration increases from about 2 mg/L in the alluvial aquifer to between 3.5 and 4 mg/L in ground waters from the two deepest wells in the High Plains aquifer.
The major factors controlling the somewhat random distribution of higher nitrate concentrations in the High Plains aquifer are surface sources of nitrate and the rate at which shallow ground water with high nitrate content moves into the aquifer. Nitrate concentrations in soil moisture and shallow ground water range substantially in areas of surface sources of nitrate such as fertilizer used for crops or animal and human wastes. A zone of low permeability clays and silty clays underlies much of the alluvium and slows the downward movement of shallow ground water. Discontinuous clay layers occur within the High Plains aquifer and also retard the downward movement of shallow recharge. However, there are some locations where the sediments do not contain thick clays of substantial extent. In these areas, areal movement of high-nitrate water in shallow zones can penetrate to the High Plains aquifer where the hydraulic heads are lower in the aquifer than near the surface. For example, the cone of depression of pumping wells can drive downward movement and mixing of shallow water with deeper ground water. Although the areal movement of high-nitrate water is retarded in areas with appreciable thicknesses and extents of clay layers, flow down through the gravel pack in the annular space of wells (described in the previous section) can cause contamination of water in the High Plains aquifer at the well locations. This mechanism allows flow across the clay layers directly into the portion of the aquifer in which the well is screened.
The Arkansas River increased in salinity after the start of ditch irrigation in Colorado in the latter 1800's. By the turn of the century, the salinity had substantially increased in the river water crossing the state line (see Whittemore, 2000). Interactions of this river water with ground water in the alluvial aquifer probably caused the first increases in ground-water salinity in the river corridor in Kansas since the latter 1800's. Seepage below ditches that diverted Arkansas River water and below fields irrigated with the saline river water then began to affect underlying ground water. Ground-water declines then allowed the seepage of more river water into the alluvial and High Plains aquifers. Ground-water quality data indicate the progressive salinization of the aquifers.
Hamilton County
Some of the first analyses of ground water in the Arkansas River valley were for samples collected in the late 1890's and early 1900's (Parker, 1911). Most of the analyses from that publication for Hamilton County are for Dakota aquifer wells. All the Dakota ground waters were fresh. Analyses for a few wells in the alluvial aquifer near Syracuse are reported. The locations are only given in terms of features within or distances from Syracuse. The TDS, sulfate, and chloride concentrations in water from a 28 ft well at the railway tank were 1,876, 962, and 61 mg/L, respectively, in 1898. This location would have been about a mile north of the river but near the former Fort Aubrey irrigation ditch. A 28 ft deep well about one mile south of the railroad track contained TDS, sulfate, and chloride contents of 1,061, 291, and 7.3 mg/L, respectively. This location was relatively near the Arkansas River. A 14 ft deep well within Syracuse produced water with a sulfate content of 574 mg/L in 1907.
Samples of ground water collected and analyzed in 1940 are reported for Hamilton County in McLaughlin (1943). The ranges in the TDS and sulfate contents of ground waters from the alluvial aquifer were reported as 277-4,666 and 68-2,794 mg/L, respectively, for 3 analyses. The least saline water was from a 10 ft well at the southern edge of the Arkansas River floodplain next to the sand hills. The other two waters had sulfate contents greater than 2,000 mg/L and were from the floodplain area north of the river. The alluvial aquifer in Hamilton County today generally contains ground water with a sulfate concentration greater than 2,000 mg/L, although some water in the Syracuse area is less saline (Appendix B; Plate A and Plate C in Whittemore and Schloss, 2000).
There are 3 wells in the Arkansas River corridor in Hamilton County that were monitored by the KDHE from the early to late 1990's. Some of these wells were originally monitored by the USGS for a varying period prior to the 1990's. Ground waters from two irrigation wells in the alluvial aquifer have remained very saline throughout the monitoring period (Sec. 19, T. 23 S., R. 42 W., sulfate concentration range 2,207-2,830 mg/L during 1964-1997, and Sec. 25, T. 23 S., R. 42 W., sulfate concentration range 2,244-3,000 mg/L during 1984-1996). Water from municipal well 4 of Syracuse, which produces from the older alluvium underlying the sand dune area south of the Quaternary alluvium, has remained fresh, with sulfate contents of 96-161 during 1983-1996.
Kearny County
Analyses reported in Parker (1911) for Kearny County include well waters collected from Lakin. A few of the wells are listed as being artesian and had depths of from 160 to 195 ft. These wells were in the High Plains aquifer; the depth to bedrock is over 250 ft in the Lakin area. Waters from the artesian wells contained TDS and sulfate concentrations of 141-322 and 25-35 mg/L, respectively, in 1900-1902. The other wells are identified as surface wells or have no listed depth. The TDS and sulfate ranges were 669-1,048 and 278-460 mg/L for 1898-1902. These wells were probably completed in the alluvial aquifer. McLaughlin (1943) listed an analysis for a 273 ft well in the High Plains aquifer in northwest Lakin that served as one of the two water-supply wells for the City. The TDS and sulfate contents of the water from the well were 964 and 457 mg/L, respectively. These concentrations are substantially greater than for the 1900-1902 samples from the High Plains aquifer in Lakin. The first water-quality record found at the KDHE for the public water supply of Lakin listed TDS and sulfate levels of 1,120 and 567 mg/L, respectively, in 1945. In 1946, a new well was installed for the water supply of Lakin; a sample taken in December 1946 from this well contained TDS and sulfate concentrations of 513 and 193 mg/L, respectively. By 1954, the TDS and sulfate contents in water from well 3 of Lakin had risen to 1,118 and 574 mg/L, respectively, and by 1955, the TDS and sulfate levels were 1,618 and 889 mg/L, respectively, in a sample from well 4. Most waters in the alluvial aquifer in the Lakin area now are expected to contain over 1,500 mg/L sulfate (Plate A and Plate C in Whittemore and Schloss, 2000), whereas the High Plains aquifer contains water with over 1,000 mg/L (Plate B and Plate D in Whittemore and Schloss, 2000). In 1956, the KDHE records list a water analysis for well 5 north of the city. The TDS and sulfate concentrations for this analysis are 236 and 30 mg/L, respectively. This well is northwest of the Amazon ditch where ground water in the High Plains aquifer was not affected by seepage of saline Arkansas River water. The ground water at that location is still fresh today as indicated by water samples from the supply wells of Lakin in that area (Appendix C; Plate B and Plate D in Whittemore and Schloss, 2000).
Parker (1911) reports a water analysis for a 198 ft deep well of the U.S. Reclamation Service in the Deerfield area in eastern Kearny County. The TDS and sulfate concentrations were 591 and 199 mg/L, respectively, in 1907. Is is unclear as to whether this well was constructed in a similar manner as irrigation wells such that it would allow gravel-pack flow of near surface waters. However, the water that was produced was fresh. No analyses are listed in McLaughlin (1943) for the Deerfield area.
The City of Deerfield in eastern Kearny County is located about a mile north of the Arkansas River valley. There are three municipal wells that currently comprise the water-supply system for the City. The wells are located within the City limits and are screened in the High Plains aquifer. The wells were installed at different times (the Park well #1 about 1950, the 10th Street well #3 in 1958, and the Big well #4 in 1978). An extended record of water analyses for the municipal wells of Deerfield was obtained from KDHE. KDHE data for municipal ground-water supplies generally reflect samples from individual wells for the period up to the mid-1970's. Based on new federal requirements in the mid-1970's, KDHE had municipalities submit samples from the distribution system, instead of individual wells, for analysis. The regulations changed to include some sampling of individual wells in addition to the distribution system several years ago, again allowing determination of differences in the quality of individual water sources. The KGS collected waters at the wellhead in cooperation with the City several times during different seasons in 1997-1999 as a part of the river corridor study. The analyses are included in Appendix A.
The variation in sulfate concentration for the municipal well waters of Deerfield is shown in Figure 21. The water pumped from the High Plains aquifer at Deerfield from 1950 to the early 1970's was very fresh and contained sulfate concentrations that were always between 100 and 150 mg/L. During the early 1980's, the salinity in the well water started to increase rapidly; by 1990, the average sulfate concentration in the well waters rose above 250 mg/L. During the 1990's the sulfate content of the water pumped from the wells has fluctuated but has remained above 250 mg/L in two wells all the time and in one well most of the time. Chloride contents have remained below 80 mg/L. The quality of the well waters varies appreciably from well to well and with time. During 1997-1999, well 1 has produced the freshest water (sulfate concentration 220-276 mg/L), well 3, with a larger pumping capacity than well 1, has yielded the most saline water (sulfate 338-589 mg/L), and well 4, with the largest pumping capacity, produces water nearly as saline (sulfate 300-567 mg/L) as well 3. The 1999 samples of water from wells 3 and 4 had the highest salinities observed for these wells.
Figure 21--Variation in sulfate concentration in ground water from municipal wells of Deerfield, Kearny County.
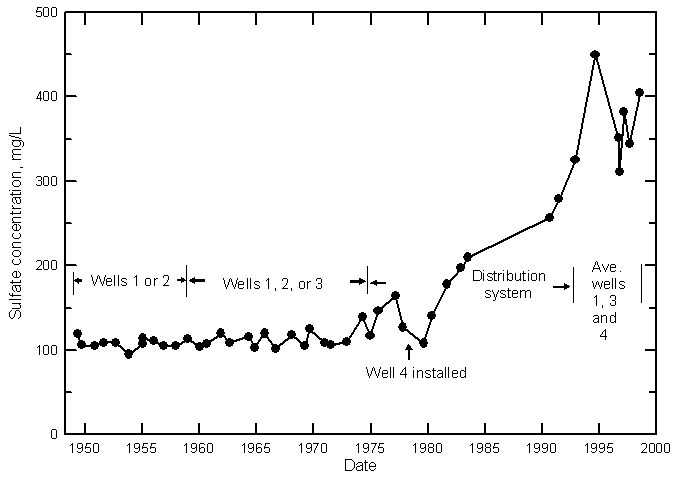
The ground water in the High Plains aquifer underlying Deerfield is generally fresher than ground water in the surrounding area. This is also supported by the freshwater in the bottom of the High Plains aquifer at the multi-level observation well site installed by the KGS (Whittemore et al., 2000). The ground water from the observation well screened at a depth interval of 324-334 ft below land surface contained a sulfate concentration of 158 mg/L in 1999. The great thickness of clays in the aquifer recorded in the well logs for the observation wells probably has retarded the downward movement of saline river water. The cone of depression of the municipal wells may cause more saline water within the High Plains Aquifer outside the city to move towards the municipal wells. The pumping stress of the municipal wells may explain the substantial fluctuations in the water quality, especially for wells 3 and 4 that pump at a much greater rate and are used much more than well 1. Municipal well 4 was installed in 1978 and the annular space was grouted to a depth of 364 ft. The thickness of the grout zone indicates that the fluctuations in the quality of water pumped from this well are not due to water flowing from the surface along the annular space but to the water drawn in from the screen interval at 364-394 ft.
There are 4 wells in the river corridor or area contoured for Plates A and B (Whittemore and Schloss, 2000) in Kearny County that were monitored by the KDHE from the early to late 1990's, some of which include earlier sample collection by the USGS. Water from a domestic well (Sec. 31 T. 24 S., R. 35 W.) in the alluvial aquifer within the South Side ditch service area has remained saline during 1990-1997 (sulfate content 1,580-1,729 mg/L). Ground water from an irrigation well (Sec. 28, T. 23 S., R. 37 W.) in the High Plains aquifer north and west of the ditch-irrigated area has remained fresh during 1987-1997 (sulfate content 131-152 mg/L). Samples from another irrigation well (Sec. 28, T. 25 S., R. 36 W.) in the High Plains aquifer have been collected by the KGS (in 1975), the USGS (1977-1989), and the KDHE (1990-1996). This well is located about 1.5 miles south of the edge of the Quaternary alluvial aquifer and the boundary of the South Side ditch service area. The sulfate content of water from this well was 130 mg/L in 1975, rose to 290 mg/L by 1983, decreased to 80 mg/L by 1988, jumped to 348 mg/L in 1989, and varied between 225 and 421 mg/L during 1990-1996. The highest concentration observed is that for 1996. This well illustrates the progressive migration of saline water from the alluvial aquifer into the High Plains aquifer just outside the alluvial corridor. Lakin municipal well 5 (Sec. 16, T. 24 S., R. 36 W.) is in the KDHE monitoring network. This well lies 0.5 mile north of the boundary of the Amazon ditch service area and about 1 mile northwest of the Amazon canal. As indicated earlier, the water in this area has remained fresh; the sulfate content of samples from the well has remained in the range 27-31 mg/L during 1990-1997.
Finney County
No water analyses are listed for Holcomb in Parker (1911). Although Latta (1944) does not include any analyses of wells used for public water supplies in Holcomb, he reported a water analysis for a 220 ft deep well (Sec. 7BCB, T. 24 S. R. 33 W.) in the High Plains aquifer owned by a gas company. The well location is about 1/4 mile southwest of municipal wells 1 and 2 and approximately 0.7 mile west of municipal well 3 in the City of Holcomb. The sample collected from the 220 ft well in 1940 contained TDS and sulfate concentrations of 242 and 50 mg/L, respectively, indicating that the water in the High Plains aquifer was very fresh. The City of Holcomb now has three municipal wells (nos. 1-3) completed in the High Plains aquifer within the city limits and another over a mile to the north-northwest of the city (no. 4). Analyses of the KDHE for samples from well 1 of Holcomb start in 1962 and for well 2 in 1972. Some samples collected between 1977 up to recent years are a combination of wells 1 and 2 because both the water produced from both wells now enters the same pump house. Municipal well 3 of Holcomb was constructed in 1979. From 1981 to 1989 the USGS annually collected (except for 1982) and analyzed a sample of water from well 3. The KDHE then took over the sampling of well 3 as a part of its sampling program in which it collects and analyzes water about every two years. The KGS collected samples from all four of the municipal wells of Holcomb in the spring and summer of 1997 as part of the river corridor study (Appendix A).
The variation in sulfate concentration for the 3 municipal supply wells within the city limits of Holcomb is plotted in Figure 22. The last point for the water combined from wells 1 and 2 is a sulfate value estimated from the specific conductance measured in the pump house based on the conductance-sulfate relationship described earlier in this report. The sulfate concentration in the High Plains aquifer underlying Holcomb was initially less than 80 mg/L for all three well locations. The sulfate content has risen gradually from the 1960's to the 1990's at the well 1 and 2 locations. The sulfate levels have fluctuated in water from well 3 but have generally increased through the 1980's and 1990's at a much greater rate than at wells 1 and 2.
Figure 22--Variation in sulfate concentration in ground water from municipal wells of Holcomb, Finney County.
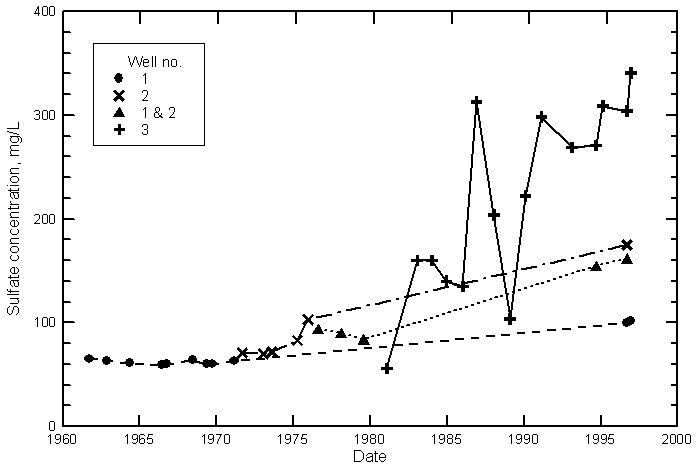
The relatively low sulfate concentration present in the High Plains aquifer within the city of Holcomb, especially at wells 1 and 2, indicates that freshwater is still present in the aquifer. An additional indication of fresh ground water in the aquifer is the analyses of water produced from a well and used for public consumption at a small business in Holcomb (Sec. 7BDDC, T. 24 S., R 33 W.); the sulfate concentration was 46 and 53 mg/L in 1995 and 1997, respectively, based on KDHE data. The freshwater underlying the older part of Holcomb contrasts with the saline ground water to the north and west of the city. The lithologic log recorded by the driller of well 3 in 1979 indicates that over 150 ft of clay (depth 41-197 ft below land surface) underlies the alluvium at the location. This clay apparently has protected the High Plains aquifer from contamination by the saline river water. Substantial clay thicknesses make the subsurface in this area appear similar to that at Deerfield. Holcomb well 1 is 0.1 mile east-southeast of well 2. The pumping rate for each of these two wells is about 110 gpm. Well 3 is about 0.5 mile east-southeast of well 1 and pumps water at a rate of about 600 gpm. The greater pumping rate of well 3 might explain why the salinity of the water increased at a faster rate than at wells 1 and 2. The greater drawdown and extension of the cone of depression around well 3 during pumping could draw in more saline ground water in areas around the town that have been affected by infiltration of river water from the river channel or the ditch irrigated fields. Municipal well 4 of Holcomb is located approximately 1.3 miles north-northwest of wells 1 and 2 and was installed in 1987 into the High Plains aquifer in a ditch irrigation service area and about 1/4 mile south of the Farmers canal. The sulfate content of samples collected from municipal well 4 by the KGS in the spring and summer of 1997 was 332-334 mg/L (Appendix A).
There are 15 analyses of well waters listed in Parker (1911) for the Garden City area. Only relative locations are listed in the publication. The TDS and sulfate concentration ranges were 144-2,140 and 8-1,060 mg/L, respectively, for samples collected from 1898 to 1900. The ground water with the highest sulfate content was from west of the city, which would place it in the area overlying the alluvial aquifer near the Arkansas River and within a ditch irrigation area based on 1942 data assembled by Colorado on Kansas irrigated area. A city water well, 34 ft deep and located at the railroad tanks in Garden City, yielded water with TDS and sulfate concentrations of 736 and 291 mg/L, respectively. This location would place the well in the alluvial aquifer about 1/2 mile north of the Arkansas River. A 16 ft deep well, located 700 ft south of the south bank of the Arkansas River near the sand hills produced water with TDS and sulfate levels of 233 and 23 mg/L. This well would also have been in the alluvial aquifer. The freshest water was from a 32 ft well located 3 miles south of the Arkansas River. This well would have been in the upper part of the High Plains aquifer. Three analyses are listed in Parker (1911) for artesian wells at Garden City. The depths for the wells range from 130 to 350 ft, placing them in the High Plains aquifer. The ranges for TDS and sulfate concentrations for the artesian wells were 272-395 and 59-76 mg/L, respectively.
In 1940, ground water produced from the alluvial aquifer by irrigation wells with depths of 45 ft on the west side (Sec. 12 and 13, T. 24 S., R. 33 W.) of Garden City was saline; TDS and sulfate contents were 2,196-3,197 and 1,281-1,920 mg/L, respectively (Latta, 1944). The wells were located within a ditch-irrigated area. Other wells located in the alluvium north of the river and within the ditch-irrigated area also generally yielded saline water.
Ground water from a 71 ft deep domestic well (Sec. 19CD, T. 24 S. R. 32 W.) located about 1/2 mile south of the Arkansas River in terrace gravel contained TDS and sulfate concentrations of 232 and 13 mg/L, respectively. This well would have been no more than about 0.5 mile south-southeast of test holes (Sec. 19CA, T. 24 S., R. 32 W.) drilled 0.2 miles south of the Arkansas River and sampled by the USGS in 1961 (Meyer et al., 1970). The TDS and sulfate concentrations for water from the shallowest depth (65 ft) sampled by the USGS at this location were 1,090 and 570 mg/L, respectively. In 1997, the KGS installed a multi-level well site (Sec. 19CABA, T. 24 S., R. 32 W.) at Garden City for the river corridor study. The location was selected to be as close as practical to the USGS test-holes site of 1961. The ranges in TDS and sulfate concentrations during 1997-1999 for ground water from the shallowest observation well (screened at 51-59 ft below land surface) were 2,568-2,782 and 1,547-1,672 mg/L, respectively (Appendix A).
Comparison of the TDS and sulfate contents for the ground waters from the 1961 USGS test holes and the 1999 samples from the KGS multi-level wells illustrates the increase in salinity in the entire aquifer system at the location just south of the Arkansas River at Garden City (Figure 23). Both test-hole and multi-level well sites obtained water from 5 similar depths from near the bottom of the alluvium or top of the High Plains aquifer to near the bottom of the High Plains aquifer. Only the ground water at the shallowest depth sampled in 1961 was slightly saline. The three deepest test-hole samples were very fresh, with TDS and sulfate concentration ranges of 225-229 and 24-52 mg/L, respectively. By 1997, the salinity of the ground waters in the entire aquifer profile had increased substantially such that now all of the ground water in the High Plains aquifer at this location is saline.
Figure 23--Sulfate and total dissolved solids concentrations in ground waters from test holes drilled by the USGS in 1961 and pumped from the KGS multi-level wells at the Garden City site in 1999. The bottom of the graph represents the depth to bedrock. The depths plotted for the USGS test holes represent the middle of a 5-foot interval from the reported bottom depth of the hole,, which is the assumed zone from which the water flowed.
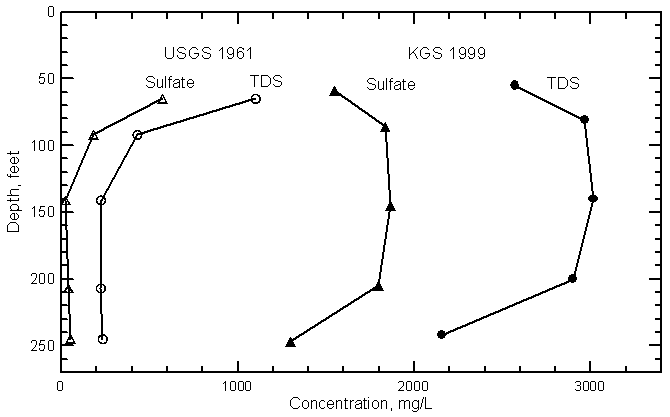
Garden City has installed many wells in the High Plains aquifer and two newer wells in the Dakota aquifer within the city north of the Arkansas River. As indicated above, artesian wells in the High Plains aquifer in Garden City yielded waters with TDS and sulfate concentrations of 272-395 and 59-76 mg/L, respectively, in 1898-1899 (Parker, 1911). In 1940, Latta reported an analysis for a composite sample from three wells, ranging from 258 to 299 ft deep in the High Plains aquifer, used for municipal supplies by Garden City. The TDS and sulfate values for this water were 481 and 208 mg/L, respectively. These concentrations are elevated from 1911 but indicate freshwater was still present in the High Plains aquifer within Garden City at that time. Analytical records were obtained from Garden City and the KDHE for municipal wells within the city limits and plotted in Figures 24 and 25. Most of the municipal well waters in the city had sulfate contents that were around 200 mg/L or below up to the mid-1960's. A sulfate concentration of 200 mg/L equates to a TDS of approximately 600 mg/L based on interpolation from Figures 3 and 5. Two samples from well 10 and one sample from well 13 contained higher sulfate contents of near 400 and 700 mg/L, respectively, indicating that some saline water was able to enter these wells during the 1950's. Sulfate values of 400 and 700 mg/L correspond to TDS contents of about 800 and 1,300 mg/L, respectively. As described earlier, the KDHE only required collection of samples from the distribution system from the 1970's to the early 1990's, thus, no data for individual wells were found for this period. In the 1990's, the sulfate concentration range for samples from the city wells in the High Plains aquifer was large. The samples from some wells contain sulfate levels less than 200 mg/L, whereas the waters from other wells have sulfate contents as high as over 1,400 mg/L. Points for the two wells of Garden City completed in the Dakota aquifer are shown for comparison in Figure 25; the sulfate concentrations for wells 26 and 27 are less than 100 and 200 mg/L, respectively. In general, the data described above indicate that the salinity of ground water in the High Plains aquifer has greatly increased during the past century. Most of the increase has occurred after the 1960's.
Figure 24--Variation in sulfate concentration in ground water from municipal wells nos. 9-13 of Garden City.
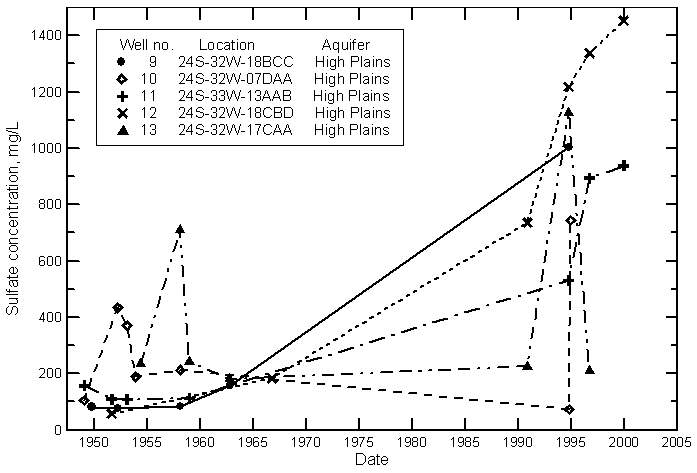
Figure 25--Variation in sulfate concentration in ground water from municipal wells nos. 15-18, 26, and 27 of Garden City.
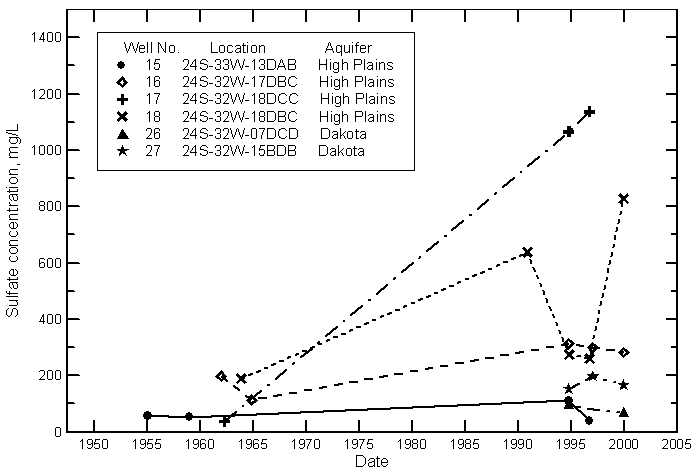
Municipal wells 10, 13, and 18 in the High Plains aquifer within Garden City yielded waters with widely varying salinity from 1990 to 2000. The two samples from well 15 in the mid-1990's contained sulfate levels of around 100 mg/L or less. One possible explanation for the fluctuation in salinity in some well waters is that there exist pockets of fresh ground water in the aquifer along with very saline water. Differing rates of pumping could move a freshwater-saline transition zone within the aquifer resulting in varying water quality. Another possible explanation is crossflow of ground water from shallow aquifer strata along the annular space of a well to the deeper aquifer zone in which the well is screened or through holes in the casing into the well water pumped. Alternatively, if the municipal supply well had a secure, deep grout seal and no casing holes, the crossflow could occur in an old, poorly constructed well nearby the supply well. Even if the old well had been plugged within the casing, if the gravel pack extended to within the alluvium, the crossflow could still occur because the gravel pack was not usually sealed during plugging. If an unplugged, abandoned well existed near the supply well without present surface expression, holes in the casing as well as gravel pack might provide for cross-aquifer flow. Water levels in the alluvial aquifer were about 40 ft higher than in the deep High Plains aquifer in 1995 based on monitoring wells constructed near municipal well 18 (Kansas Department of Health and Environment, 1996). Thus, a substantial hydraulic head gradient exists for the crossflow.
Cross-aquifer flow would appear to be the best explanation for the two samples from well 10 and one sample from well 13 collected during the 1950's that contained sulfate levels substantially greater than 200 mg/L. These two wells also showed wide fluctuations in the salinity of samples in the 1990's. Although it is possible that freshwater may still exist in the aquifer underlying Garden City, it is hard to explain the high range in salinity over relatively short distances as shown by the sample data for the 1990's in Figures 24 and 25. For example, the last samples from well 9, 12, and 15 had sulfate levels of 1,000, 1,450, and 40 mg/L, respectively. Well 9 is only about 1/4 mile distant from wells 12 and 15, and wells 12 and 15 are less than 1/2 mile apart. A sample of water collected from well 13 in 1995 contained 1,130 mg/L dissolved sulfate, whereas the waters obtained from well 16 during 1995-2000 have had a sulfate concentration of about 300 mg/L. Wells 13 and 16 are only 1/4 mile apart. Some mixing of the water in the High Plains aquifer is expected due to different ground water flow rates and direction caused by varied pumping of the wells. Therefore, the explanation of crossflow of water from the shallow aquifer to the water pumped from the deep aquifer is thought to be a more likely cause of the salinity fluctuations. Information found from Garden City files for well 10 and some subsequent wells indicates that the annular space in the borehole was sealed to a depth of over 100 ft. In general, the more recent the municipal well, the deeper is the grout depth. Thus, unless there is cascading water within the wells from casing holes, the crossflow is most likely along the gravel pack of nearby plugged wells or within the casing and along the gravel pack of abandoned, unplugged wells.
A few of the municipal well waters within Garden City have been contaminated by volatile organic chemicals (VOC's) and methyl tertiary-butyl ether (MTBE), a water soluble additive to gasoline (Kansas Department of Health and Environment, 1995, 1996). The contamination supports the mechanism of flow of shallow aquifer water to the deeper aquifer along well boreholes. The movement of these chemicals in water from near the surface to the deeper aquifer in which the municipal wells are screened would be expected to be retarded due to the presence of clay layers in the unconsolidated strata underlying Garden City. The travel time for a chemical such as MTBE, which was not used until the early 1980's, from near surface to the deeper aquifer would be expected to be greater than for the observed appearance of the chemical in water from municipal well 18 by 1995. Waters from wells 10 and 18 contained VOC's starting in 1986 and 1991, respectively.
The high values of sulfate for wells 10 and 13 during the 1950's could be from saline water from the alluvial aquifer that entered the deep aquifer through nearby operating or abandoned wells. This could be the cause if the grout seal was not deep enough in the abandoned wells and allowed the saline water to enter below the seal. Saline water was present in the alluvial aquifer as a result of Arkansas River water used for ditch irrigation located within the present city limits in 1942 and before. However, the recent large fluctuations in salinity in waters from wells 10, 13, and 18 might result from cross-aquifer flow of less saline water from the shallow sediments within Garden City. The use of fresher water in the city since the installation of the sand hills wells south of Garden City in the 1960's and 1970's might have resulted in diluting the salinity in the alluvial aquifer underlying the city. The recharge rate in some parts of the city could have increased with time where use of water at the surface, such as for lawn watering, and small leaks in water and sewer lines are important recharge sources. If a city well has not been used for an extended period and the well is turned on for sampling, the sample might not be truly representative of the water at the screened interval but of a mixture of shallow and deep water. This would especially be true if there were holes in the casing of the municipal well or in nearby, abandoned wells that are either unplugged or plugged only in the top part of the alluvium. For example, before municipal well 6 was plugged, holes were found in the casing that allowed cascading of shallow water into the well. Shallow water crossflow might explain the freshwater observed in the mid-1990's in well 15 if this scenario is possible. However, if the low salinity water in some samples from wells 10, 13, 15, and 18 during the 1990's truly reflects freshwater in the deep High Plains aquifer underlying the city, then the high salinities in most of the samples of the city wells could be from crossflow of shallow saline water in the well or along nearby boreholes.
The question of whether the freshwater appearing in some wells within Garden City is from the deep or shallow aquifer could be answered by monitoring the specific conductance of water during extended pumping of selected wells. For this test, it would be desirable to select wells that had not been pumped for an extended period. If the specific conductance steadily and substantially increased during pumping of municipal wells such as numbers 15 and 16, it would indicate that the water in the High Plains aquifer is saline at those locations rather than fresh. Likewise, an appreciable increase in the conductance of water produced from wells 10, 13, and 18 after not being used would also suggest that the saline water source was from the aquifer at the well screen intervals. If the conductance of water pumped from wells 15 and 16 remained low, and decreased substantially in wells 10, 13, and 18 during extended pumping after not being used, then there could be pockets of freshwater in the deep High Plains aquifer.
Starting in 1965, Garden City expanded its water-supply system by installing municipal wells in the High Plains aquifer underlying the sand hills to the south of the city. Sand hills wells 1-4 were constructed in 1965-1966 from between about 2 and 3.5 miles south of the Arkansas River. Sand hills wells 5-7 were installed in the 1970's based on an installation date of 1975 for well 6 listed in Kansas Department of Health and Environment (1996). Wells 5 and 6 are the most northerly of the wells and are between 1.5 and 2 miles south of the river. Well 7 is a little over 3 miles south of the river. The 7 sand hills wells are also numbered as water-supply wells 19-25 by the KDHE. The wells are generally greater than 300 ft deep and are screened in the High Plains aquifer at a range of depths over 150 ft below land surface. The depth to the gravel pack below the grout seal is 50 ft in sand hills well 1 but is more than 100 ft in sand hills wells 2-4 and probably greater than 100 ft in wells 5-7.
Water-quality data for samples from the sand hills municipal wells are listed in Table 1. The sulfate concentration range for sand hills wells 1-4 and 7 during the period 1993 to 2000 was 20-45 mg/L. These values are typical of fresh ground water in the High Plains aquifer south of the Arkansas River that has not been affected by saline river water. Sand hills well 1 was constructed about 1/4 mile west of the municipal waste disposal site of Garden City in 1965. The chloride content is slightly greater in water from well 1 than in samples from wells 2-4 and 7. The nitrate-nitrogen content for well 1 in 1993 was 3.0 mg/L, a concentration not much greater than the natural range of about 2 mg/L or less for uncontaminated water in the High Plains aquifer. The ground-water quality at sand hills well 1 does not appear to be significantly impacted, if at all, by leachate from the municipal waste site. The regional ground-water flow direction is generally towards the east-southeast in the area. None of the sand hills municipal wells lies to the east of the waste site, although well 7 is located to the south.
Saline water from the Arkansas River has now migrated to sand hills municipal wells 5 and 6 as indicated by the increasing sulfate concentrations. Ground water at well 5 had been impacted to a small degree by the saline water in 1993 and now yields water with a sulfate content over 700 mg/L. In 1993, the sulfate value for water from sand hills well 6 was at the upper end of the range for wells 1-4 and 7 during 1993-2000. By October 2000, the sulfate concentration in well 6 had risen to above 300 mg/L. A domestic well in the northeast corner of Sec. 36, T. 24 S., R. 33 W. produced water with a sulfate content of 791 mg/L in 1996, and two irrigation wells in the northeast quarter of the same section yielded water with a sulfate content in the range 505-632 mg/L during 1997-1999. Sand hills wells 1 and 2 are also located in Sec. 36. Sand hills well 5 is in the section to the east and sand hills well 6 is in the section to the north of Sec. 36. The sulfate/chloride ratio for the 2000 sample from well 5 is within the range for other ground waters in the High Plains aquifer with similar sulfate levels. The sulfate/chloride ratio in water from well 6 is below the range expected for only being impacted by saline Arkansas River water. There appears to be an additional chloride source affecting the water quality at well 6. Even in 1993, when the sulfate content in water from well 6 was at the upper end of the range for samples from wells 1-4 and 7, the chloride content was over 2 to 3 times that in water from sand hills wells 1-4 and 7.
Table 1--Quality of ground water from the sand hills wells of the municipal water supply of Garden City. The nitrate concentration was not determined in the 2000 samples.
| Well no. | Location | Sample date | SO4, mg/L | Cl, mg/L | NO3-N, mg/L |
|---|---|---|---|---|---|
| 1 | 24S-33W-36DAC | 2/3/93 | 20 | 7.2 | 3.02 |
| 1 | 24S-33W-36DAC | 10/24/00 | 33.9 | 8.1 | |
| 2 | 24S-33W-36CCC | 2/3/93 | 31 | 5.1 | 1.87 |
| 2 | 24S-33W-36CCC | 10/24/00 | 37.2 | 4.6 | |
| 3 | 25S-33W-01ACA | 2/3/93 | 39 | 4.9 | 2.19 |
| 3 | 25S-33W-01ACA | 10/24/00 | 34.6 | 5.9 | |
| 4 | 25S-33W-01DCA | 2/3/93 | 43 | 4.9 | 2.24 |
| 4 | 25S-33W-01DCA | 7/28/99 | 45 | 3.9 | 2.39 |
| 4 | 25S-33W-01DCA | 10/24/00 | 45.3 | 4.9 | |
| 5 | 24S-32W-31BBB | 2/3/93 | 112 | 10.9 | 2.26 |
| 5 | 24S-32W-31BBB | 10/24/00 | 744 | 72.1 | |
| 6 | 24S-33W-25DDB | 2/3/93 | 45 | 16.6 | 2.43 |
| 6 | 24S-33W-25DDB | 10/24/00 | 319 | 132 | |
| 7 | 25S-32W-06DBB | 10/24/00 | 21.2 | 4.1 |
The Southwind Subdivision of Garden City is located 1.5 to 2 miles to the east-northeast of sand hills municipal wells 5 and 6. There are two water supply wells within the Subdivision, one of which (well 2) is pumped more often than the other well. KDHE data show small salinity increases in samples from well 1 and a large rise for well 2. In 1982 and 1984, the sulfate and chloride concentration ranges were 10-16 mg/L and 2.8-5.0 mg/L, respectively. In 1991, the sulfate and chloride contents of water from well 1 were about the same (14 and 5.3 mg/L, respectively) as in the early 1980's, but the sulfate and chloride levels had risen to 45 and 10.8 mg/L, respectively, in water from well 2. By May 2000, the sulfate and chloride concentrations had increased a small amount in water from well 1 (23.3 and 29.2 mg/L, respectively) but had greatly increased in water from well 2 (417 and 51.2 mg/L, respectively). The main pumping of well 2 has drawn substantial amounts of ground water made saline by infiltration of Arkansas River water, whereas well 1, which is within about 1/4 mile of well 2, has only been affected to a very small degree by the saline water.
The sampling program of GMD3 for assessing ground-water quality also indicates increases in the salinity of some well waters in the Garden City region that produce from the High Plains aquifer under the alluvial valley. For example, water from a domestic well in Sec. 22, T. 24 S., R. 32 W. (GMD3 site ID FI-18) increased in sulfate content from 500 mg/L in 1988 to 1,013 in 2000. Some well waters have fluctuated in salinity, such as at a domestic well in Sec. 1, T. 24 S., R. 33 W (GMD3 site FI-20) at the edge of the alluvium, which had a sulfate range of 393-1,303 mg/L during 1988 to 2000. Another example of a domestic well with varying salinity in waters pumped from beneath the alluvial valley is GMD3 site ID FI-29 in Sec. 16, T. 24 S., R. 33 W., which had sulfate levels in the range 395-1,552 mg/L during 1989-2000. Some wells in the High Plains aquifer outside the alluvial valley but within the ditch irrigation boundaries have produced waters with increasing salinity. For example, the sulfate concentration rose from 386 mg/L in 1990 to 614 mg/L in 1999 in water from an irrigation well in Sec. 18, T. 23 S., R 34 W. (GMD3 site ID FI-58).
There are 3 wells in the river corridor or area contoured for Plates A and B (Whittemore and Schloss, 2000) in Finney County that were monitored by the KDHE from the early to late 1990's, some of which include earlier monitoring by the USGS. One of the wells monitored is municipal well 3 of Holcomb that was discussed above. Water from an irrigation well (Sec. 17, T. 23 S., R. 33 W.) in the High Plains aquifer within the Great Eastern ditch service area has fluctuated in TDS content during 1975-1996 (sulfate concentration 147-661 mg/L). The first sample was collected by the KGS in 1975; the sulfate content was 313 mg/L. The highest sulfate level was observed in 1994 and the last sample had a sulfate content of 491 mg/L. Ground water was collected from an irrigation well (Sec. 8, T. 21 S., R. 32 W.) in the High Plains aquifer in north central Finney County during 1975-1997. (Note: The KGS and USGS data for the well record the location as Sec. 8ABD, which is very close to the KDHE location of Sec. 8ACA. The locations are assumed to be for the same well. The well water that was first sampled by the KGS in 1975 contained 444 mg/L dissolved sulfate. The sulfate concentration has varied during monitoring from a low of 368 mg/L in 1997 to a high of 740 in 1979. The location is north of the ditch irrigation service areas and in the Scott-Finney depression. As described earlier in the section on salinity distribution, natural TDS concentrations are elevated in the ground water in the depression as a result of surface water draining into a partially closed basin where evapotranspiration has concentrated dissolved salts over thousands of years.
Gray County
All of the chemical analyses in Parker (1911) for Gray County are for well waters in the Cimarron area. Four of the wells are identified as a surface well, as located in the river bottom, or near the railroad depot or tank. The railroad depot site in Cimarron overlies the alluvial aquifer north of the Arkansas River. All 4 of these wells probably drew water from the alluvial aquifer. The sulfate concentration range for samples collected during 1898-1900 from the 4 wells was 314-670 mg/L. The sulfate content for other wells in the Cimarron area, including two samples for artesian wells, ranged from 27 to 108 mg/L.
Latta (1944) reported a range of 52-626 mg/L for water samples from 4 wells in the Arkansas River alluvium in Gray County. The well with the highest sulfate content was 15 ft deep and located north of the Arkansas River between Charleston and the river. The well with the lowest salinity was 14.5 ft deep and sited south of the river in eastern Gray County. Latta (1944) indicated that Cimarron obtained its public water supply from two wells that tapped the Ogallala aquifer and were located near the northern boundary of the alluvial valley. He stated that "the wells are 180 ft deep, the upper part of each well being cased off to prevent entrance of water from the alluvium." The sealing of the wells through the alluvium protected the quality of the High Plains aquifer from the saline alluvial water. A water sample collected from one of the municipal wells in 1940 contained sulfate and chloride concentrations of 49 and 6 mg/L, respectively. The latest water analysis for one of these two municipal wells found in KDHE records indicates that the well water from well 2 had not changed in quality by 1975; the sulfate and chloride contents were 49 and 10 mg/L, respectively in the sample.
Stramel et al. (1958) listed 6 analyses of ground water collected from the alluvial aquifer in Gray County during 1956. The sulfate concentrations ranged widely from 11 to 858 mg/L. They found that ground water from the Ogallala Formation and the alluvium and Pleistocene deposits south of the river was generally of good quality. They also stated that the water in the "Arkansas River at low flow and in the alluvium north of the river is of relatively poor quality." Two analyses of Arkansas River water collected on April 10, 1956 are included in Stramel et al. (1958). The sample collected in eastern Finney County south of Pierceville contained a sulfate concentration of 1,000 mg/L and the water sampled in Gray County south of Ingalls had a sulfate content of 814 mg/L. The river was at low flow during this period as indicated by the flows within the range 16-23 cfs at Garden City from April 6 to April 10, 1956. The decrease in the salinity of the river water from Pierceville to Ingalls indicates the dilution by freshwater that discharged from the High Plains aquifer to the alluvium and then to the river.
By the 1990's, sulfate levels in the alluvial ground waters in Gray County had risen to within the range of several hundred to over 1,600 mg/L (Appendix B). The salinity of waters produced from wells in the High Plains aquifer underlying the alluvial aquifer of the Arkansas River ranged widely, with sulfate and chloride contents from less than 100 and 10 mg/L, respectively, to over 1,600 and 100 mg/L, respectively. By the late 1990's, Cimarron had municipal wells with identifying numbers up to at least 8 based on KDHE records. The newer wells appearing in the KDHE data have locations that are from the edge of the alluvial valley in the city to north of the valley. Well 3 of Cimarron, at the edge of the alluvium, first appears in KDHE analytical records in 1950 with the note "new well". The sulfate and chloride concentrations of the 1950 sample were 48 and 11 mg/L, respectively. Samples collected from municipal well 3 in 1952-1954, 1961, 1967, and 1977 had sulfate and chloride concentration ranges of 35-50 and 6-9 mg/L, respectively, indicating that there was no impact from saline water in the alluvium. However, the latest sample data available from the KDHE indicate the appearance of a small amount of saline alluvial water mixing with the High Plains aquifer; the sulfate and chloride contents of a 1995 sample were 135 and 10.6 mg/L, respectively. Municipal wells 6-8, located north of the alluvium, yielded waters with sulfate and chloride concentration ranges of 106-123 and 27-48 mg/L, respectively, in 1995. The ground water at well 6 appears to have somewhat greater background contents of dissolved solids than at municipal well 2. The first sample of well 6 water in KDHE records is for 1971; the water contained sulfate and chloride concentrations of 88 and 21 mg/L, respectively, in comparison with 114 and 48 mg/L, respectively in 1995.
Data from the GMD3 sampling program indicate that water in the High Plains aquifer underlying the alluvial aquifer of the Arkansas River is increasing in salinity in Gray County. One example is a 190 ft deep irrigation well near Ingalls (GMD3 site ID GY-24) in Sec. 2, T. 26 S., R. 29 W. that yielded water with a sulfate content of 219 mg/L in 1989 that rose to 731 mg/L in 1999. Another irrigation well, with a depth of 198 ft (GMD3 site ID GY-30) in Sec. 17, T. 26 S., R. 27 W. to the southeast of Cimarron, pumped water that has increased steadily in sulfate concentration from 297 mg/L in 1989 to 1,034 in 1999.
There are 3 wells in the river corridor or area contoured for Plates A and B (Whittemore and Schloss, 2000) in Gray County that were monitored by the KDHE from the early to late 1990's. Fresh ground water from an irrigation well (Sec. 19, T. 24 S., R. 29 W.) in the High Plains aquifer several miles north of the Arkansas River valley has contained a relatively constant sulfate level (145-154 mg/L) during 1990-1996. Ground water several miles south of the valley pumped from an irrigation well (Sec. 5, T. 27 S., R. 28 W.) in the High Plains aquifer is even fresher, with a sulfate concentration of 25-45 during 1990-1996. Another irrigation well (Sec. 5, T. 27 S., R. 28 W.) in the KDHE monitoring network is in the High Plains aquifer and is located at the southern edge of the Quaternary alluvium. From 1990 to 1993, the sulfate content of samples from the well was low, 47-53 mg/L, but in 1997, the sulfate level increased appreciably to 413 mg/L.
Ford County
Parker (1911) lists analyses of water samples from many wells in the Dodge City area. Many of these wells were shallow, with depths of 12 to 60 ft. The sulfate and chloride concentration ranges for these well waters were 22-247 and 17-37 mg/L, respectively. Some of the wells that had no listed depths included descriptions that indicate they were located in the alluvial valley. Sulfate concentrations in these wells generally ranged from less than 100 mg/L to 253 mg/L except for one exploring well that was sited 500 ft south of the river, which produced water with sulfate and chloride contents of 563 and 57 mg/L, respectively. Wells in the Dodge City area with depths greater than 100 ft pumped water with sulfate and chloride concentrations of less than 50 and 20 mg/L, respectively.
Waite (1942) published analyses for samples collected from 11 wells in the alluvial aquifer of the Arkansas River in Ford County in 1939. The sulfate and chloride ranges for these samples were 22-1,740 and 6-115 mg/L, respectively. The wells producing the freshest waters were south of the Arkansas River. The wells yielding water with the highest sulfate levels were irrigation wells located on the north side of the Arkansas River. The high sulfate contents in the shallow aquifer could have resulted from the use of ground water containing some river-derived salinity that was then concentrated by consumptive evapotranspiration during irrigation. One of these irrigation wells pumped water (sulfate content of 606 mg/L) with 24 mg/L dissolved nitrate-nitrogen, indicating that a contamination source from the surface affected the water quality.
Waite (1942) also listed analyses for water samples collected in 1939 from wells drilled into the Ogallala Formation underlying the Arkansas River alluvium in Gray County. There were 4 wells that were not within the city limits of Dodge City. The waters from these wells had sulfate and chloride concentration ranges of 30-109 and 6-16 mg/L, respectively. There were two samples listed for wells within Dodge City. One sample was a composite of water produced from 3 municipal water wells in T. 26 S., R. 25 W, one of which was located near the south line of Sec. 26, another on the north side of the Arkansas River in the City Park in Sec. 35, and the third on the south side of and very close to the Arkansas River in Sec. 35. The composite sample had sulfate and chloride contents of 295 and 30 mg/L, respectively. It is probable that the elevated dissolved solids in the ground water derived from alluvial water that entered along the borehole of one of the wells or a nearby well that was not sealed through the alluvium. The other sample was from an industrial well to the west of the first municipal well above (Sec. 26). Waite (1942) indicated that the high nitrate-nitrogen content (29 mg/L) suggested that the water had "been contaminated by surface drainage" and was "not a true Ogallala water"; the sulfate and chloride concentrations were 1,442 and 109 mg/L, respectively.
Many additional wells have been drilled into the High Plains aquifer for the municipal supply system of Dodge City. Although several of these lie outside the boundaries of the alluvial aquifer of the Arkansas River, some of the wells are within the alluvial valley. These include municipal wells 3, 4, 6, 8, 11, 14, and 15. KDHE records indicate that new well 8 yielded water with sulfate and chloride contents of 35 and 9 mg/L, respectively, in 1955. Since then, the salinity of water from well 8 has risen substantially (Figure 26). The water from municipal well 3 was appreciably saline by 1970; the sulfate content of a sample collected that year was 1,008 mg/L and the chloride value was 84 mg/L. The sulfate concentration decreased to 218 mg/L in a sample collected in early 1995 but then increased to 840 mg/L in 1997 (Figure 26). The first analysis available in KDHE data for well 6 is for a sample collected in 1976; the water had already been affected by saline water from the Arkansas River as indicated by the sulfate concentration of 270 mg/L. The sulfate level in water from well 6 rose to 548 mg/L by 1997 (Figure 26). Only two relatively recent analyses were found for wells 4 and 14. The sulfate increased from 38.5 to 317 mg/L from 1995 to 1997 in water from well 4, whereas the sulfate content changed little (241 to 257 mg/L) in water from well 14 during the same two-year period. A sample from well 11 taken in 1969 showed that the water was already slightly saline; the sulfate content was 546 mg/L. The sulfate concentration stayed in the same general range during 1995 and 1997 for municipal well 11 (Figure 26). Only one analysis for a water from well 15 was found; the sulfate level was 521 mg/L in 1995.
Figure 26--Variation in sulfate concentration in ground water from municipal well of Dodge City, Ford County, in the High Plains aquifer underlying the alluvial aquifer (solid symbols) and near the boundary of the alluvial aquifer (open symbols).
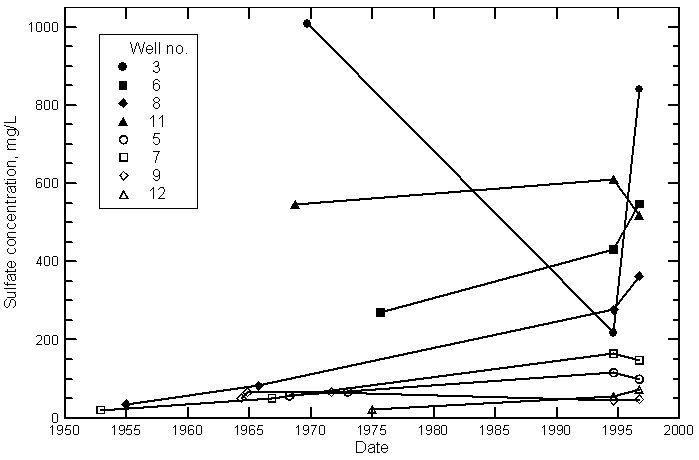
Dodge City municipal wells 5, 7, and 9 are located near the northern edge of the alluvial valley and well 12 is near the southern boundary of the Quaternary alluvium. In contrast with the ground waters from the municipal wells that underlie the alluvium (solid symbols in Figure 26), the waters from the wells near the edge of the alluvial aquifer boundary (open symbols in Figure 26) have been either not affected or little impacted by saline water from the Arkansas River. A sample collected from well 5 in 1968 contained 57 mg/L dissolved sulfate. The sulfate concentration only increased to near 100 mg/L by the 1990's (Figure 26). The dissolved sulfate in water from well 7 rose from 51 mg/L in 1967 to around 150 mg/L by the mid-1990's. However, there is an additional contamination source that has increased the dissolved solids in the ground water at well 7 as indicated by a chloride content that is about the same as the sulfate concentration. If the increased TDS were only from impact by saline Arkansas River water, the chloride values in the 1990's samples would be expected to be less than 50 mg/L rather than in the 151-168 mg/L range observed. The water from well 9 has not changed significantly since the first KDHE analysis recorded in 1964; the water has remained very fresh with a sulfate content within the range 45-66 mg/L (Figure 26). The first chemical data found for municipal well 12 indicated that the water had a very low sulfate level of 23 mg/L in 1975. The sulfate concentration increased by a small amount to 73 mg/L by 1997 in water from well 12 (Figure 26).
Ground waters from the municipal wells of Dodge City located outside the alluvial aquifer boundaries have remained fresh. For example, samples from wells 10, 13, and 16-18, had sulfate contents in the range 12-56 mg/L in 1997. Municipal well 16 is in the ambient monitoring network of KDHE. The ground water sampled from this well was very fresh (sulfate content 13-18 mg/L) during the monitoring period of 1990-1997.
Just as municipal wells 4, 6, and 8 of Dodge City have shown recent increases in water salinity, so have a few of the wells in the water-quality sampling network of GMD3. For example, the sulfate concentration of water from an irrigation well (Sec. 36, T. 27 S., R. 22 W.) in the alluvial aquifer rose from 198 mg/L in 1989 to 644 mg/L in 2000. The well is located north of the Arkansas River and several miles east of Ford. Water from a 140 ft deep irrigation well (Sec. 36, T. 26 S., R. 26 W.) in the High Plains aquifer increased in sulfate content from 138 to 431 mg/L during 1990-1997. The well is located less than a mile south of the Arkansas River within the extent of the alluvial aquifer in western Ford County.
KDHE data also indicate recent substantial increases in the salinity of some ground waters used for public water supply from the High Plains aquifer underlying the Arkansas River alluvium in the Dodge City to Fort Dodge area. The supply wells are typically completed in the High Plains aquifer and are usually sealed through the shallow alluvial aquifer. The sulfate concentration increased in two wells (174 to 265 mg/L and 174 to 432 mg/L) supplying water to a trailer court in Sec. 5, T. 27 S., R. 24 W during 1995-1997. The sulfate content rose from 169 mg/L in 1989, to 391 mg/L in 1995, and to 533 mg/L in 1997 in well water supplying a school in Sec. 3, T. 27 S., R. 24 W.
The substantial increase in sulfate levels in water from municipal wells 3, 4, and 8 in Dodge City, as well as in other well waters in Ford County from 1995 to 1997 may be partially related to the high flow in the Arkansas River during July-August, 1995 and the nearly continuous river flow from August 1996 through early 2000. Except for a couple of one or two day low flows, the Arkansas River did not flow at Dodge City between July 1988 and July 1995. There also was no river flow during most of the period between July 1976 and March 1981. After March 1981 to Jan 1986, there was almost always no flow at Dodge City. The large decrease in the salinity of water from municipal well 3 of Dodge City from 1970 to early 1995 could have resulted from recharge and ground-water flow that diluted water in the High Plains aquifer at that location during the several years while no river flow was present to seep into the alluvial aquifer and thence into the underlying High Plains sediments. The substantial flow in the summer of 1995 and after August 1996 supplied the saline water that then was able to again increase the ground-water salinity.
Increases in salinity in the ground water of the Arkansas River corridor are not generally associated with increases in the nitrate concentration because the nitrate content of the river water is low (nearly always less than 3 mg/L as nitrate-nitrogen). However, nitrate and sulfate levels change in the same direction in waters from some irrigation wells, especially those with fluctuating salinity. These changes are probably associated with the down borehole movement of shallow ground waters high in nitrate content from leaching of fertilizer in areas of the alluvial aquifer with saline water or where Arkansas River water is used for irrigation. The movement down the gravel pack of irrigation wells was described earlier in the section on vertical distribution of salinity.
High nitrate concentrations from surface sources contaminated some ground waters in the river corridor as long ago as the 1930's as indicated by analyses in Latta (1944), McLaughlin (1943), and Waite (1942). Some of this contamination was probably also related to well construction that allowed the movement of high nitrate water from the surface, soil, or shallow sediments along the annular space to the screened interval of the well. This avenue may be responsible for some of the fresh ground waters from irrigation wells that vary in nitrate content. Nitrate concentrations in domestic and municipal wells that are sealed through the upper aquifer generally are lower than in irrigation wells. The nitrate contents in these domestic and public supply waters tend not to fluctuate as much as in many irrigation wells.
Although both increases and decreases in nitrate concentrations have occurred within the last couple of decades in ground waters of the Arkansas River corridor, the general trend is an increase. For example, analyses in the GMD3 network data show more increases than decreases in nitrate content. Nitrate levels were also found to increase in samples from most irrigation wells in the Arkansas River corridor that were sampled in 1975 and 1994. The 1975 sampling was a part of the 1974-1980 KGS study of irrigation water quality in the High Plains aquifer. The 1994 sampling was conducted during preparation for the Upper Arkansas River Corridor Study. The KDA assisted the KGS in locating and sampling 17 wells that were the same as or very close to irrigation wells that had been previously sampled by the KGS in 1975 in the river valley in Hamilton, Kearny, Finney, and Gray counties. Fourteen of the 1975 wells were resampled; 3 other wells were sampled that were located very close to the 1975 wells because the original well could not be sampled. Figure 27 graphically compares the nitrate concentrations for the two sampling years. The nitrate concentrations in ground waters sampled in 1994 are plotted versus nitrate for water from the same irrigation well or a well very close to the irrigation well sampled in 1975. Of the 17 well waters collected, the nitrate content increased in 13 and decreased in only 3 samples. One well water contained essentially the same nitrate content in 1994 as in 1975. One of the well waters collected in 1994 was at the maximum contaminant limit for drinking waters and another contained nitrate appreciably greater than the standard of 10 mg/L nitrate-nitrogen. In contrast, the greatest nitrate-nitrogen content in 1975 was about 7 mg/L. The magnitude of the average nitrate increase in the well waters was larger than the average decrease.
Figure 27--Changes in nitrate concentration in waters from irrigation wells sampled in 1975 and 1995 in the Arkansas River valley in Hamilton, Kearny, Finney, and Gray counties. The nitrate concentrations in ground waters sampled in 1994 are plotted versus nitrate for water from the same irrigation well or a well very close to the irrigation well sampled in 1975. The diagonal dashed line represents the condition in which concentrations were the same for 1994 and 1975. Points above the dashed line indicate an increase in nitrate during the period; points below the line a decrease for the same period.
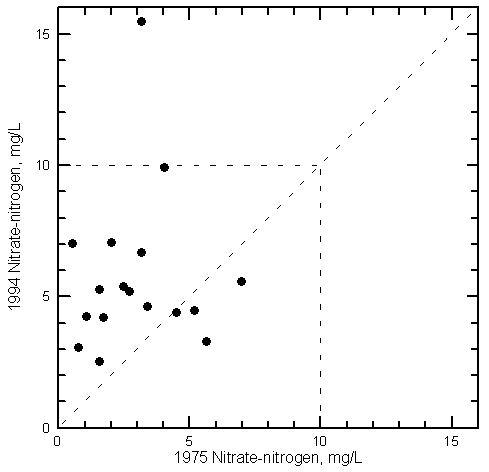
The data examined for the river corridor study allow estimation of the original ground-water quality in the region before the start of ditch irrigation and pumping of high capacity wells in Colorado and Kansas. The Arkansas River in southwest Kansas was a gaining stream during most periods through all the 5 counties of the study area. Ground water flowed from the alluvial aquifer underlying the sand dunes south of the river in Hamilton and western Kearny counties to the Quaternary alluvium and then discharged to the river. The quality of this discharge was very fresh as indicated by current fresh ground waters in most of this area. Intermittent runoff and a small amount of ground-water flow from the uplands entered the river valley along the north side of the valley in Hamilton and western Kearny counties. Overall, this water would also have been fresh, although the TDS concentrations were probably greater than the discharge from the alluvium under the sand hills because the Cretaceous bedrock is exposed along parts of and underlies the shallow ground-water system to the north of the river valley.
Before the start of development in the late 1800's, the Dakota aquifer was artesian along the Arkansas River valley from southeastern Colorado into western Hamilton County. The Dakota aquifer probably discharged a very small amount of water to the river valley in western Hamilton County. Ground water in the Dakota aquifer underlying the Arkansas River valley in eastern Colorado and southwestern Kansas is fresh (less than 1,000 mg/L TDS) but contains higher sulfate concentrations (usually 50-300 mg/L) in comparison with the water in the alluvium underlying the sand dunes (Macfarlane et al, 1994, 1998). From eastern Hamilton County to Ford County, the High Plains aquifer recharges (moves down into) the Dakota aquifer, therefore, water quality in the Dakota aquifer would not affect that in the High Plains aquifer. This also indicates that water does not come up into the High Plains aquifer from underlying bedrock along the Bear Creek fault in southern Kearny County. In general, the mix of different discharge sources to the Quaternary alluvial aquifer in Hamilton and western Kearny counties is expected to have been fresh before anthropogenic development of surface and ground-water resources.
Ground water in the High Plains aquifer is expected to have been fresh (less than 1,000 mg/L TDS content) throughout the entire corridor of the upper Arkansas River before the late 1800's. However, the TDS concentration was generally greater north of the Arkansas River in eastern Kearny, northern Finney, and northwest Gray counties than south of the river. The Scott-Finney depression or basin extends from southern Scott County to the Arkansas River valley (Latta, 1944). The approximate location of the basin is along R. 33 W. and the western half of R. 32 W. Runoff from the sides of the basin, primarily from the west, entered the depression and resided temporarily in playas before recharging the underlying aquifer. Evapotranspiration concentrated dissolved solids in the runoff that entered the shallow playas or soils before infiltrating to the ground water. Over thousands of years, the TDS content of the ground water in the High Plains aquifer in the center of the basin rose because of this process. The highest TDS concentrations (around 2,000 mg/L) are in ground waters in part of Scott County. In Finney County, the highest TDS (just over 1,000 mg/L) and sulfate concentrations (around 500 mg/L) attributable to natural causes are just south of the Scott County line. The ground waters of the High Plains aquifer were fresher to the west and east of the depression and became fresher from the Scott County line towards the Arkansas River. For example, as described earlier, analyses for artesian wells (High Plains aquifer) at Garden City showed that the ground water had a sulfate concentration range of 59-76 mg/L (Parker, 1911). Ground waters in the High Plains aquifer within Holcomb contained sulfate levels of less than 80 mg/L based on Latta (1994) and on KDHE data (Figure 22). To the west of the Finney basin, ground waters in the High Plains aquifer at Lakin had sulfate contents of 25-35 mg/L in 1900-1902 (Parker, 1911) and at Deerfield had sulfate levels of 95-120 mg/L during 1949-1969 (Figure 21). South of the Arkansas River, the sulfate concentration of water in the High Plains aquifer appears to have been less than 50 mg/L in essentially the entire river corridor.
Ground-water flow from the High Plains aquifer entered the alluvial aquifer from eastern Kearny County through Ford County before the start of ground-water development. This flow would have kept much of the ground water in the alluvium fresh, especially near the margins of the alluvial valley. Before ditch irrigation systems were constructed in the 1870's in Colorado, the Arkansas River flowed enough during most periods to maintain shallow water tables in the alluvium near the river. The river channel was much broader and shallower than today; human impacts decreasing the river flow have caused deepening and narrowing of the channel. During extended dry periods the dissolved solids content of the shallow ground water in the floodplain would have increased because evaporation of moisture from the sediment could occur as capillary action pulled water up above the water table. Transpiration by plants growing in the floodplain also would have increased the TDS content of shallow ground water in the alluvium during dry periods. However, the plants would have been mainly grasses and bushes before the start of phreatophyte infestation (particularly salt cedar) in the early 1900's. During drought periods in the river basin in Colorado and southwest Kansas, the river stage would have fallen and some of the shallow ground water near the water table in the alluvium underlying the floodplain would have moved along curved flow lines downward and towards the river and then upwards to the river channel as discharge. This would have resulted in moving the shallow water with elevated dissolved solids deeper into the alluvium before discharging to the river.
During periods when low flow of the Arkansas River entered Kansas, the river water could have been somewhat saline. However, because the alluvial aquifer would have discharged water towards the river in the valley in southwest Kansas, the river water could not have entered most of the alluvial aquifer to increase the ground-water salinity. Water during the initial period of higher flows in the Arkansas River that resulted from rain over eastern Colorado could have been slightly saline if they flushed surface salts and saline waters to Kansas. If the river stage was higher than ground-water levels, some of the river water would have infiltrated into the alluvium. High flow events with fresh river water would have resulted in some infiltration of river water into the floodplain sediments, thereby diluting the upper part of any slightly saline water in the alluvium near the river, but also driving some of the shallow water with elevated dissolved solids deeper into the alluvium. When the high stage receded to low flows, the diluted ground water would then flow back towards the river. Heavy atmospheric precipitation also would have infiltrated to the shallow alluvial waters and caused dilution of elevated TDS concentrations in the aquifer.
Before human impacts, the combined effects of the evapotranspiration concentration of shallow ground waters during dry periods, dilution by flooding and infiltration of rainwater, and bedrock discharge would have reached a state of approximate equilibrium about which the TDS concentration in the alluvial aquifer would vary with climatic changes. Ground waters with somewhat elevated dissolved solids (greater than 500 mg/L TDS), but much lower than the levels observed today, would be expected in the alluvial aquifer below the floodplain near the river. In general, the farther the distance downstream in the Arkansas River valley, the less saline the water in the alluvium would have been because the increase in mean annual rainfall would have caused increased dilution from direct infiltration and greater ground-water discharge from the High Plains aquifer to the valley.
After irrigation started in Colorado in the 1870's, the Arkansas River flow entering Kansas was reduced in quantity and became more saline. After the 1880's, the Kansas diversions would have also decreased flow somewhat, although the amounts used in Kansas have always been substantially less than those in Colorado. The more saline river waters would not have affected the alluvial ground waters much during low flow periods except in local areas of the broad river channel, because ground-water discharge to the river from alluvium underlying higher terraces in the valley and the High Plains aquifer, where present, would have prevented movement very far away from the channel zone. However, high-flow events that flushed salinity from ditch-irrigated areas in Colorado could have resulted in water infiltrating into the shallow alluvium covered by the flood waters that was slightly saline. The greatest salinity of the river water would be expected at the beginning of the high flow just after locally heavy rainfall flushed salts from irrigated fields and saline water from return-flow ditches. In addition, the front of a flood event caused by rains or snowmelt in the Rocky Mountains or locally heavy rain could have mixed with saline low-flow to produce water with elevated dissolved solids that would have been the first water to seep into the alluvium as the river stage rose.
After ground-water use in the alluvial aquifer started near 1900, the pumping wells would produce local cones of depression in the water-level surface that could cause some of the slightly saline ground water in the shallow alluvium to migrate farther from the river. In addition, pumping from the Dakota aquifer in southeastern Colorado and far southwestern Kansas began to reduce the artesian head to levels such that today they are below the river channel. Thus, discharge of freshwater from the underlying Dakota aquifer to the river valley in western Hamilton County decreased. Continued pumping of the alluvial aquifer and later development of the High Plains aquifer caused further declines in ground-water levels. Once the water levels in the alluvium away from the river declined enough that river-water seepage became substantial, the alluvial water began to become appreciably more saline from the high TDS river water.
The saline water diverted from the Arkansas River for irrigation use in Kansas became more saline from further evapotranspiration. Some of the saline water seeped from below canals and irrigated fields to the alluvial aquifer or High Plains aquifer. The infiltrating water would have been most saline in the period before water was pumped from the alluvial or High Plains aquifer and used along with ditch water for irrigation. Some areas did not add ground water to the ditches or fields; salinity increases below these irrigated areas would be expected to be greater than where fresh ground water was used. As ground water pumped from the alluvial and High Plains aquifers became more saline from river water infiltrating from ditch irrigation and the river channel, the capacity of the ground water to dilute the saline water applied to the fields decreased. The recycling of the saline infiltration resulted in a continued increase in the salinity of the recharge below the irrigated fields. However, supplemental irrigation with ground water from the Dakota aquifer would still be able to dilute the saline river water used for irrigation.
As ground-water level declines in the High Plains aquifer became more pronounced in eastern Kearny County eastward through the study area, saline waters in the alluvial aquifer began to migrate farther from the river. Saline water infiltration from fields irrigated with river water also penetrated to greater depths into the High Plains aquifer. The migration pathway of the saline water is affected by the heterogeneity of the aquifer. Both the alluvial and High Plains aquifers contain layers and lenses of sediments of greatly differing permeability. Clayey layers slow the downward movement of saline waters but allow more lateral flow within overlying permeable sands; the saline water can perch on the less permeable zone. Such a situation appears to exist in eastern Kearny and western Finney counties near and to the north of the Arkansas River. The ground-water levels present in the alluvial aquifer near the river are now substantially higher than in the High Plains aquifer along much of the river corridor. Leakage from the alluvial aquifer has produced a ridge of higher water levels below the river valley than away from the valley. Saline water from the river and alluvial aquifer is moving downward and farther away from the river in many areas.
The salinity of Arkansas River water entering Kansas has increased substantially since the start of irrigation diversions in Colorado to the present (Whittemore, 2000). Thus, the salinity source that has elevated the TDS concentrations of ground water in the river corridor in Kansas has increased in intensity. In addition, loss of water by evapotranspiration from the heavy infestation of phreatophytes, particularly salt cedar, since the early 1900's has increased the salinity of shallow ground waters in the alluvium near the river. The average salinity of the Arkansas River in southwest Kansas prior to surface-water and ground-water development in Colorado and Kansas is expected to have decreased downstream as a result of dilution by fresh ground-water discharge. As the location in the river alluvium where substantial amounts of fresh ground-water discharge entered the valley moved farther downstream due to declining ground-water levels, the location where dilution was appreciable slowly moved farther downstream. Today, the dilution point is east of Dodge City. Thus, the river salinity at the state line now does not change significantly as the river flows through southwest Kansas. Also, increases in salinity in the alluvial aquifer caused by phreatophytes are no longer substantially diluted.
Asdescribed above, the only substantial source of salinity causing increases in the dissolved solids contents of ground-waters in the river corridor in southwest Kansas is the saline water in the Arkansas River. Evapotranspiration by phreatophytes along the river and during irrigation use further increases the salinity. The main dissolved constituents in the water are sulfate, sodium, calcium, and magnesium. Waste discharges to the Arkansas River that could affect the quality of river water seepage are effluents from municipal wastewater treatment plants, discharges from industrial operations, and stormwater runoff from cities. The sulfate content of municipal wastewater would be nearly the same as that in the source ground water used from the High Plains and Dakota aquifers. The main constituents added to the municipal water during use that could affect salinity are sodium and chloride from water-softener salt. The main industrial discharge is water used in a power plant. The salinity in the discharge is greater than the supply water due to evapotranspiration losses during cooling use but there is no significant difference expected between the mass load of the supply and discharge water. Stormwater runoff would be expected to be substantially less saline than high flows of the Arkansas River in southwest Kansas.
The largest discharge from a municipal wastewater facility in southwest Kansas is from Garden City. The effect of the treated effluent from Garden City when the Arkansas River is flowing past Garden City would be to slightly dilute the sulfate concentration and very slightly raise the chloride content during average to high flow conditions. The changes in the chloride content would generally not be detectable because they would usually be within the analytical error for chloride determination. During low river flows, the chloride content of the wastewater would be in the same range as that of the river water. The other substantial discharge of wastewater to the Arkansas River in the Garden City area is from the Sunflower Electric power plant. The effect of the power plant at low flows is to add water that would generally be similar in sulfate content to that of the river water, whereas the effect at average and higher flows would be to increase the sulfate concentration by such a small amount that it would not be detectable based on the analytical error for sulfate determination (Whittemore, 2000).
Other salinity sources that can affect local ground-water quality are agricultural, industrial, municipal, and domestic wastes seeping from the surface or near surface. Nearly all of these sources have much lower sulfate/chloride ratios than saline ground water impacted by Arkansas River water, whether from the river channel or ditch irrigation. Thus, these contamination sources can generally be distinguished from salinity increases derived from river-water seepage. Oil- and gas-field brines typically have very low sulfate/chloride ratios in Kansas. Although modern methods of handling oil and gas brines brought to the surface prevent water contamination, occasional leaks and spills could cause a local increase in the chloride content of ground water. Wastewaters from feedlots and animal processing generally have higher chloride contents than sulfate concentrations, thus making them distinguishable from river water seepage if allowed to enter ground water. Probably the largest source of high chloride wastewaters in the river corridor in southwest Kansas is the discharge from conventional water softeners that use rock salt (sodium chloride). As the hardness of ground waters has increased from contamination by river waters high in calcium and magnesium levels, more individuals have installed water softeners and the amount of salt needed in the softeners to recharge the exchange medium has risen. The saltwater discharged from the softeners increases the chloride content of both municipal and domestic wastewaters. Some of the municipal wastewaters and all of the wastewaters from homes not connected to sewer systems are disposed on or in soils. Seepage of the wastewater with elevated chloride content into ground water can be easily differentiated from the elevated salinity caused by river-water seepage because the sulfate/chloride ratio derived from rock-salt dissolution is very low.
An example of a ground water impacted by a mixture of river water and an anthropogenic wastewater source is the ground water from sand hills well 6 in the public supply system of Garden City. As described earlier in the section on salinity variation in Finney County, the salinity of water pumped from sand hills wells 5 and 6 has increased substantially. The sulfate/chloride mass ratio (10.3) for the latest sample (sulfate 744 mg/L, chloride 72.1 mg/L) from sand hills well 5 is within the range expected for saline ground impacted by Arkansas River water. The sulfate/chloride ratio (2.42) in the latest sample (sulfate 319 mg/L, chloride 132 mg/L) from well 6 is significantly below the range expected and indicates that there is an additional chloride source contaminating the well water. In comparison, the sulfate/chloride ratio is 10.7 for a recent sample from municipal well 3 of Holcomb with a similar sulfate content (341 mg/L), but a substantially lower chloride concentration (31.9 mg/L) than that from sand hills well 5. Another example of a ground water impacted by an additional salinity source as indicated by a low sulfate/chloride ratio is a public-supply water of an industry near Fort Dodge in Ford County (sulfate 726 mg/L, chloride 254 mg/L, sulfate/chloride ratio 2.86 based on KDHE data for a 1989 sample from Sec. 4, T. 27 S., R. 24 W.). Still another instance is an irrigation well water from the High Plains aquifer just south of the alluvial aquifer southeast of Garden City in Finney County (sulfate 791 mg/L, chloride 411 mg/L, sulfate/chloride ratio 1.92 based on GMD3 data for a 2000 sample from Sec. 1, T. 25 S., R. 32 W.).
Selected chemical properties and concentrations of dissolved solids and several constituents in the ground water in southwest Kansas exceed standards or guidelines for drinking and some agricultural and industrial uses. There are two types of standards for drinking water. The maximum contaminant level (MCL) is a primary drinking water standard that is enforceable by law for public water supplies, whereas a maximum recommended or secondary standard is an unenforceable state or federal guideline. Other properties such as hardness are also of interest for evaluating a water for public supply or domestic use.
The maximum TDS concentration recommended by the US EPA for drinking water is 500 mg/L if alternative fresher supplies are available. Many surface and ground waters in Kansas contain over this amount and many supplies of municipal water exceed the recommended standard for dissolved solids. In general, supplies with greater than 1,500 mg/L TDS are not used for drinking in Kansas. A ground water in the Arkansas River corridor with 1,500 mg/L TDS would contain a sulfate concentration of about 750-800 mg/L.
The main constituents that affect the usability of ground water in the corridor for public supply and domestic uses are calcium, magnesium, sulfate, and nitrate. The recommended standard for drinking water is 250 mg/L sulfate. The US EPA has proposed a maximum contaminant level of 500 mg/L However, studies conducted for the US EPA indicate that adults can tolerate up to 1,200 mg/L without noticeable short-term effects. The investigators also attempted to determine the effect of high sulfate concentrations on infants but not enough individuals could be included where sulfate concentrations are high in public water supplies to produce statistically valid results. Most ground waters in the Quaternary alluvial aquifer and large areas of the High Plains aquifer in the river corridor contain a sulfate concentration that is a few times that of the recommended standard or more than twice the proposed maximum contaminant level. The chloride content of ground waters in the upper Arkansas River corridor does not exceed the recommended level of 250 mg/L for drinking waters.
A water is considered hard if the total hardness (as mg/L CaCO3) exceeds 120 mg/L and very hard if over 180 mg/L. The high calcium and magnesium contents of the river make the water extremely hard (usually over 1,000 and nearly always greater than 600 mg/L). Therefore, ground waters impacted by saline river water seepage are also extremely hard. Total hardness even exceeds 180 mg/L in most of the very fresh ground water in the High Plains aquifer that has not been affected by river water. The hardness ranges up to over 2,000 mg/L in the saline ground waters (Appendix A). Some individual homes with ground-water supplies affected by the large hardness of the river water use conventional water softeners based on ion exchange media. The use of the softeners decreases the calcium and magnesium contents and, therefore, the hardness but increases the sodium concentration in the water used as a result of the exchange for the calcium and magnesium. In addition, the wastewater discharge from the recharge of the softener exchange medium with dissolved rock salt contains high sodium and chloride concentrations. Waters in the confined portion of the Dakota aquifer north of the Arkansas River are often softer than freshwaters in the High Plains aquifer due to natural softening of the water by cation exchange of calcium and magnesium for sodium on clays in the strata.
Nitrate concentration is always relatively low (less than 3 mg/L) in Arkansas River water. However, the nitrate content of many well waters exceeds the MCL of 10 mg/L for drinking water and is over 20 mg/L in some irrigation wells in the river corridor. Uranium concentration can exceed the level of 20 µg/L proposed by the US EPA as a possible standard for drinking water in saline ground waters in the alluvium and both fresh and saline ground waters in the High Plains aquifer in the river corridor. The higher concentrations of uranium are generally found in the saline ground waters. The uranium assessment is based on analyses of samples collected from the multi-level wells installed for this study (Whitmer, 2000). The US EPA has recently proposed 5 µg/L as the maximum contaminant level for drinking water for arsenic, although they are also considering alternative higher concentrations depending on public input and further review. The dissolved arsenic concentration of ground water in the alluvial and High Plains aquifers in the river corridor is less than the 5 µg/L MCL proposed, based on recent KDHE analyses for which the analytical method used had a substantially lower quantifiable limit than 5 µg/L. Selenium concentrations are less than 30 µg/L in the ground waters in the corridor based on data of KDHE and Whitmer (2000) and are therefore less than the drinking water MCL of 50 µg/L. Greater selenium values are generally found in the alluvial ground waters with high sulfate concentration.
The sulfate concentration of ground water in most of the alluvial aquifer from the Colorado-Kansas line through western Ford County and in substantial parts of the High Plains aquifer in Kearny and Finney counties exceeds the KDHE criterion of 1,000 mg/L for water supplies for stock. The same concentration limit is included in recommendations for stock water by a national agency of Canada (Environment Canada, 1978). However, sulfate concentrations of several hundred mg/L have been found to cause problems for many young livestock.
The level of dissolved solids in the alluvial aquifer from the state line through western Ford County and in parts of the High Plains aquifer in the river corridor in Kearny and Finney counties is great enough to reduce yields of crops when used as irrigation water in comparison with use of freshwater. The salinity hazard for field crops is high to very high, depending on the soil type and the dissolved solids content, for most of the alluvial ground water. The salinity hazard of waters in the High Plains aquifer range from low to very high. These assessments are based on information of the U.S. Department of Agriculture in Hem (1985) and Kansas State University (Jacobs and Whitney, 1975). However, most of the studies of salinity hazards to crops are based on irrigation waters high in chloride or high in both chloride and sulfate concentrations. Studies being conducted elsewhere in the U.S. on the impact of high sulfate waters used for irrigation will allow better assessment of the salinity hazard of Arkansas River waters.
The sodium hazard to soils for irrigation water is evaluated based on the sodium adsorption ratio (SAR) or the soluble sodium percentage in the water (SSP). High SAR and SSP values in an irrigation water can result in reduction of the soil permeability. The more clay content in the soil and the higher the salinity of the irrigation water, the greater the sodium hazard of a particular SAR or SSP. The saline ground waters in the alluvial and High Plains aquifers with greater than 2,500 mg/L TDS concentration generally have a sodium hazard that is medium for loamy and clayey soils based on figures in Jacobs and Whitney (1975). The TDS content must be greater than about 3,000 mg/L before the sodium hazard is medium for sandy soils and high for clayey soils. SAR and SSP values for the KGS analyses of ground water are listed in Appendix A.
Other constituents that have concentrations that can exceed levels recommended by the KDHE for irrigation use are fluoride, boron, and selenium. The fluoride content of some fresh and saline ground waters in the High Plains aquifer of the river corridor exceeds the maximum recommended level of 1.0 mg/L. Only the most saline ground waters have a boron concentration over the maximum recommended level of 0.75 mg/L. These ground waters are generally found only in the alluvial aquifer in Hamilton and western Kearny counties. Selenium concentrations exceed the 20 µg/L level recommended for irrigation in some saline ground waters in the river corridor (Whitmer, 2000).
Coe, D.K., 1998, Groundwater Quality: Southwest Kansas Groundwater Management District, Garden City, KS, 29 p.
Hathaway, L.R., Carr, B.L., Galle, O.K., Magnuson, L.M., Waugh, T.C., and Dickey, H.P., 1977, Chemical quality of irrigation waters in Hamilton, Kearny, Finney and northern Gray counties: Kansas Geological Survey, Chemical Quality Series 4, 33 p. [available online]
Hathaway, L.R., Carr, B.L., Flanagan, M.A., Galle, O.K., Waugh, T.C., Dickey, H.P., and Magnuson, L.M., 1978a, Chemical quality of irrigation waters in southwestern Kansas: Kansas Geological Survey, Chemical Quality Series 6, 35 p. [available online]
Hathaway, L.R., Galle, O.K., Waugh, T.C., and Dickey, H.P., 1978b, Chemical quality of irrigation waters in Ford County and the Great Bend Prairie of Kansas: Kansas Geological Survey, Chemical Quality Series 7, 41 p. [available online]
Hem, J.D., 1985, Study and interpretation of the chemical characteristics of natural waters, 3rd edition: U.S. Geological Survey, Water-Supply Paper 2254. [available online]
Jacobs, H.S., and Whitney, D.A., Determining water quality for irrigation: Cooperative Extension Service Report C-396, Kansas State University, Manhattan, KS, 8 p.
Kansas Department of Health and Environment, 1995, Extended site inspection, Garden City public water supply well #10, Garden City, Kansas: KDHE, Topeka, KS.
Kansas Department of Health and Environment, 1996, Extended site inspection, Garden City public water supply well #18, Garden City, Kansas: KDHE, Topeka, KS.
Latta, B.F., 1944, Geology and ground-water resources of Finney and Gray counties, Kansas, with analyses by E.O. Holmes: Kansas Geological Survey, Bulletin 55, 272 p. [available online]
Macfarlane, P.A., Whittemore, D.O., Doveton, J.H., Chu, T., Smith, M., Feldman, H., Myers, N.C., and Gillespie, J.B., 1994, The Dakota Aquifer Program: Annual Report, FY93: Kansas Geological Survey, Open-File Report 94-1, 115 p. [available online]
Macfarlane, P.A., Doveton, J.H., and Whittemore, D.O., 1998, User's guide to the Dakota aquifer in Kansas: Kansas Geological Survey, Technical Series 2, 56 p. [available online]
McLaughlin, T.G., 1943, Geology and ground-water resources of Hamilton and Kearny counties, Kansas, with analyses by E.O. Holmes: Kansas Geological Survey, Bulletin 49, 220 p. [available online]
Meyer, W.R., Gutentag, E.D., and Lobmeyer, D.H., 1969, Finney County basic data: U.S. Geological Survey, Open-File Rept., 146 p. [available online]
Meyer, W.R., Gutentag, E.D., and Lobmeyer, D.H., 1970, Geohydrology of Finney County, southwestern Kansas: U.S. Geological Survey, Water-Supply Paper 1891, 117 p. [available online]
Parker, H.N., 1911, Quality of the water supplies of Kansas: U.S. Geological Survey, Water-Supply Paper 273, 375 p. [available online]
Stramel, G.J., Lane, C.W., and Hodson, W.G., 1958, Geology and ground-water hydrology of the Ingalls area, Kansas: Kansas Geological Survey, Bulletin 132, 154 p. [available online]
Townsend, M.A. and Young, D.P., 1999, Nitrate in Kansas ground water: Kansas Geological Survey, Public Information Circular no. 14, 4 p. [available online]
Waite, H.A., 1942, Geology and ground-water resources of Ford County, Kansas, with analyses by R.H. Hess: Kansas Geological Survey, Bulletin 43, 250 p. [available online]
Whittemore, D.O., 2000, Water quality of the Arkansas River in southwest Kansas: Kansas Geological Survey, Open-File Report 2000-44, 85 p., for Kansas Water Office. [available online]
Whittemore, D.O., and Butler, J.J., Jr., 1997a, Invasion of saline water along the Arkansas River: Hydrogram, Kansas Water Office, Topeka, KS, Spring issue, p. 11.
Whittemore, D.O., and Butler, J.J., Jr., 1997b, Invasion of saline water along the Arkansas River: Kansas Geological Survey, Open-File Report 97-41, 5 p.
Whittemore, D.O., Young, D.P., and Healey, J.M., 2000, Multi-level observation well sites of the Upper Arkansas River Corridor Study: Kansas Geological Survey, Open-File Report 2000-42, 59 p., prepared for Kansas Water Office. [available online]
Whittemore, D.O., and Schloss, J., 2000, Sulfate concentration in the alluvial and High Plains aquifers, upper Arkansas River corridor, southwest Kansas: Kansas Geological Survey, Open-File Report 2000-72, 4 map plates. [available online]
Whitmer, J., 2000, Fate and transport of selenium and uranium in the upper Arkansas River valley of southwestern Kansas: M.S. thesis, University of Kansas, Lawrence, KS
Chemical Properties and Concentrations of Dissolved Constituents in Ground Waters Collected and Analyzed by the Kansas Geological Survey as Part of the Upper Arkansas River Corridor Study. The appendix data are split into two parts due to the number of columns. Data are ordered by county, then location within the county, and by date. The location quarters are in the USGS format, in which the quarters decrease in size from left to right. Quarter A equals NE, B represents NW, C indicates SW, and D is for SE.
Concentrations of Sulfate and Chloride for Ground Waters in the Upper Arkansas River Corridor Used in the Generation of the Sulfate Distribution Map for the Quaternary Alluvial Aquifer. The data were selected as appropriate for representing the recent sulfate concentration in the aquifer. Data are ordered by county and then by location within the county. The location quarters are in the USGS format, in which the quarters decrease in size from left to right. Quarter A equals NE, B represents NW, C indicates SW, and D is for SE.
Concentrations of Sulfate and Chloride for Ground Waters in the Upper Arkansas River Corridor Used in the Generation of the Sulfate Distribution Map for the High Plains Aquifer and the Alluvial Aquifer Underlying the Sand Dunes in the Alluvial Trough in Hamilton and Western Kearny Counties. The data were selected as appropriate for representing the recent sulfate concentration in the aquifer. Data are ordered by county and then by location within the county. The location quarters are in the USGS format, in which the quarters decrease in size from left to right. Quarter A equals NE, B represents NW, C indicates SW, and D is for SE.
Kansas Geological Survey
Placed online December 18, 2007
Comments to webadmin@kgs.ku.edu
The URL for this page is http://www.kgs.ku.edu/Hydro/UARC/GWQualrep.htm