J. A. Schloss, R. W. Buddemeier
Definition: Saturated thickness is the vertical thickness of the hydrogeologically defined aquifer in which the pore spaces are filled (saturated) with water. Change in saturated thickness is the difference between the values of saturated thickness at two different times. It can be used to describe change at a particular place, but is more commonly used to describe average changes over a region of the aquifer. The change may be expressed as as an absolute amount (e.g., "the saturated thickness in this region has decreased by a total of 50 feet") or as fraction or relative amount (e.g., "the saturated thickness is 25% of the predevelopment value"). It can be described as a single total value (feet or percent) or as a rate (e.g., "the water table elevation [and therefore the saturated thickness] is declining by and average of 0.5 foot per year"). This section address both the absolute (feet) and relative (percent) changes in High Plains aquifer saturated thickness from the Predevelopment distribution to the Present (1997-99) Saturated Thickness.Boldface items are linked to other sections; italic items are linked to glossary definitions
Relevance to understanding water resources: Saturated thickness is a key link between the measurements that can readily be made (of changes in water-table elevation) and the changes in resources available for use. The saturated thickness times the surface area times the specific yield is equal to the volume of potentially extractable water beneath a given area of land surface -- for example, if the saturated thickness below an acre of ground is 100' and has a specific yield of 10%, the potential extractable water would be 10 acre-feet (AF). Specific yield is difficult to determine with accuracy and precision, but it commonly varies from place to place by not much more than a factor of two, and can be assumed to be constant over time. Change in saturated thickness is therefore often used as an indicator of trends in available groundwater resources and trends in past water use.
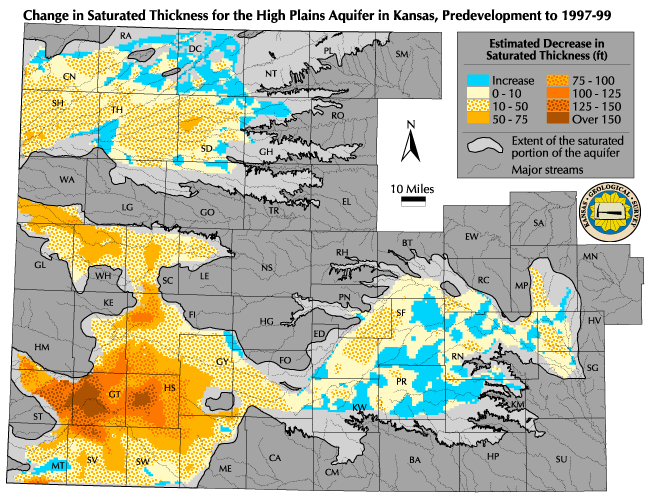
![]() Map of Change in Saturated Thickness (in feet )
Map of Change in Saturated Thickness (in feet ) ![]() Map of Change in Saturated Thickness (as a percent)
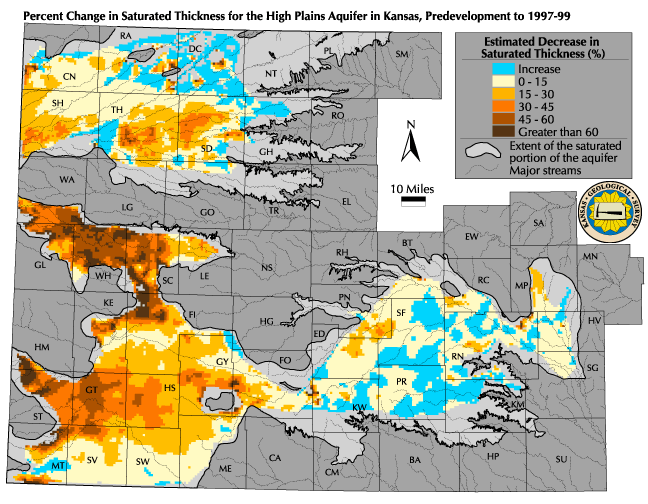
Map of Change in Saturated Thickness (as a percent)
Discussion: Two maps are presented: the first map shows differences in feet between the Predevelopment and the Current saturated thickness estimates for the High Plains aquifer at the center of every legal section (approximately every square mile). The second map shows the changes as a percentage of the predevelopment value. Because both predevelopment and current values are required to calculate change, these maps have missing data zones where either of the components are currently lacking. The absence of data does not mean either the absence of water or the absence of change -- simply that we do not have a satisfactory basis for making the calculation.
The classification ranges portray the range of values and the probable magnitude of their significance (see Qualifications section). The results are grouped to indicate regional average values, and cannot be used to make site-specific determinations about changes in the groundwater resource. Because of measurement uncertainties (see drawdown appendix) and natural variations in saturated thickness (see saturated thickness appendix), long-term increases or decreases of a few feet are within the envelope of uncertainty, and should not be treated as significantly different from zero. Although the total area showing an increase in saturated thickness is visually impressive, almost all of these areas are either marginal fringe areas of less than 50 feet of saturated thickness, in the lowest category of Authorized Quantity, in regions of poor Water Quality, or some combination. The increases therefore represent more or less natural variations in unstressed portions of the aquifer, and in most areas do not reflect an actual increase in water available for use under current conditions.
The results show that the absolute changes have been the greatest in southwestern Kansas, but because of the large volume of water originally present, the percent changes in that area are not proportionately large. For areas that had marginal saturated thickness to start with, percent change based on the total predevelopment saturated thickness may be somewhat misleading. If something close to 50 feet of saturated thickness is required to support high-volume pumping, and the original saturated thickness was less than 100', then a 50% change in the original total could actually represent 100% of the water available for high volume pumping. The changes, relative and absolute, need to be interpreted in the light of the predevelopment and present saturated thicknesses.
In addition to affecting the Availability and Accessibility of groundwater, changes in saturated thickness have an impact on stream flow. Groundwater discharge makes up a component of the baseflow in the perennial streams and rivers of western and central Kansas. When the water table falls below the stream channel so that discharge no longer occurs, the stream changes from perennial to intermittent, with resulting changes in the availability of surface water and the nature of the stream and riparian ecosystems (see section on Surface Water).
Sources and methods: Saturated thickness estimates are based on point measurements of the bedrock elevation and of the water table surface. The change in saturated thickness is simply the difference in elevation between two calculated water table surfaces -- the bedrock is the same for both, and therefore disappears from the calculation. The values subtracted to determine change are those described in the sections on Predevelopment and Current saturated thickness.
Qualifications (uncertainties, data needs, etc.): As with all maps in this atlas, this presentation is designed to provide general information only and is not intended to be used for regulatory or management purposes, or to replace or invalidate maps that have been adopted for those purposes. The change in saturated thickness is a calculated difference between two water table elevations that both have some inherent uncertainty; their difference will therefore necessarily have uncertainties of its own. Readers should consult the qualifications sections of the entries for predevelopment and current saturated thickness. As is generally the case, larger absolute changes (tens or hundreds of feet) are more likely to be relatively accurate estimates than small differences.
An important consideration in understanding long-term changes (such as predevelopment to present -- approximately half a century) is the recognition that the rate of change is not constant over time. The appendix on decline rates plots the rates of change, by decade, for the Ogallala aquifer portion of the High Plains and for various subdivisions. It shows that the rate of water-level decline was substantially higher in the 1970's than in the 1980's and 1990's, but that the changes in rate occurred at different times in different areas. The change since predevelopment is a useful record of historic human impact on the aquifer, but not a particularly good basis for predicting the future. For that, more recent trends are probably more valid than the total long-term change (see Estimated Usable Lifetime).
See also: Water in Storage, Predevelopment Saturated Thickness, Current Saturated Thickness.
Next section: Water in Storage
Back to Directory
Funded (in part) by the Kansas Water Plan Fund