![]()
Prev Page--Ground water || Next Page--Quality and Water Law
Hydrology
The hydrology of an area primarily involves precipitation and runoff. A statistical approach to the hydrology was used in this study because of the wide variations in magnitude with respect to time. Although insufficient time has passed for collecting a complete set of data, the period of record is long enough to permit a reasonable estimate of hydrologic behavior.
Precipitation
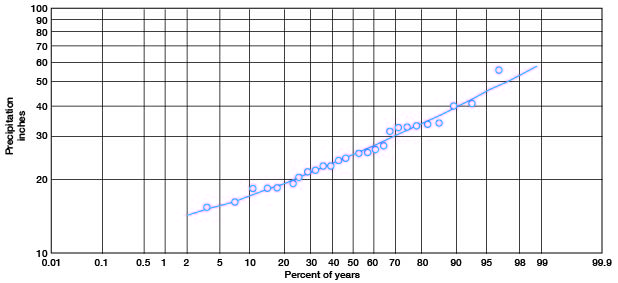
Data on precipitation are collected and published by the U. S. Weather Bureau. A graph of annual precipitation at Minneapolis from 1931 through 1957 is shown in Figure 16. The extremes are widely separated, ranging from 15.36 inches in 1934 to 54.89 inches in 1951. Monthly extremes and average monthly precipitation are shown in Figure 17. From the same period of record (1931-57), a frequency curve was constructed (Fig. 18) on logarithmic-probability paper. The frequency curve indicates that during 1 year in 10, Minneapolis has had about 40 inches of precipitation, and conversely, that during 1 year in 10, Minneapolis has had about 17 inches of precipitation. The data, although of relatively short duration, are sufficient to give a reasonable frequency distribution. The frequencies were computed by the Kimball method using the equation
F = (m / n+1) 100
where n is the total number of items, m is the order number, and F is the percentage of years during which the precipitation is equal to, or greater than, the precipitation of order number m (Kimball, 1946).
Figure 16--Annual precipitation at Minneapolis, 1931-1957.
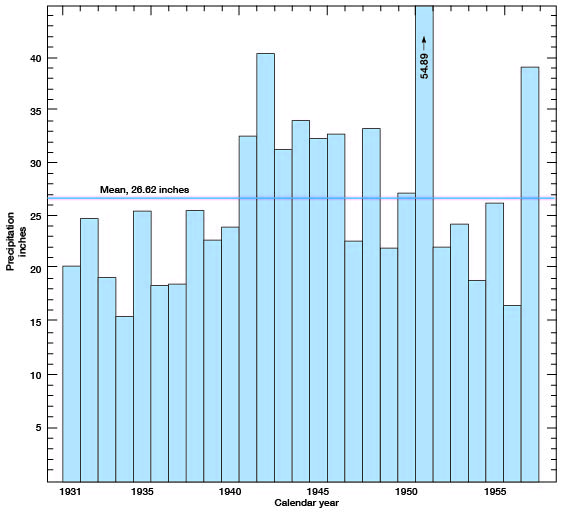
Figure 17--Monthly extremes and mean precipitation at Minneapolis, 1931-1957.
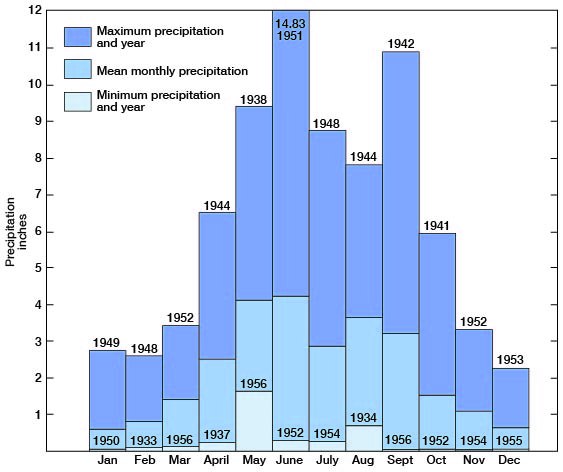
Figure 18--Annual precipitation frequency curve at Minneapolis showing percentage of years in which precipitation is less than given amount.
Runoff
Two surface-water gaging stations are operated in Ottawa County by the U. S. Geological Survey in co-operation with the Kansas State Board of Agriculture and the Board of Water Resources. One station is in the NW sec. 31, T. 12 S., R. 1 W., on the downstream side of the left pier of the county highway bridge across Solomon River, 3/4 mile west of Niles. The other station is in the SE sec. 16, T. 12 S., R. 5 W., on the downstream side of the left pier of the highway bridge across Saline River, 1/2 mile south of Tescott. All records are published in the U. S. Geological Survey Water-Supply Papers. Records are available for the Niles station from May 1897 to November 1903 and from October 1917 to the present. Records are available for the Tescott station from September 1919 to the present. The duration curves for daily flows and low-flow frequency curves were obtained from reports published by the Kansas Water Resources Board (Furness, 1959, 1960).
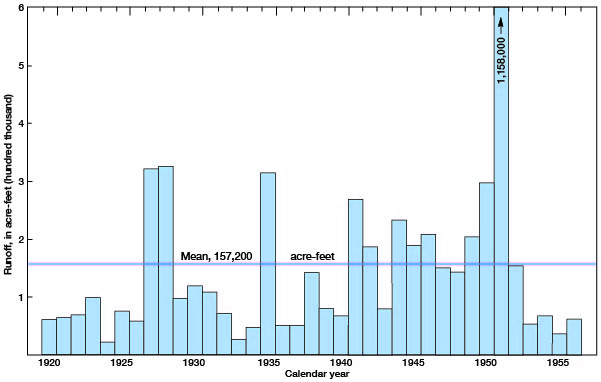
The annual runoff in acre-feet is shown for Solomon River (Fig. 19) in calendar years from 1918 to 1956 and for Saline River (Fig. 20) from 1920 to 1956. The mean annual discharge is 431,100 acre-feet in the Solomon and 157,200 acre-feet in the Saline. These hydrographs have the same general pattern as the precipitation graph (Fig. 16) but differ in detail. Precipitation was measured at one point, Minneapolis, whereas river discharge is a reflection of precipitation throughout the entire drainage area, which is 6,770 square miles for the Solomon and 2,820 square miles for the Saline. Evapotranspiration and ground-water recharge also partly account for the difference.
Figure 19--Annual runoff of Solomon River near Niles, in acre-feet.
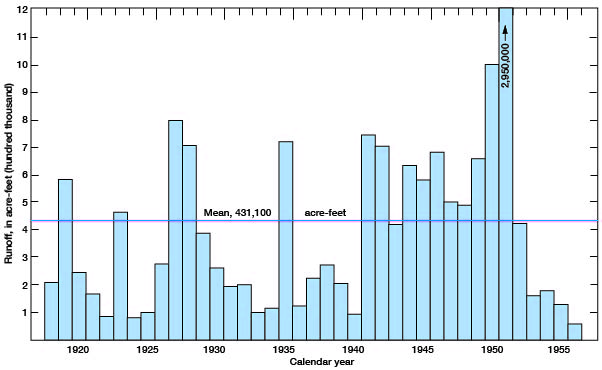
Figure 20--Annual runoff of Saline River near Tescott, in acre-feet.
The duration curve for daily flow in Solomon River during the base period 1921-56 is shown in Figure 21. This duration curve shows what percentage of time a given discharge was equaled or exceeded. For example, during 90 percent of the period 1921-56 the discharge was equal to or greater than 0.006 cfs per square mile, during 50 percent of the period the discharge was equal to or greater than 0.024 cfs per square mile, and during 10 percent of the period the discharge was equal to or greater than 0.16 cfs per square mile. The arithmetic mean flow of 0.088 cfs occurs only approximately 16 percent of the time. The wide departure between mean and median flows is caused by short periods of flooding. The ratio between median flow (0.024 cfs) and mean daily flow (0.088 cfs) is approximately 0.27, or 27 percent. On a daily basis, only about one-fourth of the mean daily flow is discharged.
Figure 21--Duration curve for daily flows of Solomon River near Niles under natural conditions prior to operation of reservoirs upstream (total drainage area, 6,770 square miles). (From Furness, 1959, fig. 52.)
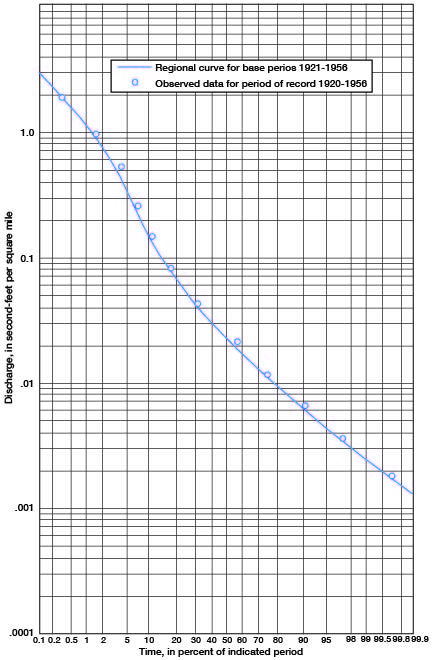
The duration curve for daily flow in Saline River during the base period 1921-56 is shown in Figure 22. The drainage area of Saline River is only 42 percent as large as the drainage area of Solomon River. The median daily flow of the Saline is 0.02 cfs per square mile. The mean daily flow is 0.077 cfs per square mile and occurs approximately 15 percent of the time. The ratio between the median and mean daily flow is 0.27, or 27 percent. Close agreement between Saline and Solomon hydrologic characteristics shows similarity in geologic, climatic, and vegetative control of runoff.
Figure 22--Duration curve for daily flows of Saline River near Tescott (total drainage area, 2,820 square miles). (From Furness, 1959, fig. 44.)
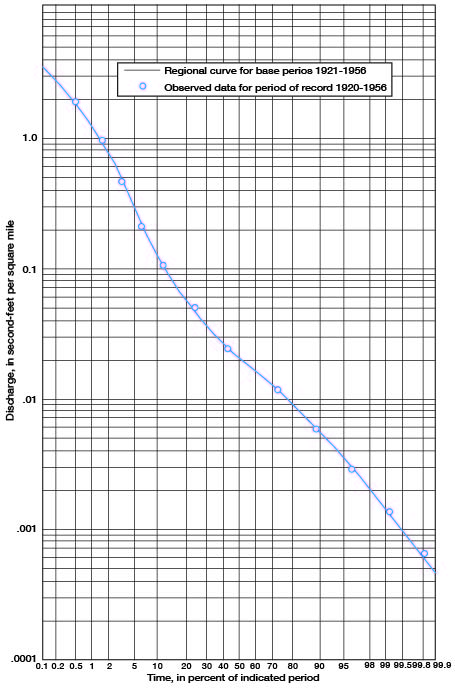
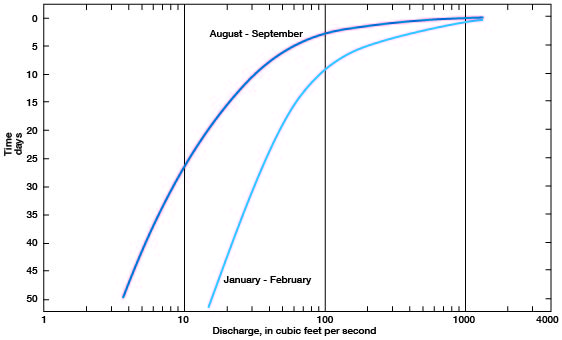
Figure 23--Base-flow recession curves for Solomon River near Niles.
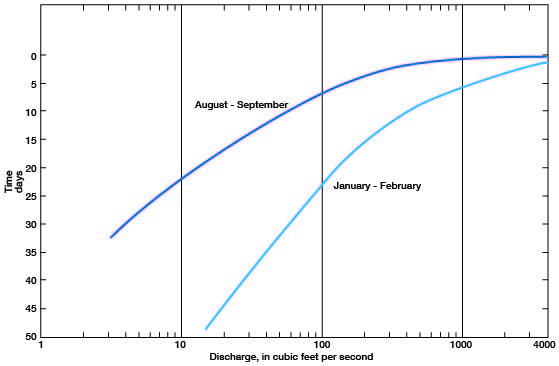
Figure 24--Base-flow recession curves for Saline River near Tescott.
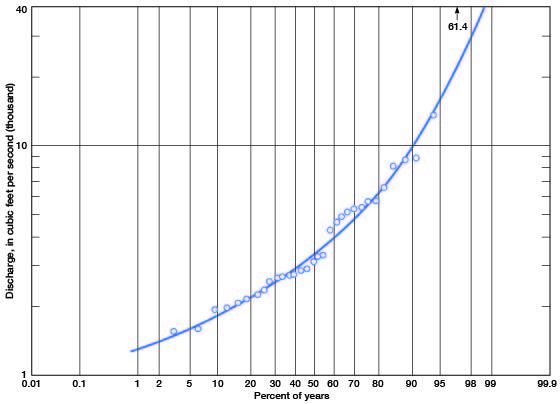
The low-flow frequency curves show the recurrence interval in years that a given period of low flow, in cubic feet per second, would be expected. Low-flow frequency curves are shown for Solomon River (Fig. 25) and Saline River (Fig. 26). Flood data for momentary peak discharges are plotted for Solomon River (Fig. 27) and Saline River (Fig. 28). Flood-frequency data for Kansas streams are given by Ellis and Edelen (1960). These graphs show the percentage of years in which a flood will be less than the given amount. Only discharges greater than 3,800 cfs for the Solomon and 1,300 cfs for the Saline were used. Only one flood per year was used. The number of floods plotted was 34 for the Solomon and 32 for the Saline. The Kimball method, previously described, was used in plotting the frequencies. The magnitude of the 1951 flood was so great compared to the size of other floods that it does not fall near the curve. If there were another 70 or 80 years of record, the data should be sufficiently spread to include the 1951 flood on the curve.
Figure 25--Low-flow frequency curves for Solomon River near Niles (total drainage area, 6,770 square miles). (From Furness, 1960, fig. 52.)
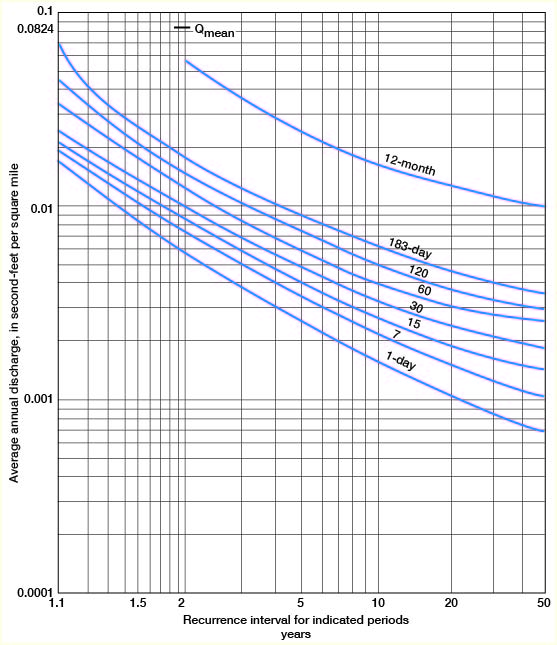
Figure 26--Low-flow frequency curves for Saline River near Tescott (total drainage area, 2,820 square miles). (From Furness, 1960, fig. 44.)
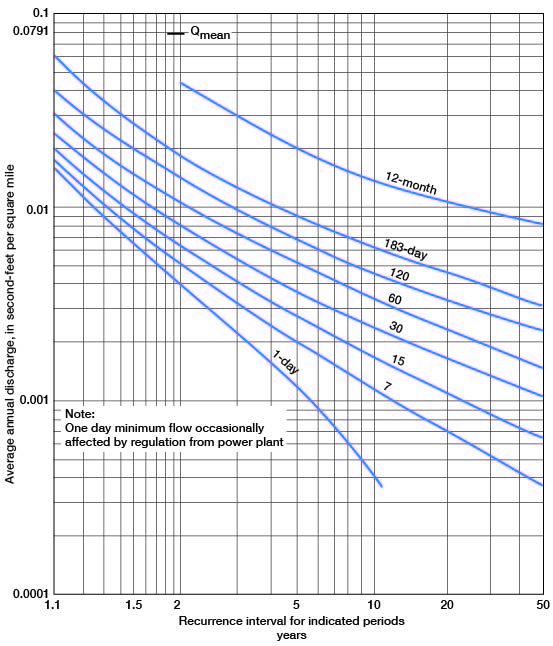
Figure 27--Peak annual discharge frequency curve for Solomon River near Niles.
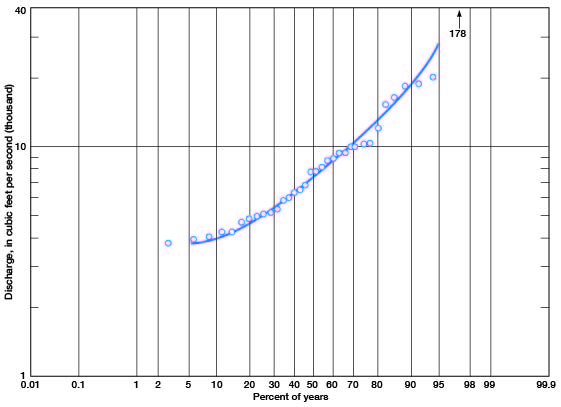
Figure 28--Peak annual discharge frequency curve for Saline River near Tescott.
Prev Page--Ground water || Next Page--Quality and Water Law
Kansas Geological Survey, Geology
Placed on web March 23, 2009; originally published January, 1962.
Comments to webadmin@kgs.ku.edu
The URL for this page is http://www.kgs.ku.edu/General/Geology/Ottawa/07_hydro.html