![]()
Prev Page--Geomorphology || Next Page--Well Records
Ground Water
Source
The following discussion on the source and occurrence of ground water has been adapted from Meinzer (1923), to which the reader is referred for a more detailed discussion. A summary of ground-water conditions in Kansas has been made by Moore and others (1940).
Water in the pores or openings of rocks and in the zone of saturation is called ground water. The amount of ground water that is present below the surface in any region and the manner and rate of its movement to wells or springs is controlled largely by the character of the rocks.
In Lincoln County, as in other parts of the Great Plains, ground water is derived almost entirely from local precipitation in the form of rain or snow. Part of the water that falls as rain or snow is carried away by surface runoff and is lost to streams; part of it may evaporate or be absorbed by vegetation and transpired into the atmosphere. The water that escapes surface runoff, evaporation, and transpiration percolates downward through the soil and underlying strata until it reaches the water table, where it joins the body Of ground water in the zone of saturation.
Ground water moves slowly through the rocks in directions determined by the shape and slope of the water table (Pl. 2), which is controlled by the permeability and thickness of the water-bearing materials, the topography, local variations in the quantity of recharge and discharge, and the stratigraphy and structure of the geologic formations. The ground water is eventually discharged through springs or wells, through seeps into streams, or by evaporation and transpiration.
Occurrence
Most rocks that underlie the surface of the earth at depths shallow enough to be penetrated by drilling contain voids or interstices. These range in size from microscopic openings to the large caverns developed in limestones. The percentage of the volume of the open spaces or voids to the total volume of the rock is the porosity. It is desirable when considering problems of ground-water supply to know the porosity of the water-bearing materials, but the permeability of the materials controls the amount of ground water that can move through them. The permeability of a rock is its capacity for transmitting water under pressure and is determined by the size, shape, and arrangement of the openings. For example, a bed of fine silt or clay may have a relatively high porosity, but because of the size of the particles each opening is very small. As the force known as molecular attraction holds a thin layer of water on the surface of each grain, these layers of water that are not free to move may fill or almost fill the openings in such a fine-textured sediment; thus the permeability, or water-yielding capacity of the rock, is very low even though its porosity, or water-holding capacity, is quite high. Likewise, larger openings that are not connected or are poorly connected may produce a high porosity and a low permeability. Water moves most freely through a rock that has relatively large and well-connected openings. Several common types of openings or interstices and the relation of rock texture to porosity are shown in Figure 5.
Figure 5--Diagram showing several types of rock interstices and the relation of rock texture to porosity. A, Well-sorted sedimentary deposit having high porosity; B, poorly sorted sedimentary deposit having low porosity; C, well-sorted sedimentary deposit consisting of pebbles that are themselves porous, so that the deposit as a whole has a very high porosity; D, well-sorted sedimentary deposit whose porosity has been diminished by the deposition of mineral matter in the interstices; E, rock rendered porous by solution; F, rock rendered porous by fracturing. (From Meinzer, 1923, fig. 1.)
Artesian Conditions
Ground water may be said to have normal pressure, subnormal pressure, or artesian pressure. The static level of ground water under normal pressure coincides with the water table or the upper surface of the zone of saturation. Under subnormal pressure the static level is below the water table and under artesian pressure, above it. A well that flows at the land surface is known as a flowing artesian well.
Artesian or confined water exists where a water-bearing bed is overlain by an impermeable or nearly impermeable bed that dips from its recharge area toward the discharge area. Water enters the water-bearing bed at the outcrop and percolates slowly down dip to be held by the overlying confining bed. Down dip from the outcrop area, the water exerts pressure against the confining bed. In a well penetrating the water-bearing formation the water level rises above the top of the formation. This water level is called the piezometric surface. If the altitude of the land surface at the well is lower than the altitude of the outcrop or recharge area of the aquifer, the water may rise high enough to flow at the surface.
In Lincoln County some wells that tap the Dakota formation are artesian; a few of these are flowing wells. The known flowing wells are in the southern and southeastern parts of the county. In 1948 a well 96 feet deep in the NW SE sec. 28, T. 12 S., R. 7 W. flowed with sufficient artesian pressure to cause the water to rise 9 feet above the land surface.
The Water Table and Movement of Ground Water
Shape and Slope
The water table is defined as the upper surface of the zone of saturation except where that surface is formed by an impermeable body (Meinzer, 1923a, p. 32). The water table is also the boundary between the zone of saturation and the zone of aeration. It is not a level surface but is a generally sloping surface having many irregularities. These irregularities are caused by several factors. In places where the amount of recharge is exceptionally high, the water table may build up and form a mound or low ridge from which the water slowly spreads out. In material of low permeability these mounds or ridges may be pronounced, but in very permeable material they generally are small. Depressions in the water table may indicate places where ground water is discharging, usually occurring along streams that are below the normal level of the water table or in places where water is withdrawn by wells or plants.
The shape and slope of the water table in the Saline River Valley are shown on the map (Pl. 2) by means of contour lines, just as the configuration of the land surface is shown on a topographic map. Each point on the water table along a given contour line has the same altitude. The direction of ground-water movement is at right angles to these contour lines--in the down-slope direction.
Plate 2 also shows the location of wells in which the depth to water was measured, the location of test holes drilled, and the altitude of the water surface at points. along the channels of the main streams. These data were utilized in the preparation of the water-table contour map.
The contour map indicates that the water table slopes toward Saline River from both sides and that ground water is discharging into the river. Near the middle of the valley the contours trend almost at right angles to the axis of the valley, and the spacing of the contours indicates an average downstream hydraulic gradient of about 2 feet to the mile.
Relation to Topography
The depths to water level in Lincoln County are given on Plate 2. In wells that obtain water from the terrace deposits or alluvial deposits the depth to water is generally less than 30 feet; where it is more than 40 feet the water is obtained from the Dakota formation. Artesian pressures in the Dakota formation may cause water to rise relatively high with respect to the depth at which it was first found. The maximum depth to water in wells measured in this area was 249 feet. In general the shape of the water table in the areas of alluvium and terrace deposits conforms to the topography; where the Dakota is the principal aquifer, the depth to water is affected little by the topography.
Fluctuations of the Water Table
The water table does not remain in a stationary position but fluctuates much like the water level in a surface reservoir. If the inflow to the underground reservoir exceeds the draft, the water table rises. Conversely, if the draft exceeds the inflow, the water table declines. Thus, the rate and magnitude of fluctuation of the water table depend upon the rate and magnitude at which the underground reservoir is replenished or depleted.
The amount of precipitation that percolates through the soil to the water table, the amount of seepage that reaches the underground reservoir from surface streams whose channels are above the water table, and the amount of underflow from adjacent areas cause the rise of the water table in this area. These factors depend largely upon precipitation, either in this area or immediately adjacent to it.
The amount of water pumped from wells, the amount of water absorbed directly from the water table by plants (transpiration), the amount of water lost from the ground-water reservoir by evaporation, the amount of ground water entering surface streams by channel-bank seepage, and the amount of water passing beneath the surface into adjacent areas, as well as deficient precipitation, result in a decline of the water table.
Fluctuations of the water table caused by recharge and discharge are reflected by the rise and fall of water levels in wells. A group of wells was selected for observation of the character and magnitude of water-level fluctuations in this area, and periodic measurement of the water levels in them was begun in 1947. Records of these water levels are published annually by the Federal Geological Survey (Sayre and others).
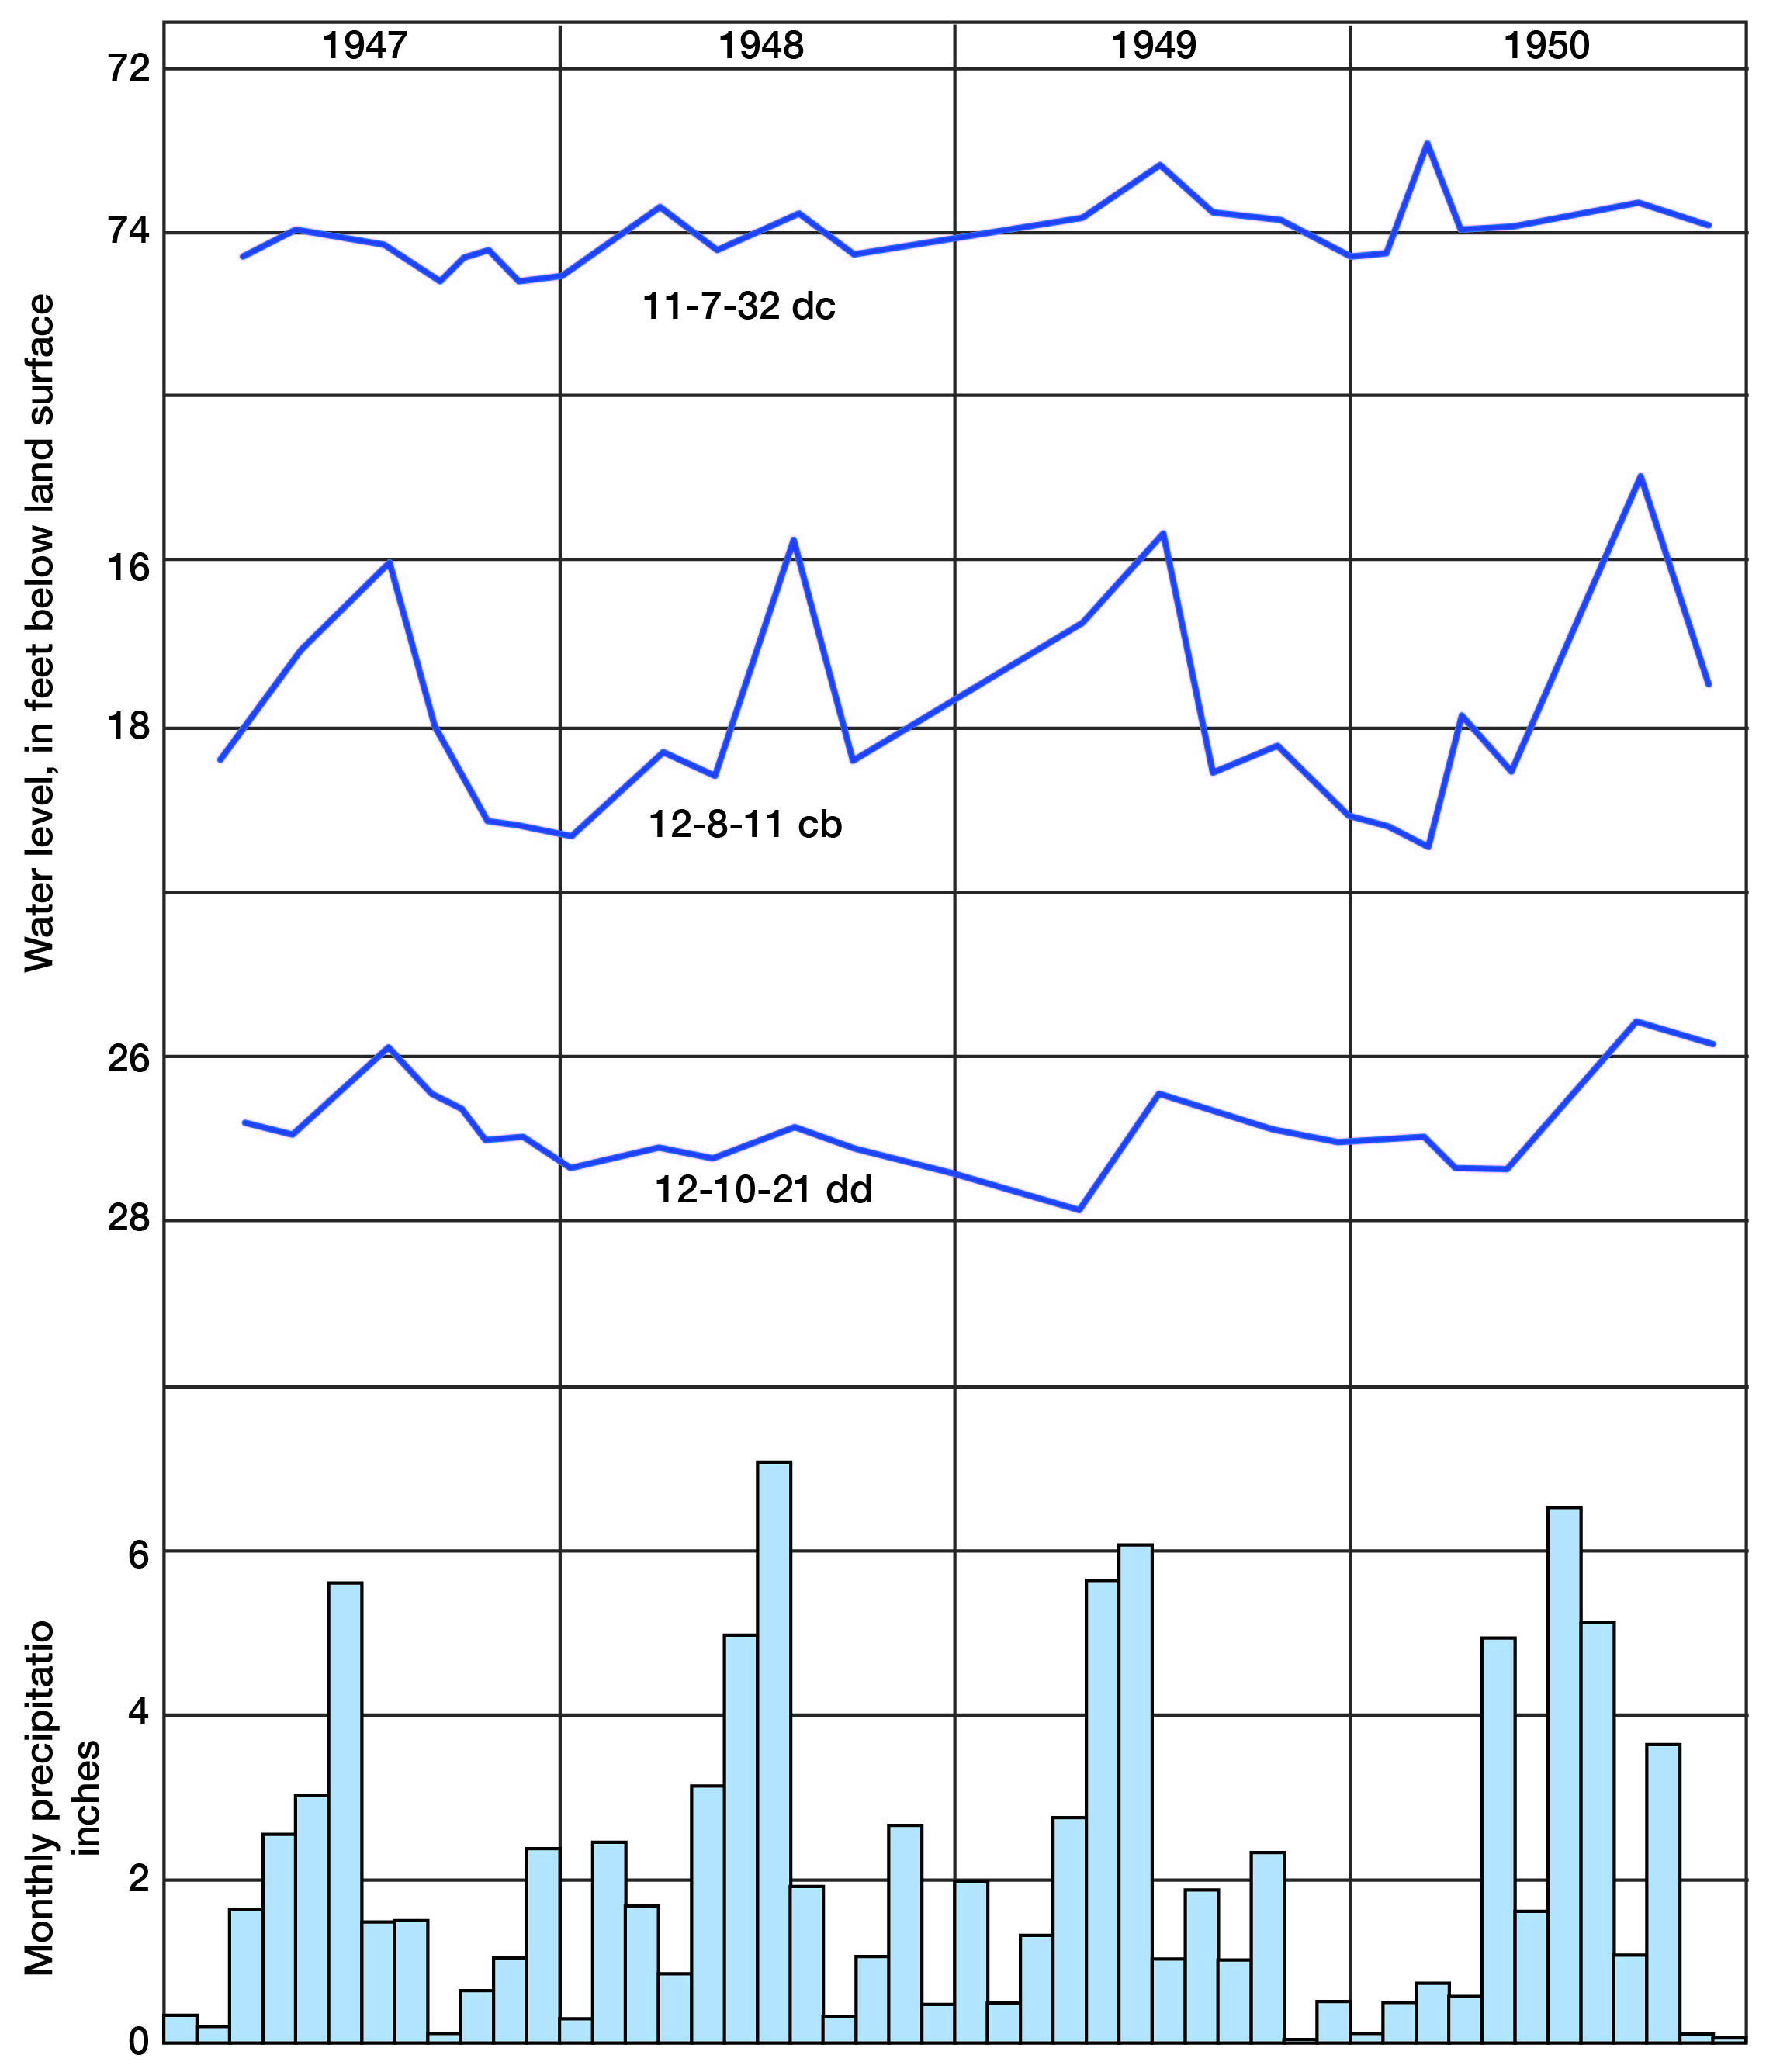
The fluctuations of water level in three observation wells in Lincoln County and the monthly precipitation near Lincoln for the period 1946 through 1950 are shown graphically in Figure 6. The period of measurement of these wells is as yet too short to permit definite correlation between precipitation and recharge. Nevertheless, a general correlation between rising water levels and high precipitation is indicated.
Figure 6--Hydrographs of three observation wells and monthly precipitation (1946-1950) near Lincoln.
Recharge
Recharge is the addition of water to the underground reservoir. Ground water within a practicable drilling depth in Lincoln County is derived from precipitation that falls as snow or rain either in the area or in near-by areas to the west and northwest.
Recharge from local precipitation--The normal annual precipitation in this area is about 24 inches, but only a small fraction of this amount enters the zone of saturation as recharge to the ground-water reservoir. The depth to the water table and the type of material above the water table greatly influence the amount and frequency of recharge. The flat terraces and flood plains of Saline River and Salt Creek and their major tributaries, where the water table lies near the land surface and is overlain by unconsolidated deposits of sand and sandy silt, represent areas of high recharge. Maturely dissected divide areas characterized by channels and steep slopes, where the water table lies at a considerable depth below the land surface and is overlain by the impervious Carlile shale, Greenhorn limestone, or Graneros shale, represent areas of low recharge. Recharge into outcropping Cretaceous rocks varies widely, as the formations range from chalky shale and black fissile shale to sandstone. Recharge may be somewhat more in areas where faulting has occurred, where interstices have formed from the weathering of the shale and limestone, or where solution has opened small channelways in the limestone.
Recharge from streams and ponds--The stream surface of Saline River is below the water table and receives water from the ground-water reservoir. Therefore, the river is not a source of recharge to the ground-water body. The upper courses of the tributary streams, however, are above the water table, and during and after rains when these valleys are carrying surface flow some water probably seeps into the alluvial deposits and percolates downward to recharge the ground-water reservoir.
A large number of surface ponds have been constructed in Lincoln County. Where these ponds are above the water table and are underlain by permeable material they constitute a source of recharge to the ground-water body. Where the ponds are well sealed to prevent downward leakage, recharge to the ground-water reservoir is negligible.
Recharge from subsurface inflow--As indicated by the slope of the water table (Pl. 2), the movement of ground water under the valley area is in an easterly to southeasterly direction. Hence, a small amount of water from precipitation in central and eastern Russell County moves into western Lincoln County and contributes to the available supply of ground water.
Much of the recharge to the water-bearing zones in the Cretaceous rocks may be derived from areas outside Lincoln County. The Cretaceous rocks in Lincoln County generally dip eastward toward the outcrop areas. The wells that penetrate Cretaceous rocks toward the outcrop area tap artesian water, so that the piezometric surface at some places is as much as 75 feet above the level at which the water was found. These conditions indicate that the source of the water in these beds is west of the area under discussion.
Discharge
Ground-water discharge is the release of water directly from the zone of saturation or from the capillary fringe; it may take place through evaporation and transpiration or through springs, seeps, wells, or infiltration galleries.
Natural discharge--Before artificial discharge was introduced in Lincoln County the ground-water reservoir in that area was in a state of approximate equilibrium--that is, the average annual recharge was approximately balanced by the average annual discharge, and the water table was moderately stable except for seasonal fluctuations. Water was added to the ground-water reservoir by movement from the west and northwest, by recharge from precipitation, and by seepage from streams. Ground water was discharged from the area principally by movement to the east and southeast and by discharge into Saline River. The discharge into the river is illustrated by the water-table contour map (Pl. 2).
Other methods of ground-water discharge in this area are transpiration and evaporation. Water may be taken into the roots of plants directly from the zone of saturation or from the capillary fringe, and be discharged from the plants by transpiration. The depth from which plants will lift ground water in an area of given climate varies with different plant species and different types of soil. The lift by ordinary grasses and field crops is not more than a few feet; however, alfalfa and certain types of desert plants have been known to send their roots to depths of 60 feet to reach the water table (Meinzer, 1923, p. 83).
Transpiration in Lincoln County probably is slight owing to the small percentage of the total land area in the valleys. However, transpiration in the Saline River and Rattlesnake Creek Valleys is considerable, because of the shallow water table and the growth of crops such as alfalfa.
The amount of ground water discharged by direct evaporation is very small; however, in an area of a few square miles west of the city of Lincoln the water table is shallow enough for some evaporation to take place. Other places where the water table is sufficiently shallow for direct evaporation are along the banks of the streams and in parts of the stream beds.
Discharge from wells--Much of the discharge from the ground-water reservoir is from wells. All city supplies (quantities are shown in the section on utilization) and most of the domestic and stock supplies in the rural areas are obtained from wells. The total quantity of water pumped annually from wells is not known.
Recovery
Principles of Recovery
When water is standing in a well, the head or pressure of the water inside the well and the head of the water outside the well are in equilibrium. Whenever the head inside a well is reduced, a differential head is established and water moves into the well. The head of the water inside a well may be reduced in two ways: (1) by lowering the water level by a pump or some other lifting device, and (2) by reducing the head at the source of a well that discharges by artesian pressure. Whenever water is removed from a well there is a resulting drawdown or lowering of the water level or, in a flowing artesian well, an equivalent reduction in artesian head. When water is being discharged from a well, the water table is lowered in an area around the well to form a depression resembling an inverted cone. This depression of the water table is known as the cone of depression, and the distance that the water level is lowered is called the drawdown. In any well, within certain limits, the greater the rate of pumping the greater will be the drawdown.
The capacity of a well is the rate at which it will yield water after the water stored in the well has been removed. The capacity depends upon the thickness and permeability of the water-bearing bed and the construction and condition of the well. The capacity of a well generally is expressed in gallons a minute.
The specific capacity of a well is its rate of yield per unit of drawdown and it is determined by dividing the tested capacity in gallons a minute by the drawdown in feet. If a well yields 1,000 gallons a minute, for example, and has a drawdown of 10 feet when pumped at that rate, then the specific capacity of the well would be 1,000 divided by 10, or 100 gallons a minute per foot of drawdown, or simply 100.
When water is withdrawn from a well, the water level drops rapidly at first and then more slowly until it finally becomes nearly .stationary. When the withdrawal of water from a well ceases, the water level rises rapidly at first and then more slowly until eventually it reaches approximately its original position.
Methods of Recovery
Ground water is recovered by wells penetrating the zone of saturation or by springs developed at the outcrop of an aquifer.
Wells in the county are bored, dug, or drilled. Generally the dug and bored wells are in the valleys where the water table is shallow, and the drilled wells are in areas where consolidated material is penetrated before the aquifer is reached.
A few springs have been developed in the Cretaceous outcrop area in the county. Those visited, with the exception of one artesian spring in the extreme southeastern part of the area, are gravity springs. They are of two types: (1) contact springs, and (2) seepage springs. The contact springs issue at the contact of the sandstone and clay in the Dakota formation or at the contact of the Greenhorn limestone and Graneros shale, where permeable beds overlie the relatively impermeable clay or shale. Seepage springs issue from the porous sandstone of the Dakota formation and along slopes or streams where the Pleistocene sand and gravel is saturated.
Several methods of spring development are used to increase the available supply of water. The method most used in the county is that of constructing dams in the drainageways below the point of issue of the spring or seep. Several water supplies for stock have been developed in this way in the Dakota outcrop area in the southeastern part of the county. Although some of the springs are wet-weather springs, they serve as a supplemental supply.
A common method of utilizing springs for domestic and stock supplies consists of concentrating the flow at the point of issue. This is done by cleaning out a small gathering pit, with walls for diverting the flow into a single channel, or by driving or boring a hole or series of lateral holes into the aquifer, and by collecting the flow into a single outlet. The permanence of springs depends upon the capacity of their reservoirs to store and transmit water. The flow of most of the springs in the area fluctuates with local precipitation.
Utilization
During this investigation, data on 175 wells in Lincoln County were obtained. All types of wells in all parts of the area were visited. Most of them were domestic or stock wells; five were municipal wells. At the time of the investigation no ground water was being used for irrigation.
Domestic and Stock Supplies
Domestic wells supply homes with water for drinking, cooking, and washing, and supply schools not served by municipal wells. Stock wells supply water for livestock, principally cattle. Most water for domestic use is obtained from wells, but in some of the areas of outcrop of Greenhorn limestone and Graneros shale a few cisterns are used. Most of the stock water is obtained from wells, but in recent years there has been an increased construction of dams on dry watercourses in areas where supplies of ground water are difficult to obtain. Although the water from wells penetrating the Dakota formation may have a high chloride content, it generally is satisfactory for stock use.
Public Supplies
Lincoln, Sylvan Grove, and Barnard are the only cities in Lincoln County that have public water supplies, and they are supplied from wells. Brief descriptions of the water-supply systems of these cities follow, and details of well construction are listed in Table 14.
Lincoln--The City of Lincoln is supplied from two dug wells penetrating the Dakota formation. These wells are 80 feet deep and are walled with native stone. They are equipped with turbine pumps powered by 15- and 20-horsepower electric motors. The depth to water in each well is reported to be 30 feet.
In 1949 the City of Lincoln consumed an average of about 9 million gallons of water a month and had a storage capacity of 950,000 gallons. The storage space is divided into three units: an elevated tank having a capacity of 750,000 gallons, and two underground reservoirs each having a capacity of 100,000 gallons.
Sylvan Grove--The water supply for Sylvan Grove is obtained from two drilled wells penetrating a sandstone of the Dakota formation. The wells are on a terrace on the north side of Saline River at the west side of the city. They are 68 and 70 feet deep respectively, and have a static water level of about 45 feet. Both wells are cased with iron and are equipped with turbine pumps powered by 40-horsepower electric motors. The wells are reported to have a drawdown of 8.5 feet after being pumped at the rate of 350 gallons a minute for 4 hours.
The City of Sylvan Grove consumes about 3.5 million gallons of water a month and has a storage capacity of 82,000 gallons. The storage space is divided into two units: an elevated tank, which has a capacity of 50,000 gallons, and an underground reservoir, which has a capacity of 32,000 gallons.
Barnard--The City of Barnard is supplied with water from a dug well 60 feet deep and 8 feet in diameter. The depth to water was about 9.5 feet in September 1949. Although the well is located on a terrace along Salt Creek, the depth of the well and the character of the water indicate that the aquifer is a sandstone of the Dakota formation. A 5-horsepower electric motor operates the turbine pump on the well.
The city is reported to consume about 300,000 gallons of water a month. Water is stored in an elevated concrete tank having a capacity of 80,000 gallons.
Chemical Quality of Ground Water
By Walton H. Durum
General Conditions
All ground water contains mineral substances in solution. The major constituents in the ground water in Lincoln County include the cations calcium, magnesium, sodium, and potassium, and the anions bicarbonate, sulfate, chloride, and nitrate. Lesser amounts of fluoride, boron, iron, and silica also are present. The quantities of the various constituents, together with other related physical measurements, are presented in Table 3. For those samples that were analyzed by the U. S. Geological Survey, pH and specific conductance (the reciprocal of the electrical resistivity of the water, a function of ion concentration and mobility) were determined also.
Table 3--Mineral constituents, in parts per million, and related physical measurements of ground water in Lincoln County
| Location of well or spring |
Date of collection |
Depth of well (feet) |
Temp. (°F) |
pH | Specific conductance (micromhos at 250° C) |
Silica (SiO2) |
Iron (Fe) |
Calcium (Ca) |
Magnesium (Mg) |
Sodium (Na) |
Potassium (K) |
Bicarbonate (HCO3) |
Sulfate (SO4) |
Chloride (Cl) |
Fluoride (F) |
Nitrate (NO3) |
Boron (B) |
Dissolved solids |
Hardness as CaCO3 | Percent sodium |
|
|---|---|---|---|---|---|---|---|---|---|---|---|---|---|---|---|---|---|---|---|---|---|
| Total | Non- carbonate |
||||||||||||||||||||
| Alluvium | |||||||||||||||||||||
| 10 7 11cd | 6-15-1949 | 25.0 | 16 | 3.6 | 218 | 27 | 196 | 417 | 301 | 170 | 0.3 | 230 | 1,360 | 655 | 313 | 39 | |||||
| 12 8 6aa | 9-15-1947 | 18.9 | 60 | 7.5 | 3,020 | 20 | .80 | 446 | 46 | 544 | 9.6 | 521 | 522 | 1,060 | .0 | 40 | 0,17 | 2,940 | 1,300 | 875 | 47 |
| 12 9 16bb | 9-16-1947 | 61.0 | 60 | 8.6 | 849 | 33 | 1.8 | 130 | 16 | 41 | 7.5 | 416 | 92 | 36 | .1 | .5 | .19 | 556 | 390 | 50 | 18 |
| 12 10 8bb | 9-16-1947 | 29.5 | 58 | 7.4 | 614 | 28 | 1.8 | 41 | 8.3 | 91 | 5.4 | 283 | 47 | 20 | .1 | 40 | .26 | 409 | 136 | 0 | 58 |
| 12 10 21dd | 9-16-1947 | 31.8 | 58 | 7.4 | 875 | 27 | .28 | 64 | 19 | 114 | 9.5 | 402 | 74 | 30 | .1 | 60 | .26 | 578 | 238 | 0 | 59 |
| Sanborn formation | |||||||||||||||||||||
| 11 8 35da | 9-15-1947 | 25.2 | 60 | 8.3 | 450 | 20 | .44 | 39 | 13 | 37 | 6.5 | 157 | 43 | 39 | .3 | 12 | .20 | 271 | 151 | 22 | 34 |
| 12 6 25bb | 9-15-1947 | 20.5 | 59 | 7.3 | 2,120 | 24 | .31 | 211 | 48 | 241 | 6.4 | 329 | 744 | 130 | .4 | 35 | .24 | 1,600 | 724 | 454 | 42 |
| 12 8 11cb | 9-15-1947 | 32.0 | 58 | 7.3 | 1,240 | 38 | .53 | 214 | 25 | 29 | 11 | 597 | 137 | 55 | .1 | 7.0 | .21 | 810 | 637 | 148 | 9 |
| 13 10 27dd | 6-17-1949 | 80.0 | 17 | .48 | 120 | 7.2 | 11 | 324 | 16 | 31 | .2 | 33 | 395 | 329 | 63 | 7 | |||||
| Dakota formation | |||||||||||||||||||||
| 10 6 16da | 6-15-1949 | 34 | 7.0 | 12 | 143 | 18 | 84 | 407 | 66 | 47 | .2 | 181 | 746 | 431 | 97 | 30 | |||||
| 10 8 17cc | 5-31-1949 | 186 | 21 | 6.1 | 50 | 42 | 1,060 | 717 | 465 | 1,080 | 1.7 | 3.9 | 3,080 | 298 | 0 | 89 | |||||
| 10 10 14ca | 6-16-1949 | 206.0 | 9.2 | 2,4 | 97 | 11 | 38 | 342 | 73 | 8.0 | .4 | 2.1 | 407 | 287 | 7 | 23 | |||||
| 11 7 1bc | 5-26-1949 | 195 | 12 | 6.1 | 24 | 15 | 338 | 564 | 333 | 30 | 1.0 | 4.0 | 1,040 | 122 | 0 | 86 | |||||
| 11 8 9ba | 6-1-1949 | 260.0 | 12 | 1.2 | 4.0 | 3.2 | 450 | 726 | 166 | 160 | 2.8 | 1.8 | 1,160 | 23 | 0 | 98 | |||||
| 11 8 36aa | 11-20-1950 | 200 | 10 | .44 | 125 | 48 | 66 | 342 | 265 | 45 | 1,0 | 38 | 766 | 510 | 230 | 22 | |||||
| 11 10 17bb | 6-17-1949 | 190 | 10 | 9.7 | 4.0 | 3.8 | 439 | 632 | 212 | 165 | 2.4 | 2.6 | 1,150 | 26 | 0 | 97 | |||||
| 11 10 26cb | 6-16-1949 | 194. 0 | 5.0 | 2.5 | 47 | 10 | 160 | 442 | 74 | 44 | .9 | 2.3 | 561 | 158 | 0 | 69 | |||||
| 12 6 32aa | 9-15-1947 | 30.5 | 59 | 7.0 | 1,650 | 19 | 7.2 | 200 | 49 | 39 | 4.0 | 195 | 73 | 165 | .1 | 408 | .19 | 1,050 | 700 | 540 | 12 |
| 12 7 9ad | 9-15-1947 | 38.0 | 59 | 7.2 | 422 | 46 | .38 | 49 | 7.7 | 29 | 3.1 | 159 | 50 | 27 | .1 | 1.5 | .08 | 291 | 154 | 24 | 29 |
| 12 7 12aa | 9-15-1947 | 130.0 | 60 | 7.1 | 1,710 | 11 | 5.2 | 128 | 31 | 228 | 6.4 | 330 | 409 | 162 | .8 | 30 | .50 | 1,170 | 447 | 176 | 52 |
| 12 8 13dd | 9-15-1947 | 70.0 | 59 | 6.8 | 716 | 22 | 1.7 | 92 | 18 | 31 | 2.6 | 234 | 71 | 45 | .4 | 55 | .10 | 474 | 304 | 112 | 18 |
| 12 9 11dd | 9-16-1947 | 16.0 | 60 | 7.3 | 1,020 | 14 | .30 | 136 | 25 | 61 | 7.0 | 300 | 192 | 75 | .4 | 40 | .18 | 692 | 442 | 196 | 23 |
| 12 10 24dd | 9-16-1947 | 70.7 | 60 | 7.3 | 2,650 | 16 | 2.8 | 102 | 40 | 429 | 15 | 366 | 223 | 575 | 1.3 | 31 | 0.70 | 1,610 | 419 | 119 | 68 |
| 13 10 15ad | 6-17-1949 | 97 | 13 | 5.7 | 108 | 15 | 28 | 272 | 128 | 24 | .5 | 1.3 | 452 | 331 | 108 | 16 | |||||
| 13 10 25dc | 6-17-1949 | 130.0 | 4.0 | 9.3 | 115 | 26 | 57 | 378 | 154 | 32 | .7 | 1.8 | 576 | 394 | 84 | 24 | |||||
| Undifferentiated | |||||||||||||||||||||
| 11 8 31ad | 6-16-1949 | 34.6 | 15 | 1.1 | 186 | 22 | 86 | 368 | 125 | 85 | .1 | 235 | 935 | 554 | 252 | 25 | |||||
| 12 6 11ac | 9-15-1947 | 37.0 | 59 | 7.3 | 3,010 | 4.0 | 3.7 | 211 | 44 | 395 | 24 | 341 | 361 | 425 | .9 | 420 | 41 | 2,050 | 708 | 428 | 54 |
| 12 10 14bc | 9-16-1947 | 44.9 | 59 | 7.8 | 660 | 20 | .50 | 101 | 10 | 23 | 3.8 | 2.96 | 48 | 34 | .1 | 10 | 416 | 293 | 50 | 14 | |
Calcium is the predominant basic ion in most water in the area of shallow wells and, in deeper wells, in water that is in contact with deposits of gypsum, selenite, or limestone. Calcium and magnesium impart hardness to water and are responsible for increased use of soap and for the undesirable curd formed in washing processes. Water that contains less than 50 or 60 parts per million hardness (as CACO3) is considered to be soft, whereas hardness in excess of 60 parts per million becomes increasingly noticeable to the consumer. In the samples of water from Lincoln County, the contents of calcium and magnesium ranged from 4.0 to 446 parts per million and from 3.2 to 49 parts per million, respectively.
Sodium and potassium, which are common to all natural water, are of particular importance in evaluating water for irrigation. A high percentage of sodium in water for irrigation is undesirable because it may alter the soil structure to such an extent as to inhibit downward movement of the water. There is a wide range in the content of sodium and potassium in water in the county. The range in sodium is from 11 parts per million in a dilute water of the Pleistocene silts and sands to 1,060 parts per million in a highly concentrated water in the Dakota formation. The percentages of sodium range from 7 to 98.
Bicarbonate is the principal anion in water in Lincoln County that has a dissolved solids concentration lower than 1,000 parts per million. The bicarbonate content in samples that were analyzed for this report ranged from 157 to 726 parts per million.
The strong acid constituents--sulfate, chloride, and nitrate--in combination with calcium and magnesium cause permanent hardness in water, and chloride and nitrate are also effective corrosive agents in cased wells. High concentrations of sulfate are common in the various stratigraphic units in the area, the range being from 16 to 744 parts per million. Water of high chloride content is obtained from the Dakota formation or from the alluvium and Sanborn formation, whose water is affected by water from the Dakota formation or by surface contamination. Nitrate in concentrations that exceed 45 parts per million is undesirable because of the possible toxic effect on the blood circulatory system of infants. Much of the water sampled, particularly from shallow wells, was high in nitrate (as NO3), which ranged from 0.4 to 553 parts per million.
Fluoride in small quantities is desirable for the normal development of teeth, but quantities that exceed 1.5 parts per million may cause the pitting and discoloration of teeth of small children. Recently, there has been a trend toward fluoridation of municipal supplies in some areas of the United States where the fluoride content of the water is very low. The fluoride content of water samples collected in Lincoln County ranged from 0.1 to 2.8 parts per million, and one sample from the alluvium had no fluoride. Most of the high-fluoride water was associated with the Dakota formation.
Boron concentrations exceeding 1.0 part per million in water for irrigation may prove harmful to boron-sensitive crops. The amount of boron in 15 samples from Lincoln County that were examined was low, ranging from 0.08 to 0.70 part per million. One sample had no boron.
Iron and manganese in quantities that exceed 0.3 part per million are undesirable, as they stain fabrics and plumbing fixtures and produce an unpleasant coloration in the water. Water in the ground may contain much iron, but upon exposure to air the iron precipitates, only a few tenths of a part of iron remaining in solution. The iron content in untreated water in Lincoln County is a problem to users of domestic supplies; in 26 of 28 samples analyzed it exceeded 0.3 part per million, ranging from 0.28 to 12 parts per million.
Water examined in this study was essentially from three geologic sources: from alluvium (5 wells, 18.9 to 61.0 feet deep); Sanborn formation (4 wells, 20.5 to 80.0 feet deep); and Dakota formation (16 wells, 16.0 to 260 feet deep). The water from three wells could not be correlated with any of the water-bearing formations. A summary of the range in mineral constituents is given in Table 4.
Table 4--Maximum and minimum content, in parts per million, of mineral constituents in ground water from the alluvium, Sanborn formation, and Dakota formation. (*Includes those samples for which only chloride and nitrate were determined.)
| Constituent | Maximum | Minimum |
|---|---|---|
| Calcium | 446 | 4.0 |
| Magnesium | 49 | 3.2 |
| Sodium and potassium | 1,060 | 11 |
| Bicarbonate | 726 | 157 |
| Sulfate | 744 | 16 |
| Chloride* | 1,410 | 8.0 |
| Fluoride | 2.8 | 0 |
| Nitrate (as N03)* | 553 | 0.4 |
| Dissolved solids | 3,080 | 271 |
| Total hardness | 1,300 | 23 |
| Percent sodium | 98 | 7 |
Quality of Water
Alluvium
Of the five water samples that were obtained from wells in the alluvium, three have dissolved solids concentrations of less than 600 parts per million. These are essentially bicarbonate waters of either calcium or sodium, and they are hard. The other two waters are high in dissolved solids (1,360 and 2,940 parts per million) which consist of approximately equal quantities of calcium, sodium, bicarbonate, and sulfate. The water from well 12-8-6aa also contained 1,060 parts per million chloride, which indicates that saline water from the Dakota formation locally may be draining into the alluvium. High concentrations of nitrate are common to water from wells in the alluvium; this problem is discussed later in this report. A summary of mineral constituents of water from the alluvium in Lincoln County is given in Table 5.
Table 5--Maximum and minimum content, in parts per million, of mineral constituents in ground water from the alluvium. (*Includes those samples for which only chloride and nitrate were determined.)
| Constituent | Maximum | Minimum | Average |
|---|---|---|---|
| Calcium | 446 | 41 | |
| Magnesium | 46 | 8.3 | |
| Sodium and potassium | 570 | 45 | |
| Bicarbonate | 521 | 283 | |
| Sulfate | 522 | 47 | |
| Chloride* | 1,060 | 14 | 129 |
| Fluoride | 0.3 | 0 | |
| Nitrate (as NO3) * | 553 | 0.4 | 72 |
| Dissolved solids | 2,940 | 409 | |
| Total hardness | 1,300 | 136 | |
| Percent sodium | 58 | 18 |
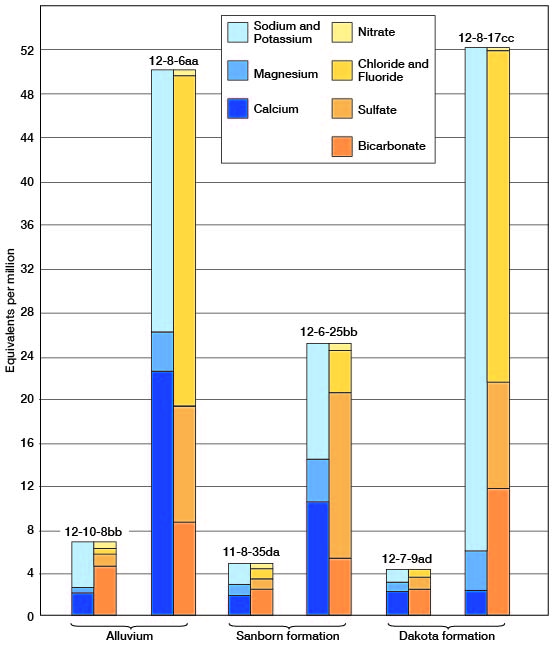
As compared with water in the Dakota formation (Tables 3 and 7), that in the alluvium has a greater range in quantities of calcium and nitrate and is harder. This relationship is seen in in which the analyses of water from wells 12-8-6aa and 10-8-17cc are shown diagrammatically. The total concentration, as equivalents per million, is similar in water from both aquifers. The ground water from the alluvium contains approximately 4 1/2 times as much calcium and magnesium, together. It is particularly significant that in all determinations made for chloride and nitrate, little difference is noted in the average quantity of chloride in the the two stratigraphic units. The average chloride content of 16 samples from the alluvium was 129 parts per million, whereas the average was 125 parts per million for 80 samples from the Dakota formation.
Figure 7--Chemical analyses of dilute and concentrated water in the three principal water-bearing formations in Lincoln County.
Water from Undifferentiated Sources
One sample was obtained from a well that taps both the alluvium and the Sanborn formation. Because there is a wide range in the mineral content of the water from both geologic sources, it is difficult to predict the extent of influence of each of the water-bearing sources. Presumably, the water in the Sanborn formation would, on the average, be somewhat lower in mineral content than the water obtained from the alluvium.
The water from well 11-8-31ad, 34.6 feet deep, has a dissolved solids content of 935 parts per million, largely calcium bicarbonate. The water is extremely hard; the hardness as calcium carbonate is 554 parts per million. The possibility of pollution is indicated by a nitrate (as NO3) content of 235 parts per million. This is further substantiated by a chloride content of 85 parts per million, which is somewhat higher than the chloride content of wells in those unconsolidated deposits that yield water of low nitrate content.
One well, 12-10-14bc, 44.9 feet deep, is believed to be drawing water from both the alluvium and the Dakota formation; however, the character of the water is more typical of that associated with the unconsolidated materials in the area. The water contains 416 parts per million dissolved solids and is a calcium bicarbonate type. Accordingly, this supply also is hard.
Well 12-6-11ac, 37.0 feet deep, drawing water from the Sanborn and Dakota formations, undifferentiated, yields water containing 2,050 parts per million of dissolved solids and relatively equal amounts of bicarbonate, sulfate, chloride, and nitrate. The hardness is 708 parts per million. The analysis is characteristic of water that has been altered by drainage from the Dakota formation.
Sanborn Formation
Unless it is affected by surface flows from other formations, it is likely that water from the terrace deposits is probably more dilute than other ground water in the area.
Three of four samples from wells in the Sanborn formation are dilute as compared with water from the alluvium. They are predominantly of the calcium bicarbonate type and have 271, 395, 810, and 1,600 parts per million dissolved solids. The water from well 12-6-25bb, 20.5 feet deep, has the highest sulfate content of all water samples analyzed. It is likely that the water has encountered some gypsum or selenite rocks. All the water is hard, the range in hardness (as calcium carbonate) being from 151 to 724 parts per million. Conversely, the percentages of sodium are generally lower than those of water in other formations in the area.
Dakota Formation
Sixteen samples were obtained from wells that penetrate the Dakota formation at depths that range from 16.0 to 260 feet. The range in chemical substances in the water is given in Table 6.
Table 6--Maximum and minimum content, in parts per million, of mineral constituents in ground water from the Dakota formation. (*Includes those samples for which only chloride and nitrate were determined.)
| Constituent | Maximum | Minimum | Average |
|---|---|---|---|
| Calcium | 200 | 4.0 | |
| Magnesium | 49 | 3.2 | |
| Sodium and potassium | 1,060 | 28 | |
| Bicarbonate | 726 | 159 | |
| Sulfate | 465 | 50 | |
| Chloride* | 1,410 | 8.0 | 125 |
| Fluoride | 2.8 | 0.1 | |
| Nitrate (as NO3)* | 469 | 0.9 | 49 |
| Dissolved solids | 3,080 | 291 | |
| Total hardness | 700 | 23 | |
| Percent sodium | 98 | 12 |
By comparison with water in the Pleistocene deposits, those samples obtained from the Dakota formation are generally lower in calcium and accordingly are softer, whereas the content of sodium and chloride is higher. The fluoride ion, which ranges from 0.1 to 2.8 parts per million, is generally more prominent in water from the Dakota formation and as a rule the concentration of nitrate is lower.
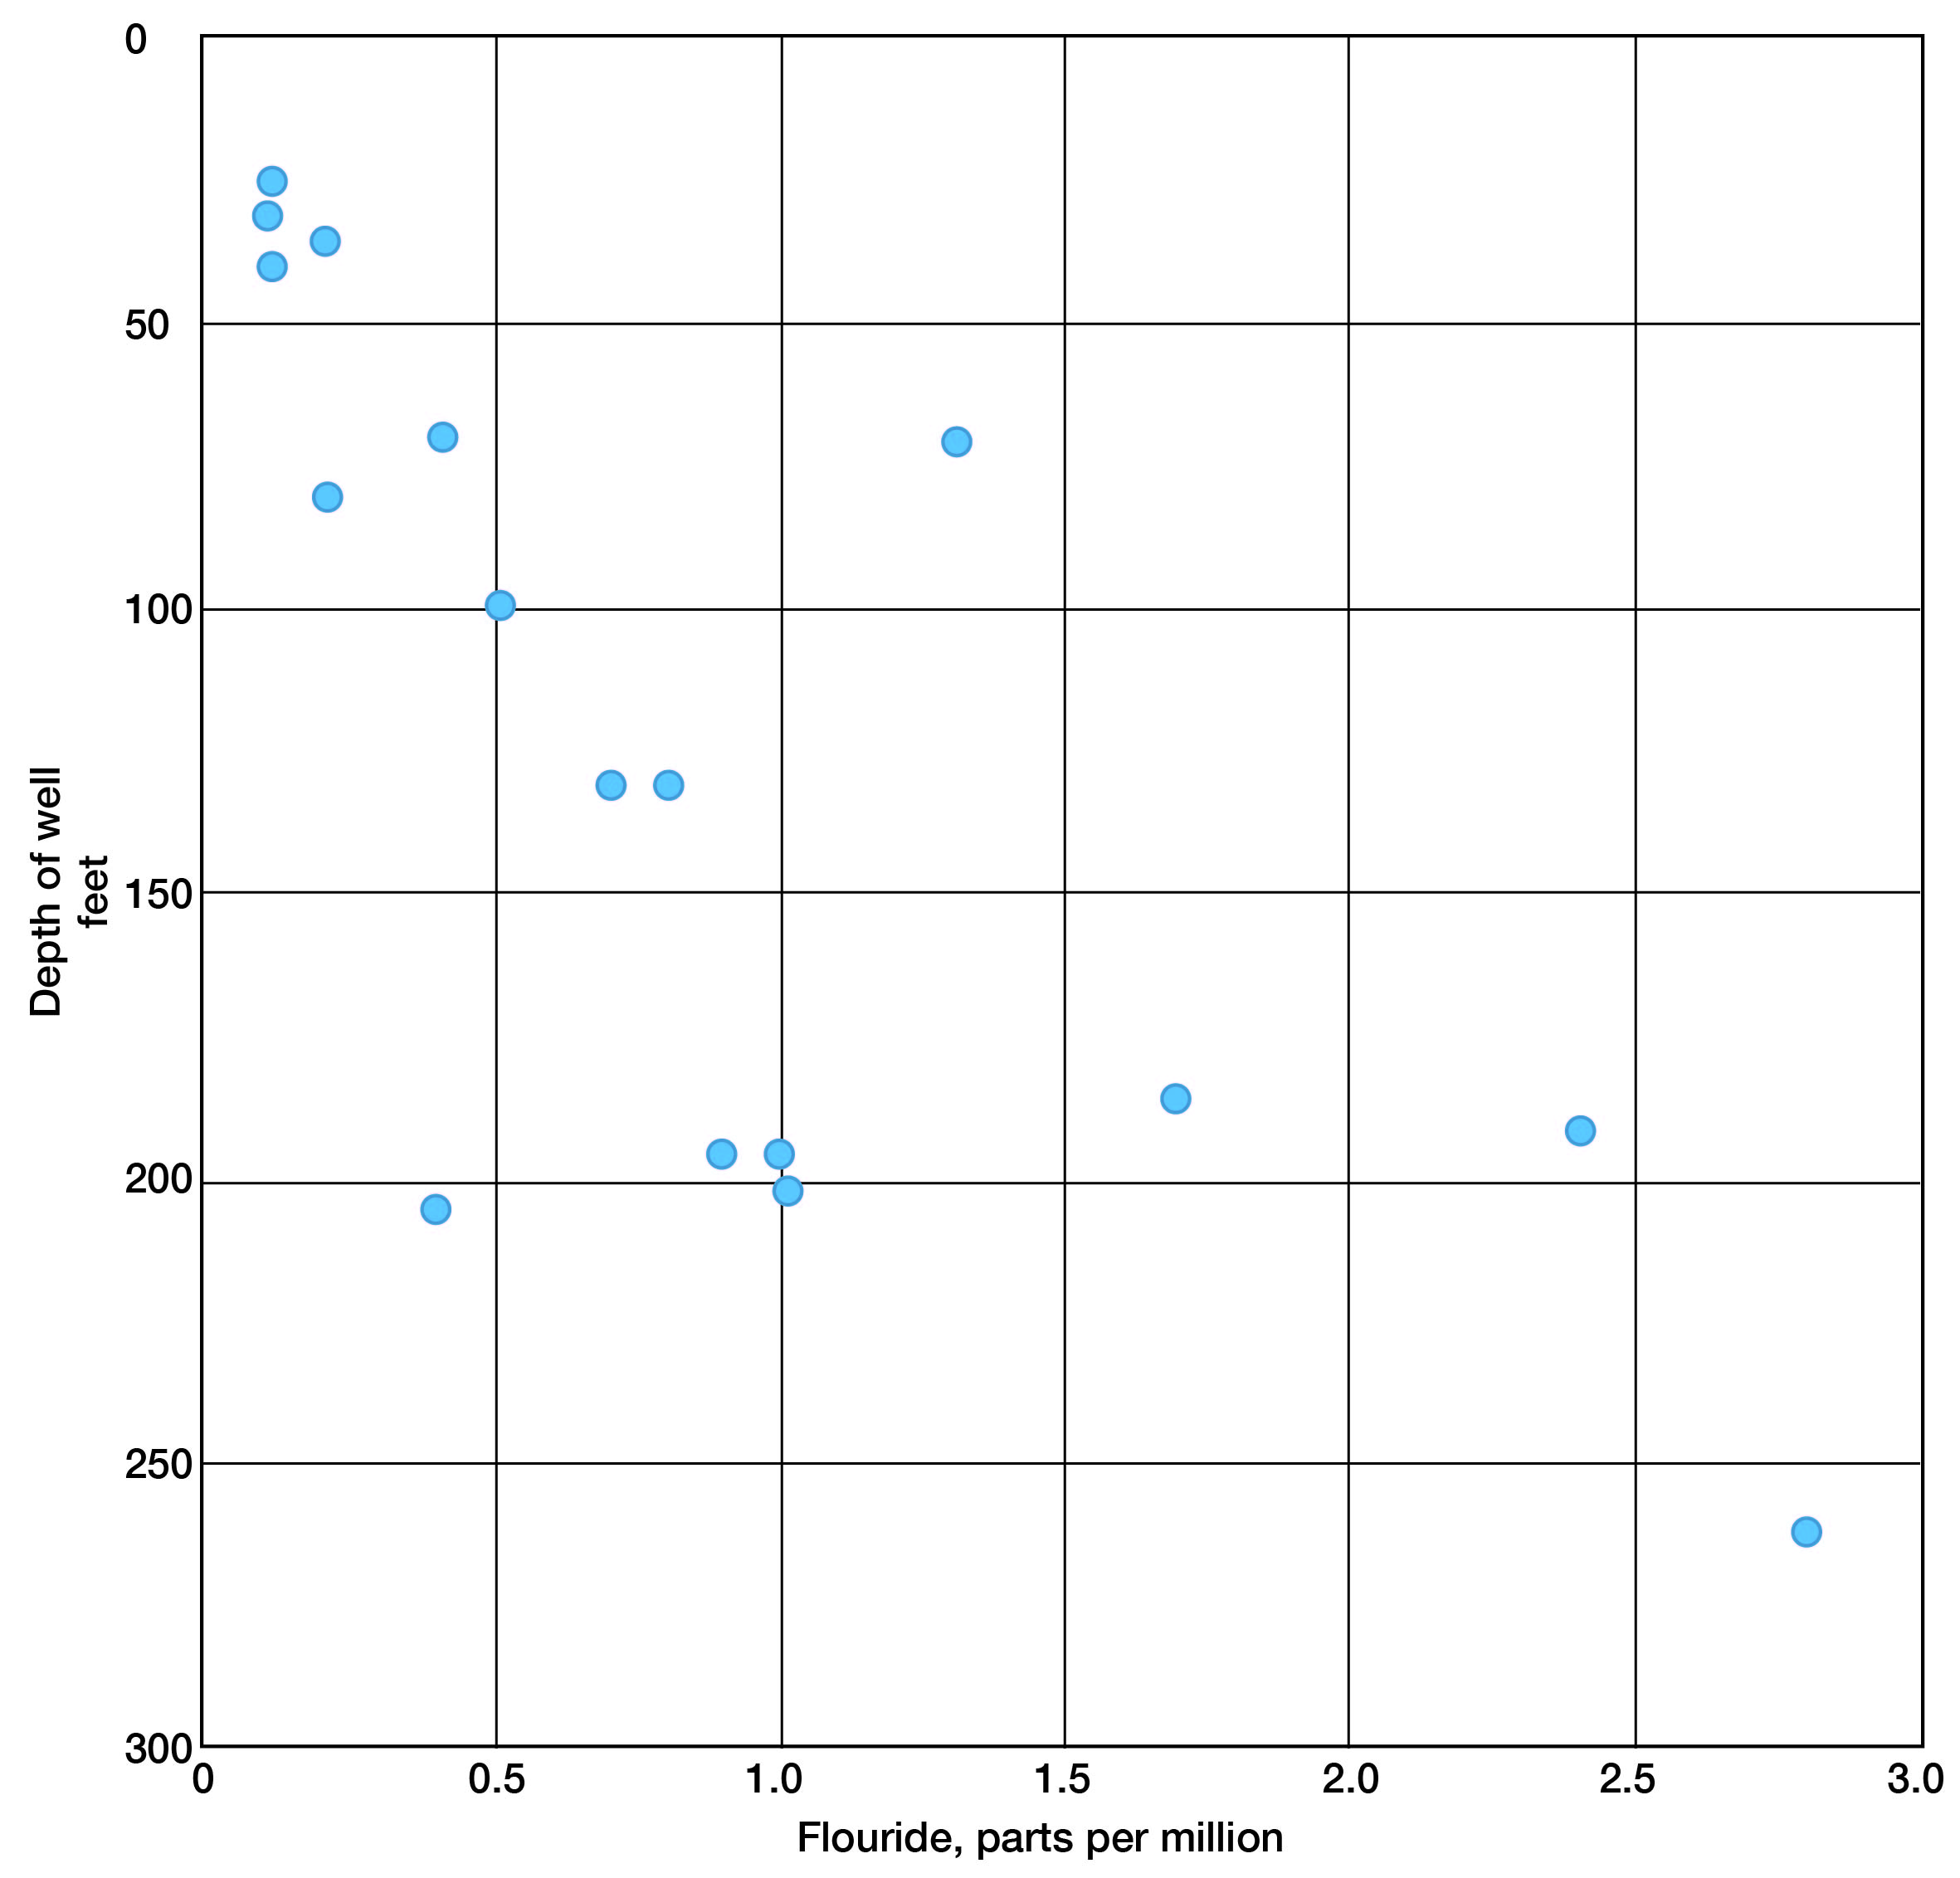
Water samples from the Dakota formation indicate a slight increase in fluoride with depth of well (Fig. 8). Otherwise, no particular relationship exists between the quantity of mineral constituents and depth of well in the Dakota formation. For the most part, shallow and deep wells that enter this formation yield water in which the dissolved solids range from about 400 to 1,200 parts per million. High chloride and hardness may be as prominent at depths of 200 feet as they are at shallow depths; evidence is lacking as to what changes might take place at greater depths in the formation.
Figure 8--Fluoride concentration with relation to depth in the Dakota formation.
Chloride-nitrate Relations
In addition to 28 complete analyses, a total of 88 partial analyses for chloride and nitrate content were made. The results are given in Table 7.
Table 7--Chloride and nitrate in waters from wells in Lincoln County (Analyses by Kansas State Board of Health).
| Well Location |
Source* | Depth of well, feet |
Chloride (ppm) |
Nitrate (as NO3) (ppm) |
|---|---|---|---|---|
| 10-6-7aa | P | 26.0 | 47 | 2.4 |
| 31ad | P | 47.0 | 31 | 18 |
| 10-7-4dd | D | 28.7 | 95 | 21 |
| 26bd | D | 89.0 | 127 | 66 |
| 10-8-4bb | D | 151.0 | 56 | 1.1 |
| 11ba | D | 62.4 | 1,410 | 7.1 |
| 13dd | D | 200.0 | 110 | 221 |
| 10-9-4dc | P | 30.7 | 302 | 66 |
| 11cd | D | 180.0 | 660 | 1.5 |
| 24dc | D | 195.0 | 176 | 1.8 |
| 28ad | D | 290.0 | 25 | 1.5 |
| 28cc | D | 155.0 | 17 | 0.9 |
| 34aa | D | 155.0 | 15 | 1.9 |
| 36dd | D | 80.0 | 12 | 1.5 |
| 10-10-2ad | P | 29.0 | 298 | 553 |
| 9bc | P | 22.0 | 130 | 62 |
| 28ad | P | 22.3 | 79 | 97 |
| 29bc | D | 202.0 | 470 | 301 |
| 36cc | P | 31.5 | 15 | 2.0 |
| 11-6-12da | D | 16.6 | 18 | 12 |
| 15cc | P | 95.2 | 31 | 19 |
| 18bc | D | 252.0 | 25 | 0.9 |
| 26bd | D | 123.0 | 19 | 2.2 |
| 28cc | D | 258.0 | 11 | 1.0 |
| 30cc | D | 99.0 | 12 | 49 |
| 32cc | D | 77.8 | 21 | 80 |
| 36ca | D | 21.3 | 73 | 469 |
| 11-7-6bb | D | 260.0 | 41 | 19 |
| 9aa | D | 99.8 | 130 | 266 |
| 11bd | D | 136.6 | 268 | 150 |
| 18db | D | 159.0 | 26 | 3.4 |
| 28bb | D | 88.7 | 25 | 71 |
| 30aa | P | 69.0 | 38 | 4.9 |
| 31ca | D | 100.2 | 45 | 8.8 |
| 34cc | D | 63.0 | 35 | 1.7 |
| 11-8-8dc | D | 142.0 | 80 | 80 |
| 26aa | D | 58.2 | 24 | 49 |
| 11-9-4dc | D | 48.0 | 68 | 217 |
| 16db | D | 138.0 | 955 | 8.8 |
| 25ad | P | 28.5 | 22 | 1.9 |
| 29cc | D | 65.0 | 29 | 38 |
| 11-10-4da | D | 103.0 | 24 | 1.5 |
| 21dc | D | 179.0 | 116 | 1.3 |
| 23aa | D | 189.0 | 79 | 106 |
| 30dd | D | 73.0 | 33 | 3.1 |
| 12-6-16dd | P | 28.0 | 305 | 0.9 |
| 31bb | D | 68.5 | 12 | 2.2 |
| 35ba | D | 72.5 | 156 | 1.3 |
| 36cc | D | 50.0 | 32 | 3.4 |
| 12-7-8dd | P | 25.4 | 20 | 88 |
| 19dd | P | 16.0 | 29 | 80 |
| 22bb | P | 67.0 | 19 | 1.3 |
| 28db | P | 96.0 | 310 | 0.4 |
| 12-8-15bb | D | 32.9 | 127 | 30 |
| 21dd | D | 57.8 | 20 | 28 |
| 29bb | D | 46.0 | 18 | 8.4 |
| 32aa | D | 24.8 | 35 | 71 |
| 34ab | D | 30.0 | 83 | 137 |
| 36aa | D | 87.5 | 60 | 5.3 |
| 12-9-3aa | D | 100.0 | 27 | 2.4 |
| 5ad | D | 47.0 | 17 | 2.2 |
| 22bb | P | 18.0 | 28 | 5.8 |
| 24cd | D | 64.0 | 34 | 22 |
| 29dc | D | 48.0 | 70 | 124 |
| 12-10-26bc | D | 80.0 | 30 | 2.3 |
| 13-6-7ab | D | 96.6 | 45 | 1.0 |
| 10bb | D | 92.0 | 223 | 1.5 |
| 26ba | D | 36.0 | 91 | 1.3 |
| 29ca | D | 100.5 | 17 | 1.3 |
| 13-7-7bb | D | 45.0 | 17 | 1.1 |
| 15dc | D | 71.5 | 21 | 5.8 |
| 17aa | D | 69.0 | 334 | 168 |
| 26ac | P | 36.0 | 15 | 1.3 |
| 28ba | P | 60.8 | 12 | 1.5 |
| 13-8-3dc | D | 58.0 | 18 | 3.2 |
| 13cc | P | 28.0 | 44 | 3.4 |
| 16bb | P | 44.5 | 22 | 31 |
| 20cb | D | 66.0 | 21 | 39 |
| 33ad | P | 10.7 | 40 | 71 |
| 13-9-2da | D | 88.0 | 11 | 1.3 |
| 4ad | D | 140.0 | 22 | 1.3 |
| 20aa | P | 19.0 | 14 | 3.5 |
| 22dc | D | 303.0 | 54 | 4.9 |
| 33bc | D | 260.0 | 15 | 4.4 |
| 35ad | D | 295.0 | 22 | 0.9 |
| 13-10-2bb | P | 26.3 | 70 | 14 |
| 5ac | D | 80.0 | 30 | 24 |
| 20dd | P | 72.0 | 11 | 23 |
| *P, Pleistocene deposits; D, Dakota formation. | ||||
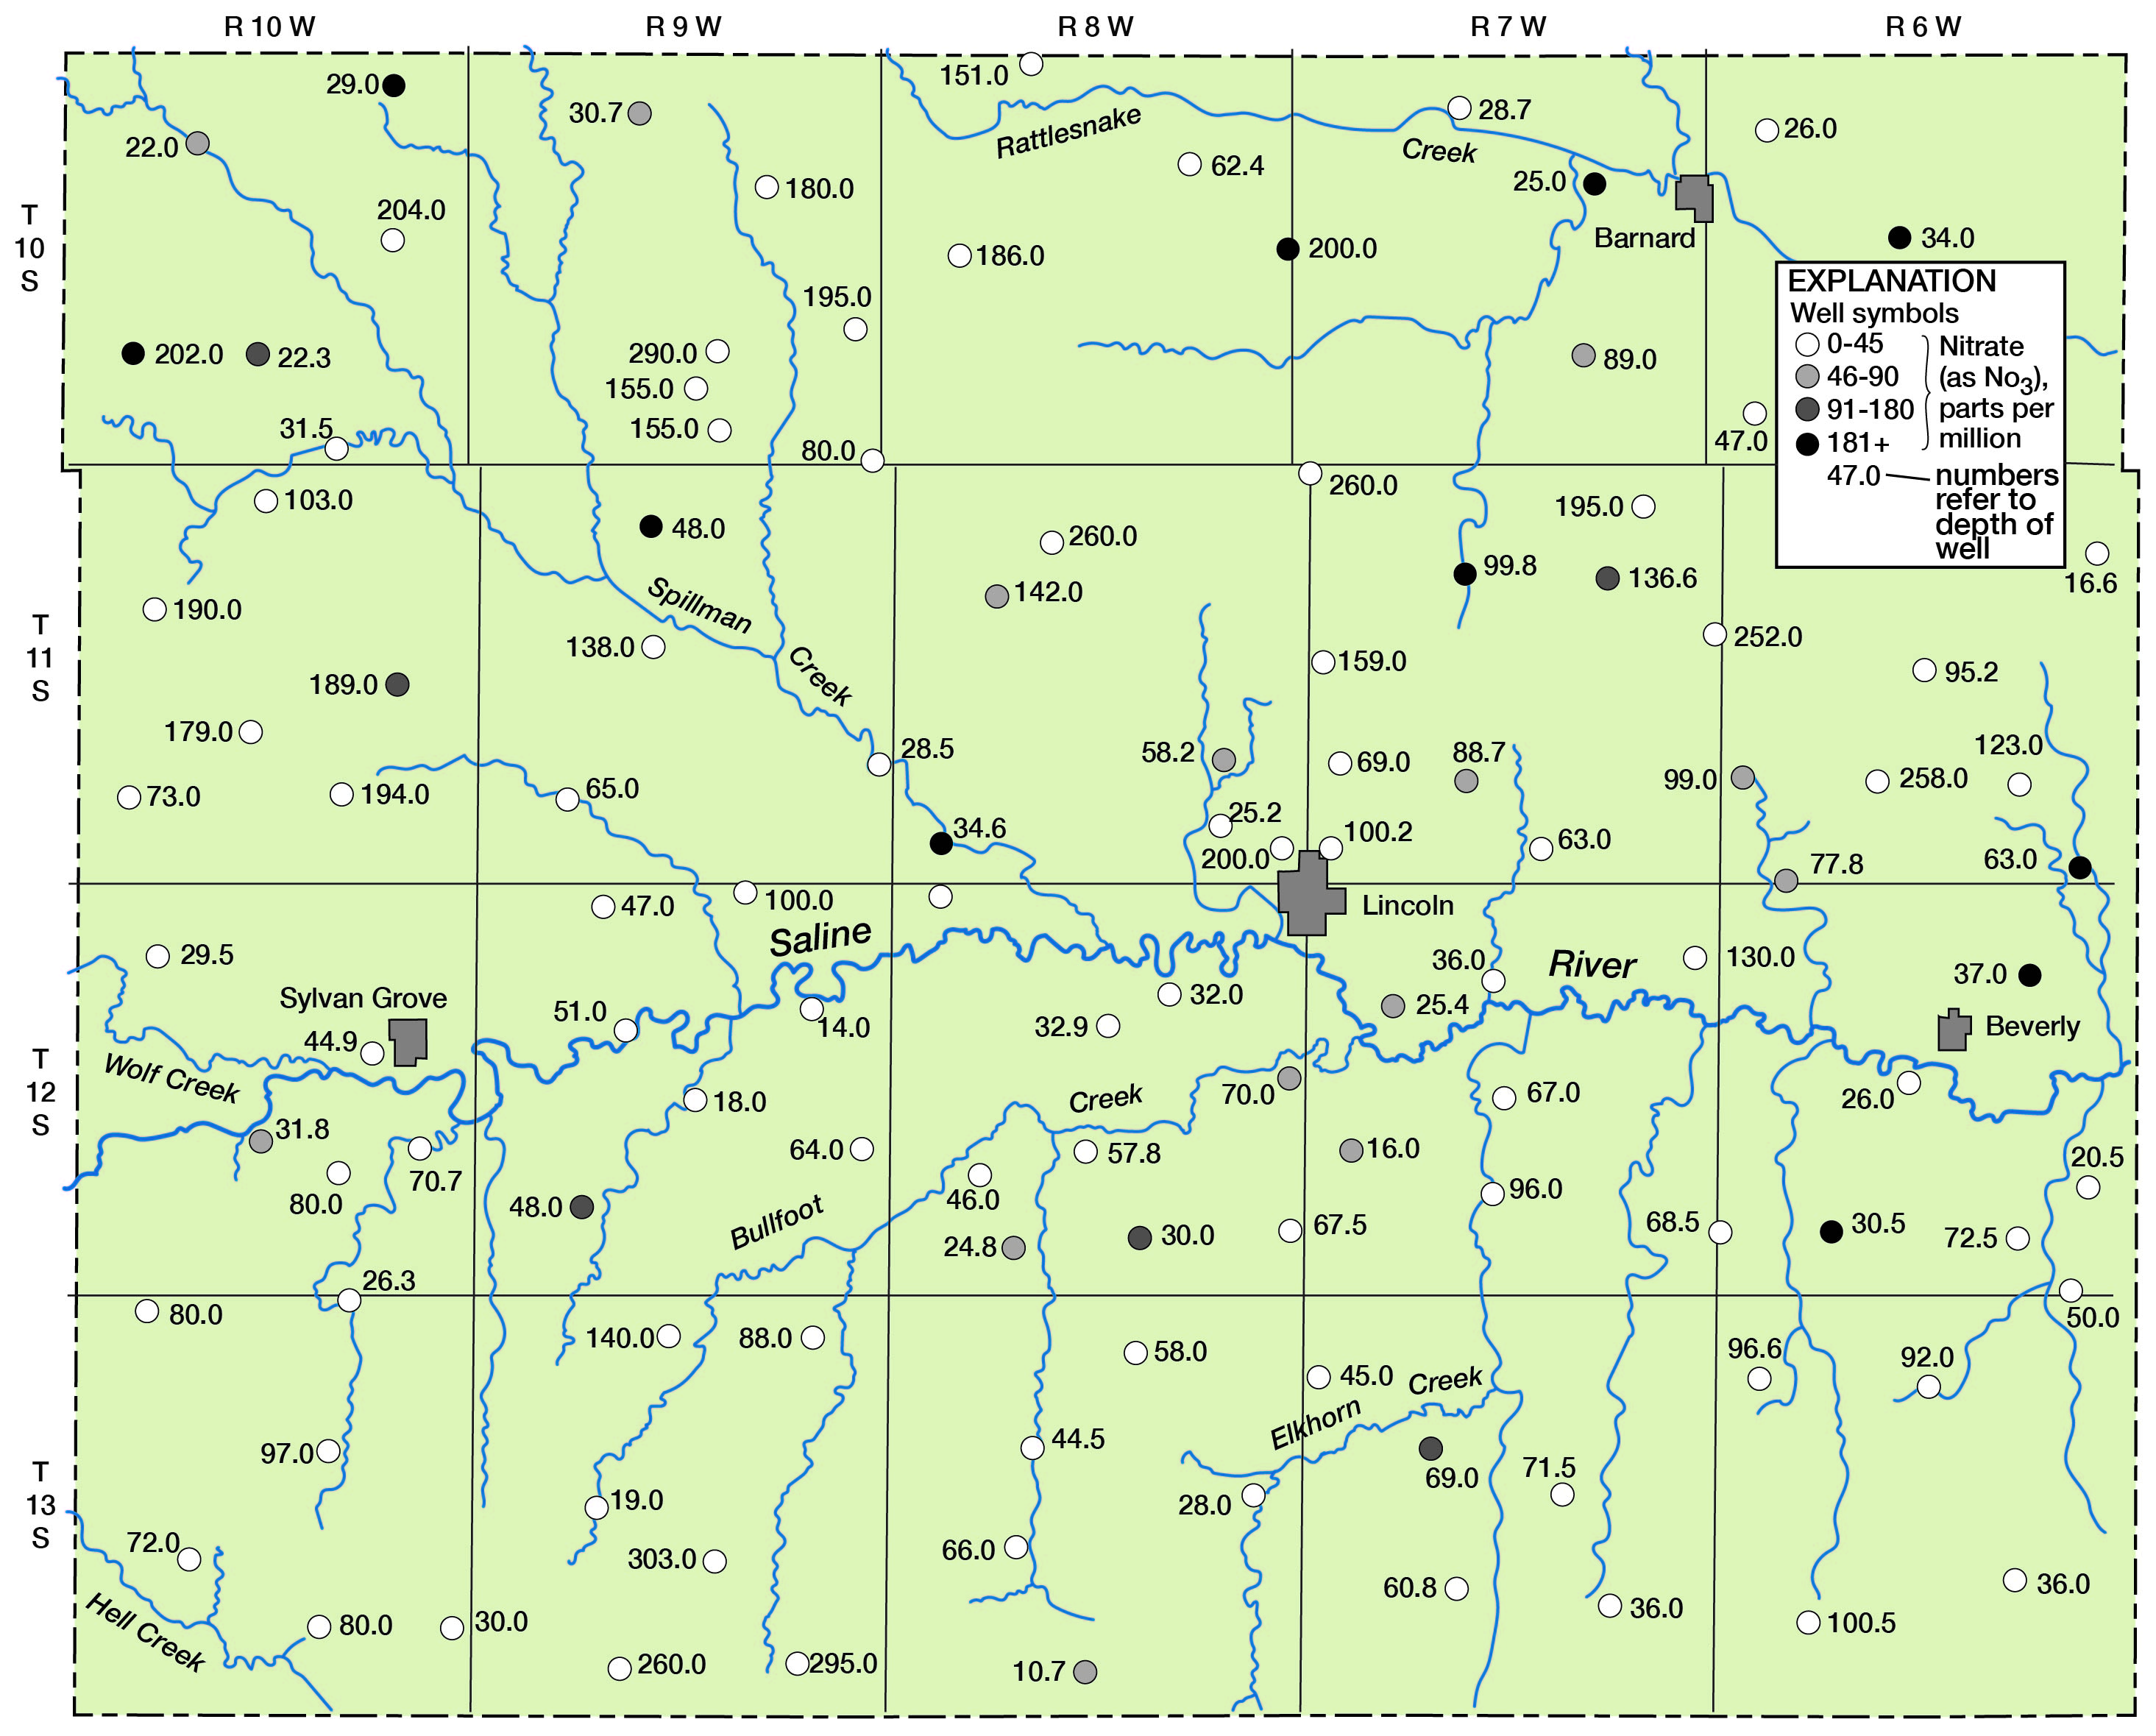
In correlating the concentration of nitrate with depth of the well, it was observed that the high-nitrate water was generally at depths less than 50 feet. Of 36 samples from wells in the Pleistocene deposits, 11 (about 31 percent) of the samples exceeded 45 parts per million nitrate (as NO3). Five samples had a nitrate content that exceeded 90 parts per million (Table 8).
Table 8--Number of samples from wells in Pleistocene deposits in Lincoln County as classified by nitrate concentrations.
| Depth of well, feet |
Number samples containing | Total | |||
|---|---|---|---|---|---|
| 0-45 ppm nitrate |
46-90 ppm nitrate |
91-180 ppm nitrate |
181+ ppm nitrate |
||
| 0-50 | 17 | 6 | 1 | 4 | 28 |
| 51-100 | 8 | 8 | |||
| Totals | 25 | 6 | 1 | 4 | 36 |
Of 80 analyses of water samples from the underlying Dakota formation (Table 9), 20 (about 25 percent) contained nitrate (as NO3) in excess of 45 parts per million and 12 (about 15 percent) contained more than 90 parts per million. Most of these were collected from depths of less than 50 feet, which indicates a possible relationship to surface drainage (Fig. 9).
Table 9--Number of samples from wells in the Dakota formation in Lincoln County, as classified by nitrate concentrations.
| Depth of well, feet |
Number samples containing | Total | |||
|---|---|---|---|---|---|
| 0-45 ppm nitrate |
46-90 ppm nitrate |
91-180 ppm nitrate |
181+ ppm nitrate |
||
| 0-50 | 10 | 1 | 2 | 4 | 17 |
| 51-100 | 22 | 6 | 1 | 1 | 30 |
| 101-150 | 7 | 1 | 1 | 9 | |
| 151-200 | 12 | 1 | 1 | 14 | |
| 201-250 | 1 | 1 | 2 | ||
| 251-300 | 7 | 7 | |||
| 300+ | 1 | 1 | |||
| Totals | 60 | 8 | 5 | 7 | 80 |
Figure 9--Nitrate in ground water in Lincoln County.
With relation to the chloride content of the water in the Pleistocene deposits, 23 of the 36 samples (approximately 64 percent) contained less than 50 parts per million (Table 10). Six had chloride that exceeded 250 parts per million; all samples except one that had more than 50 parts per million were obtained at depths less than 50 feet.
Table 10--Number of samples front wells in Pleistocene deposits in Lincoln County, as classified by chloride concentrations.
| Depth of well, feet |
Number samples containing | Total | |||
|---|---|---|---|---|---|
| 0-50 ppm chloride |
51-100 ppm chloride |
101-250 ppm chloride |
251+ ppm chloride |
||
| 0-50 | 16 | 4 | 3 | 5 | 28 |
| 51-100 | 7 | 1 | 8 | ||
| Totals | 23 | 4 | 3 | 6 | 36 |
Of the 80 chloride determinations on water from the Dakota formation, 48 (60 percent of the total) showed less than 50 parts per million (Table 11). Eight of the samples had chloride contents exceeding 250 parts per million; these were taken at various depths below 250 feet.
Table 11--Number of samples from wells in the Dakota formation in Lincoln County, as classified by chloride concentrations.
| Depth of well, feet |
Number samples containing | Total | |||
|---|---|---|---|---|---|
| 0-50 ppm chloride |
51-100 ppm chloride |
101-250 ppm chloride |
251+ ppm chloride |
||
| 0-50 | 8 | 7 | 2 | 17 | |
| 51-100 | 23 | 1 | 4 | 3 | 31 |
| 101-150 | 4 | 1 | 1 | 2 | 8 |
| 151-200 | 6 | 2 | 4 | 2 | 14 |
| 201-250 | 1 | 1 | 2 | ||
| 251-300 | 6 | 1 | 7 | ||
| 300+ | 1 | 1 | |||
| Totals | 48 | 12 | 12 | 8 | 80 |
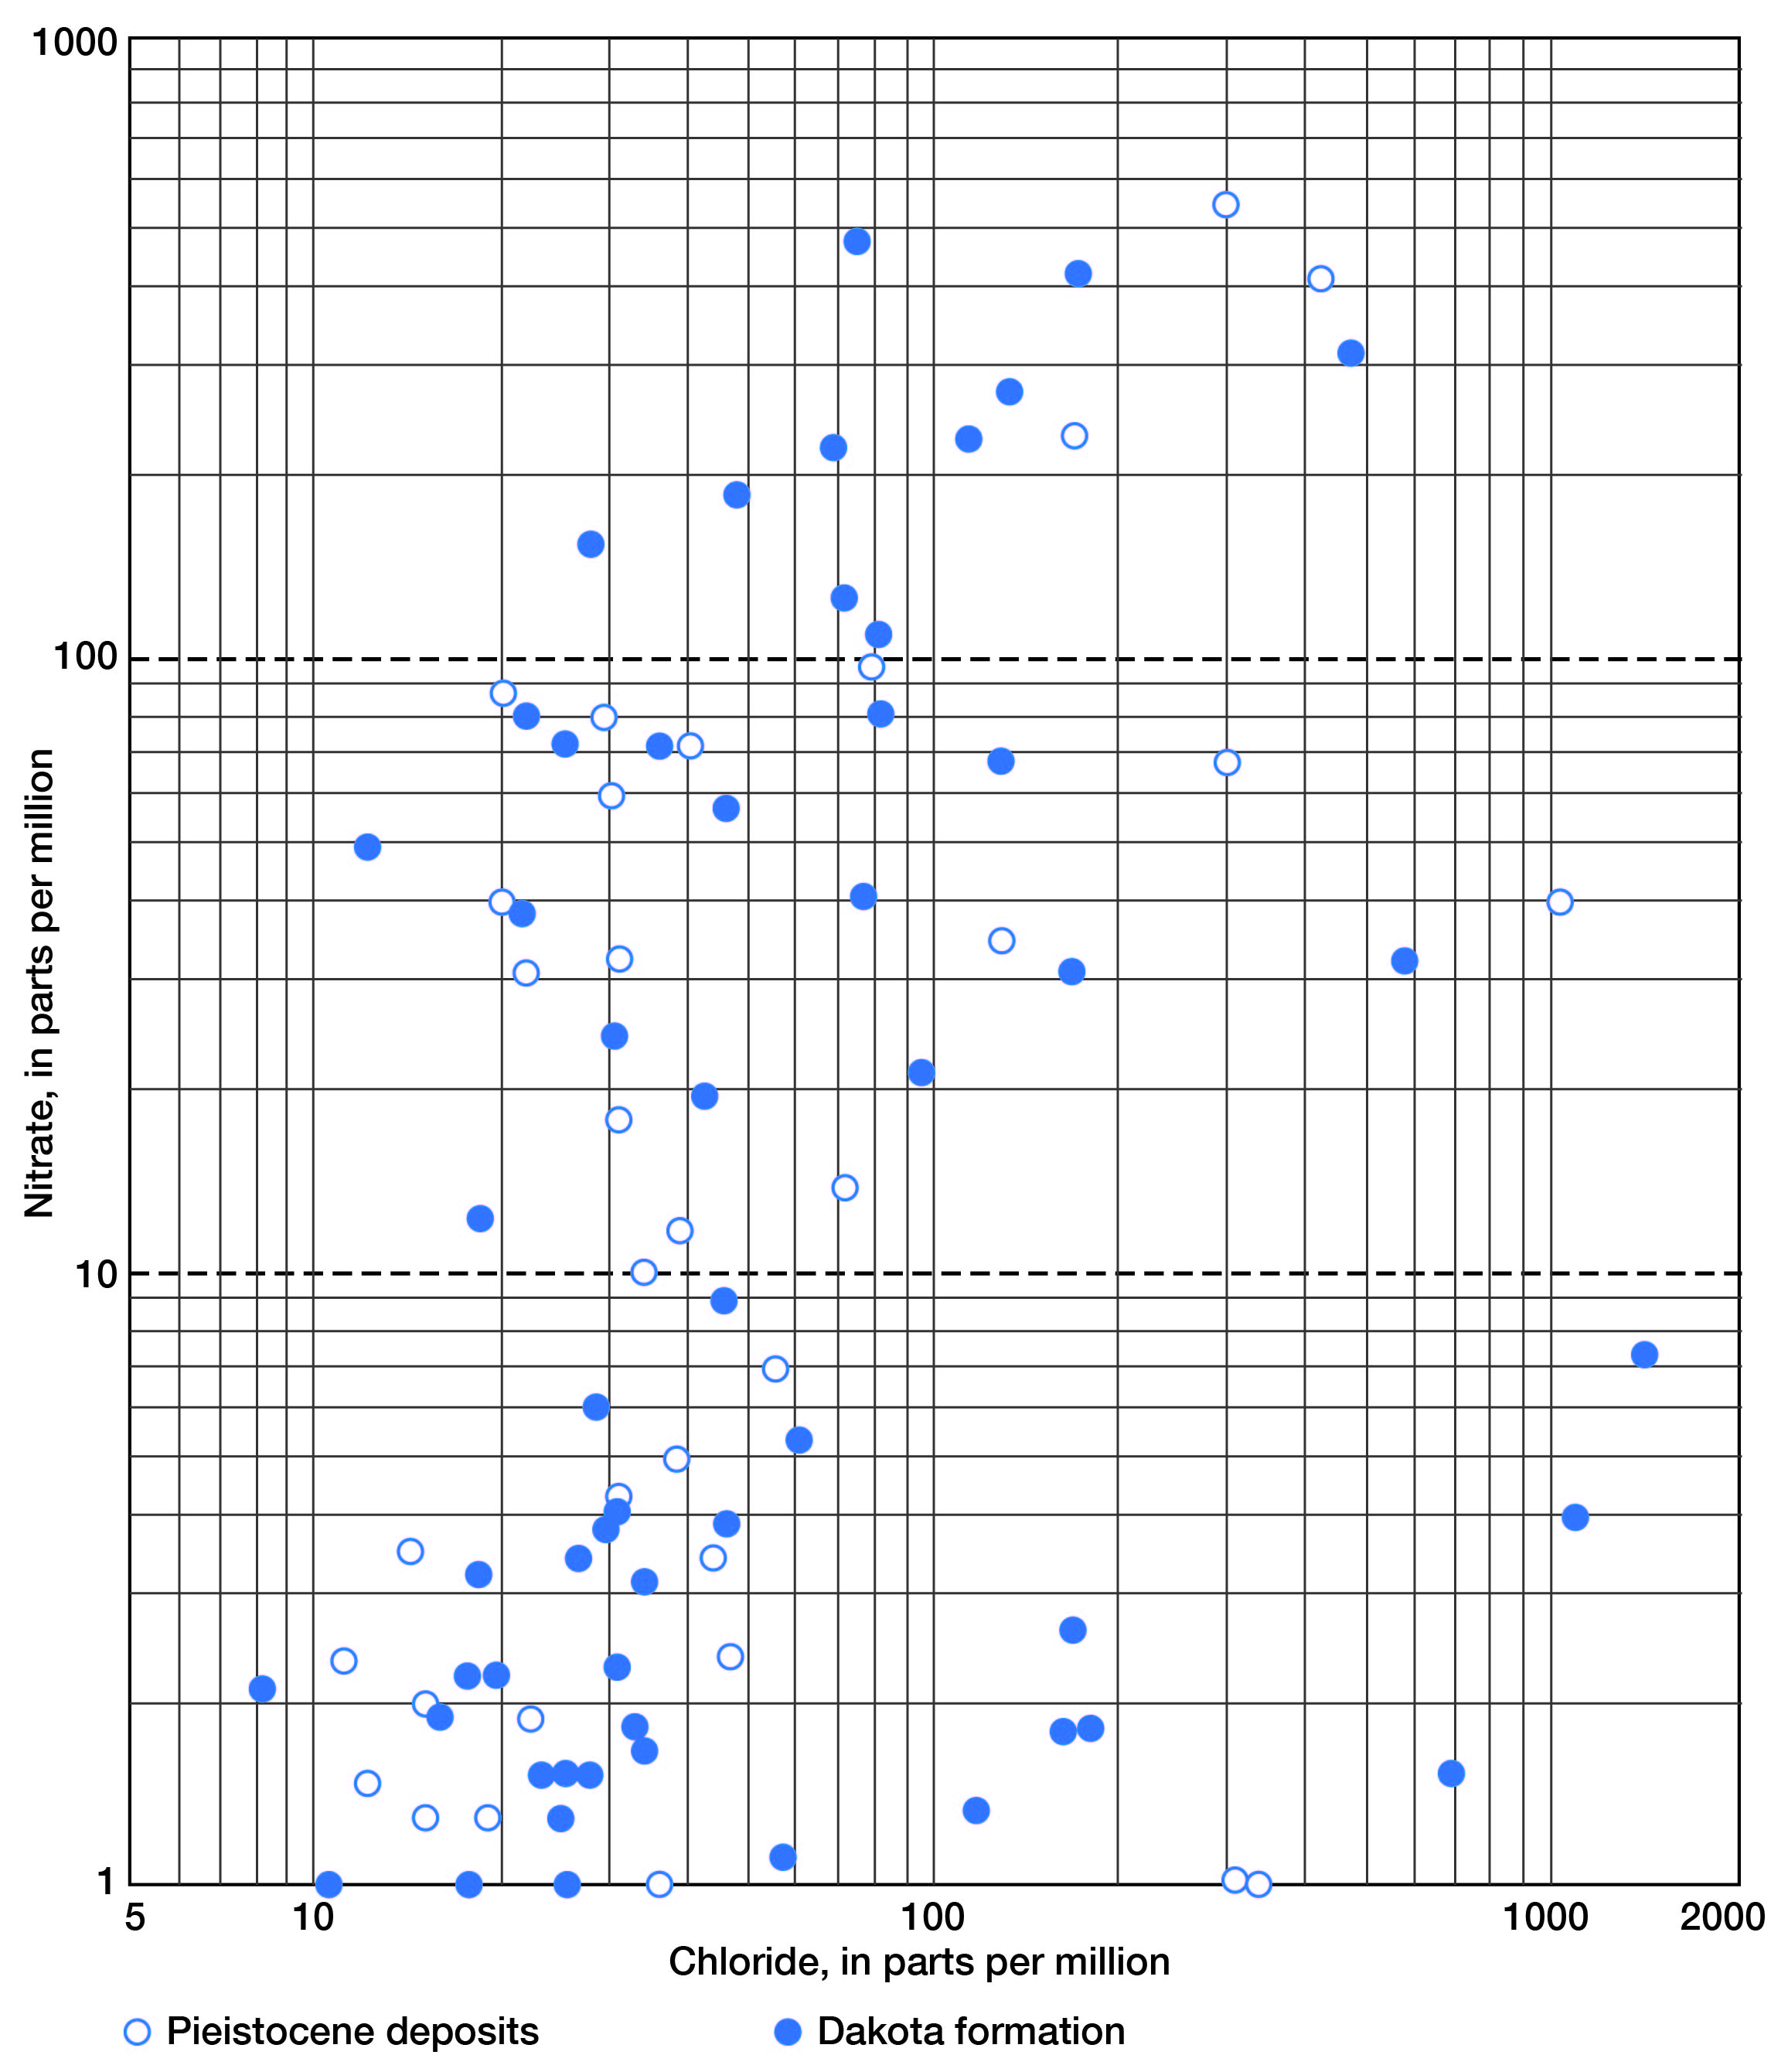
In Figure 10, nitrate (as NO3) is plotted against chloride for all samples. Above 10 parts per million nitrate (as NO3), which was arbitrarily selected as the threshold for above-normal concentrations of nitrate, a slight trend in increased nitrate with increased chloride can be observed. There is some indication, at least, that the chloride content in water from shallow wells, both in the Pleistocene deposits and in the Dakota formation, may be more closely related to surface pollution than to naturally occurring high-chloride waters that are known to be present in the upper part of the Dakota formation in some areas. The correlation is poor; however, the trend is significant.
Figure 10--Relation of chloride and nitrate in water from Pleistocene deposits and the Dakota formation in Lincoln County.
An examination of the data indicates that no particular diminution of chloride and nitrate occurs to depths of 200 feet. At greater depths, nine samples showed negligible quantities of nitrate, and quantities of chloride in most cases were less than 200 parts per million. Metzler and Stoltenberg (1950) have discussed high-nitrate content of ground water and its relation to construction of wells, water levels in wells, leaching of topsoil, and barnyard pollution. They conclude that a number of factors must be known in order to determine the cause of pollution and to insure safety from cyanosis. Among them are: (1) the effect of vegetation, soil conditions, and ground-water level on the nitrate content; (2) the depth to which a properly constructed well must be extended to assure its freedom from nitrate pollution; and (3) the area of nitrate pollution, which is so extensive in some localities that it cannot be explained satisfactorily as by seepage from barnyards and similar places.
Chloride as Related to Ground- and Surface-water Drainage
Some concept of the distribution of chloride in water in the county can be observed in Figure 11, in which chloride content is shown diagrammatically. Seemingly, a greater distribution of high-chloride water occurs in the area north of Saline River that is drained by Spillman Creek and Rattlesnake Creek; however, a large percentage of the samples in this area were obtained from relatively deep wells in the Dakota formation.
Figure 11--Chloride in ground and surface water in Lincoln County.
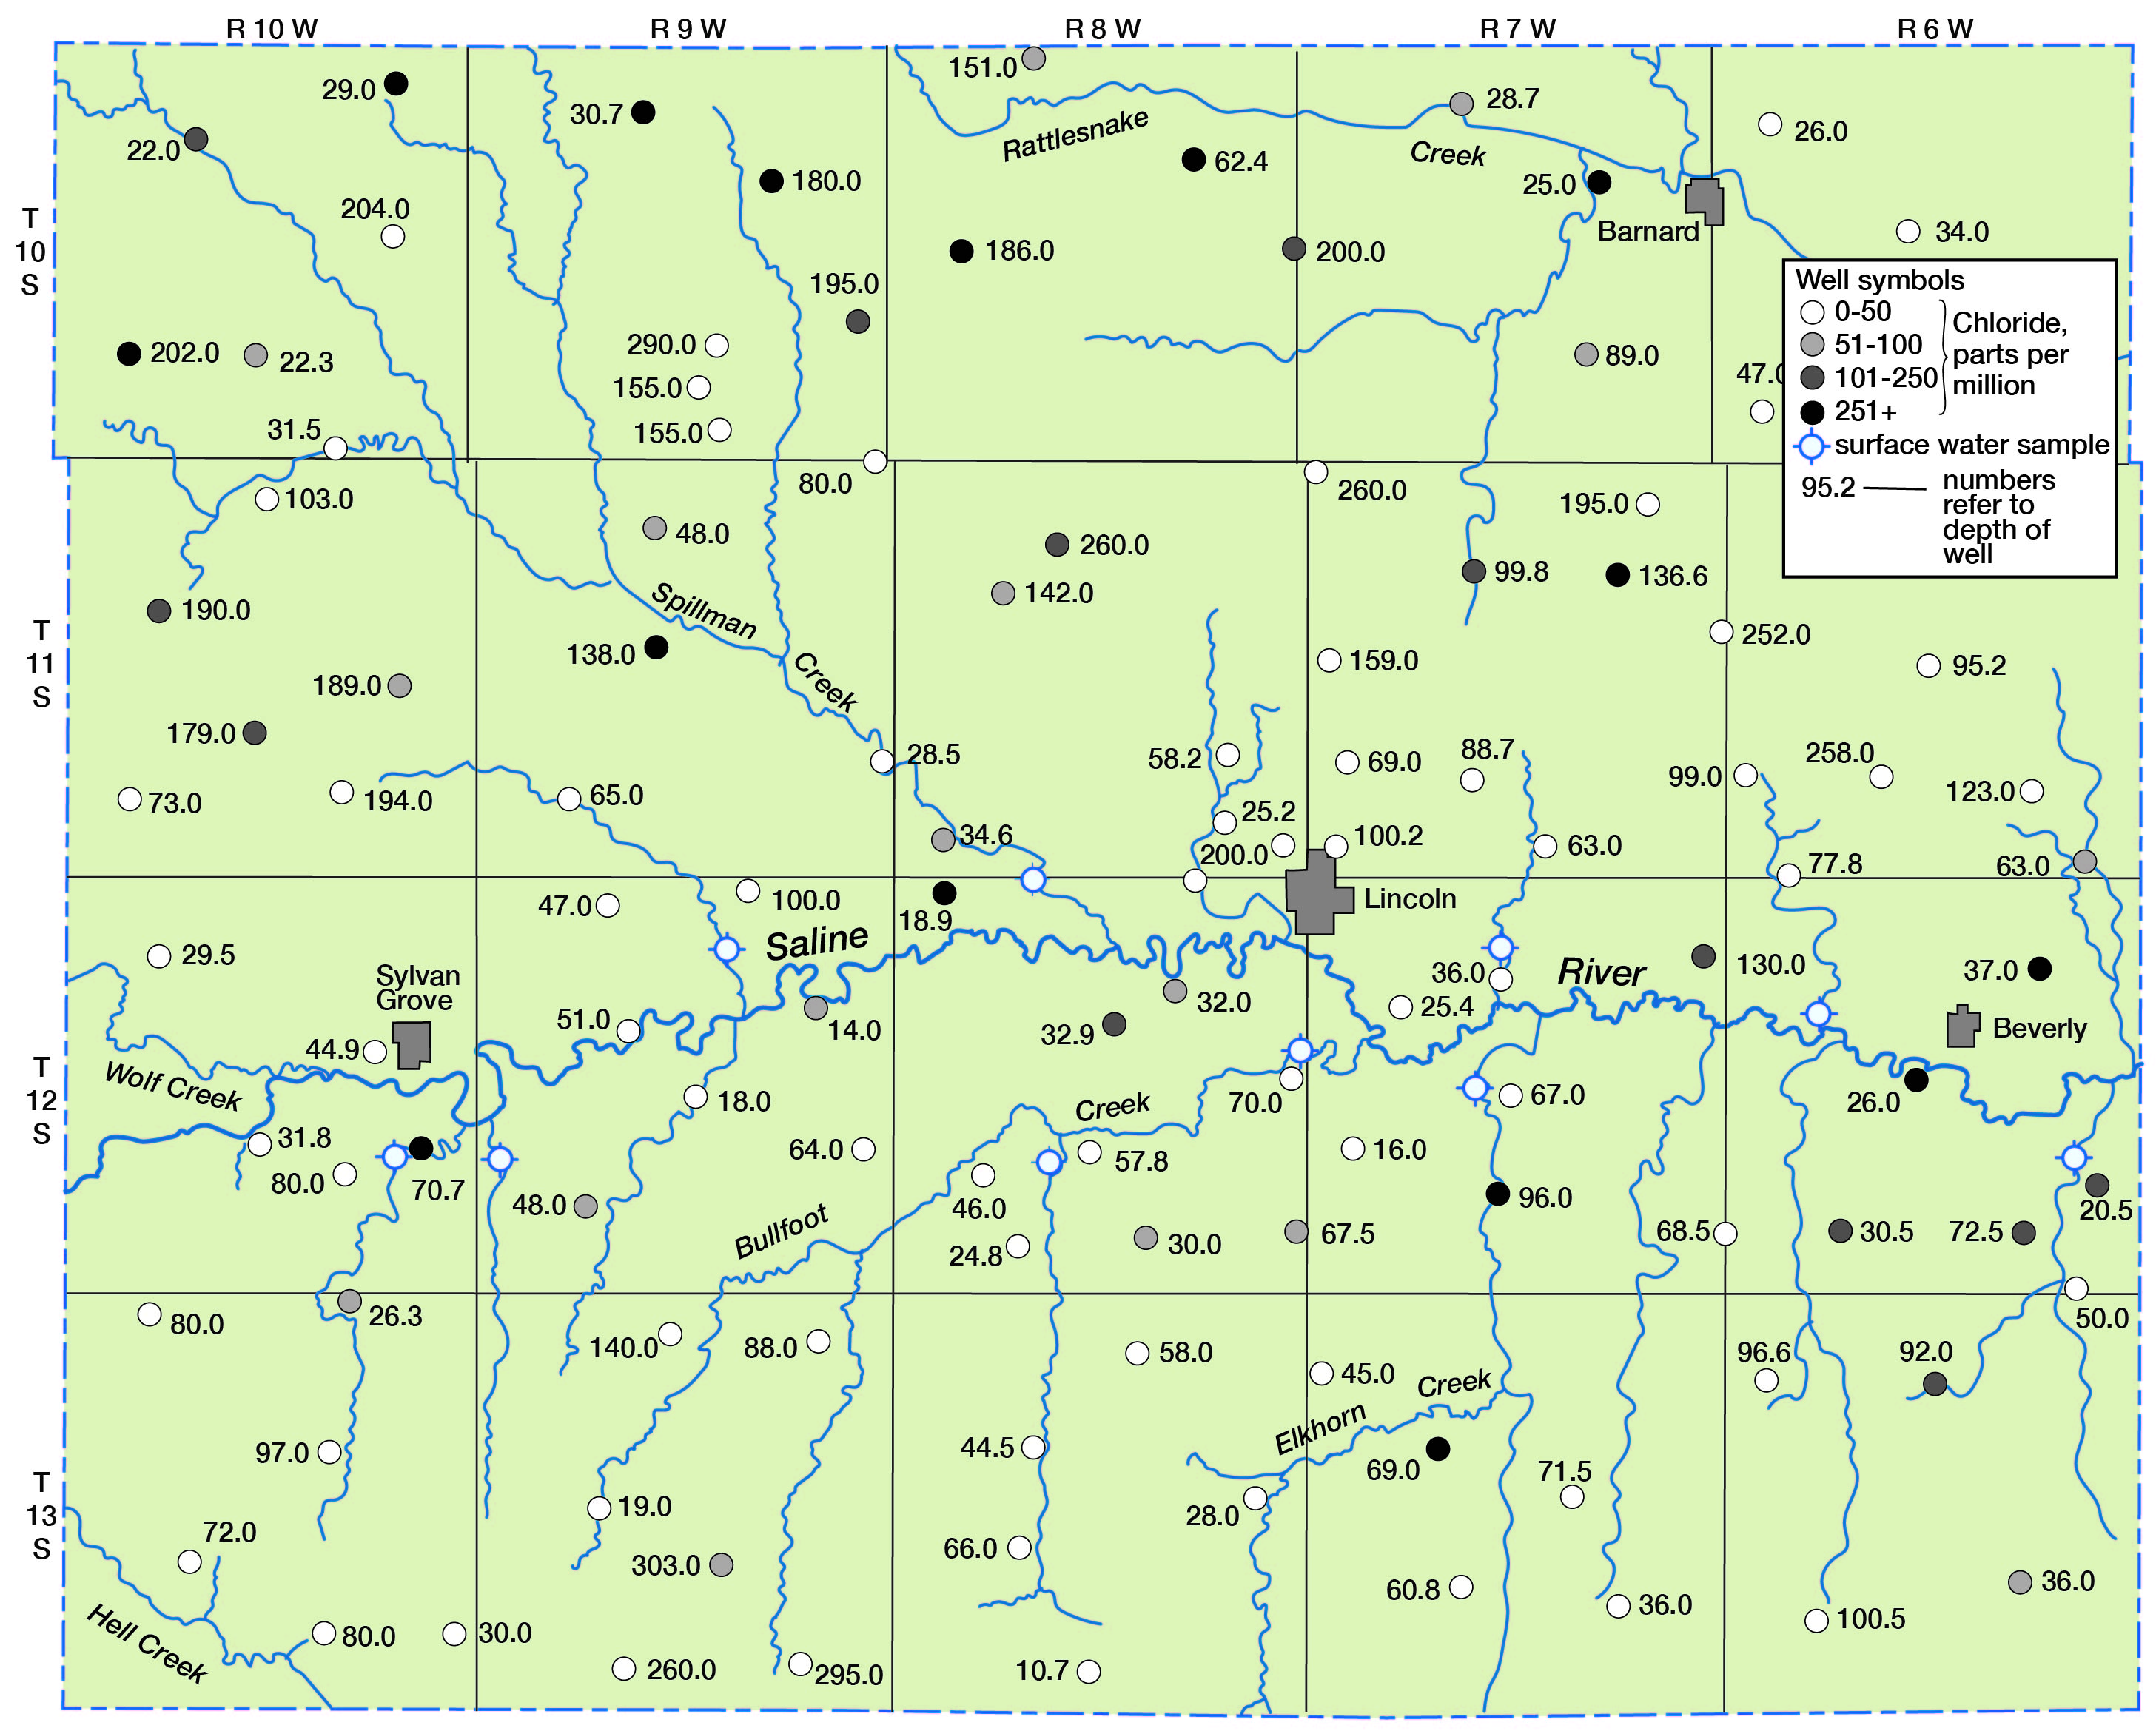
The chloride content of surface water in Lincoln County correlates well with the particular stratigraphic units that are drained. The water in Saline River, which is the major stream in the area, may have more than 2,500 parts per million of dissolved solids, largely as sodium chloride (Durum, 1950, p. 41) during low flow at Tescott, which is a few miles downstream from Lincoln. Most of this mineralization is believed to be acquired from ground and surface waters upstream from Lincoln County and from Wolf Creek, which flows into Saline River at the western edge of the county. Wolf Creek has a deep-cut channel and receives highly mineralized ground water, probably from the Dakota formation. At a base flow of 0.6 second-foot, the dissolved solids content of the water was 4,630 and the chloride content was 2,000 parts per million. In contrast, base-flow water of intermittent streams tributary to Saline River east of Wolf Creek is generally more dilute, as indicated in Table 12. For example, analysis of base flow of West Twin Creek, which drains Pleistocene deposits south of Saline River, showed a dissolved solids content of 698 parts per million and a chloride content of 66 parts per million.
Table 12--Analyses of several mineral constituents in streams tributary to Saline River in Lincoln County (in downstream order).
| Creek | Date | Discharge, in sec.-ft.* |
Dissolved solids (ppm) |
Chloride (ppm) |
Percent sodium |
|---|---|---|---|---|---|
| Wolf Creek near Sylvan Grove | Oct. 2, 1948 | 0.6 | 4,630 | 2,000 | 85 |
| West Twin Creek near Sylvan Grove |
May 2, 1950 | 1.0 | 698 | 66 | 30 |
| East Twin Creek near Sylvan Grove |
May 2, 1950 | 1.0 | 514 | 28 | 29 |
| Unnamed Creek, 1-1/2 miles west of Vesper |
May 5, 1950 | 1.0 | 158 | 0.6 | 10 |
| Spillman Creek near Lincoln | May 2, 1950 | 1.0 | 808 | 174 | 52 |
| Lost Creek near Lincoln | May 2, 1950 | 1.0 | 548 | 42 | 29 |
| Spring Creek near Lincoln | May 2, 1950 | 1.0 | 540 | 37 | 29 |
| Bullfoot Creek | May 5, 1950 | 1.5 | 700 | 140 | 53 |
| Beaver Creek, 2-1/2 miles east of Lincoln |
May 5, 1950 | 1.0 | 778 | 39 | 47 |
| Twelve Mile Creek, 4/5 mile east of Shady Bend |
May 5, 1950 | 1.0 | 534 | 21 | 43 |
| Elkhorn Creek near Lincoln | May 2, 1950 | 1.0 | 780 | 49 | 31 |
| Table Rock Creek near Beverly | May 2, 1950 | 1.0 | 933 | 142 | 44 |
| * Estimated, except that of Wolf Creek. | |||||
These data indicate that the water is representative of drainage from Pleistocene deposits, and are supported by most results of chloride analysis of water from shallow wells along the main streams and tributaries (Fig. 11). Unusually high concentrations of chloride in water in the Pleistocene deposits, such as are found in the eastern half of T. 12 S., R. 6 E., can probably be attributed to contamination from underlying deposits whose water drains to the stream channel.
Relation of Quality of Water to Use
Domestic
A tabulation of the 116 samples that were collected from wells in the area establishes the following uses for the various supplies:
| Use | Number of wells |
Percent |
|---|---|---|
| Domestic | 18 | 15.5 |
| Stock | 37 | 31.9 |
| Domestic and stock | 55 | 47.4 |
| None | 6 | 5.2 |
| Total | 116 | 100.0 |
These data show that about 63 percent of the supplies have some domestic use. This fact is particularly pertinent in that approximately 27 percent of the wells sampled have a nitrate (as NO3) content that exceeds 45 parts per million. This emphasizes the importance of existing educational programs in Kansas relating to quality of domestic water supplies.
Fourteen water samples (about 12 percent of those analyzed) each had a chloride content that exceeded 250 parts per million, the upper limit recommended by the U. S. Public Health Service. Where more suitable supplies are available, the chemical substances that may be present in natural or treated waters preferably should not exceed the following quantities:
| Constituent | Maximum parts per million |
|---|---|
| Iron and manganese (together) | 0.3 |
| Magnesium | 125 |
| Sulfate | 250 |
| Fluoride | 1.5 |
| Chloride | 250 |
| Dissolved solids | 500 (1,000 permitted) |
In addition, limits are placed on the quantities of lead, arsenic, hexavalent chromium, selenium, copper, zinc, and phenol. However, the quantities of these substances usually are not determined in routine analyses by the Geological Survey. With respect to physical requirements, the water must be low in turbidity and should have no objectionable taste or odor.
Of the 25 samples known to be from the two stratigraphic units of which more complete analyses were made in connection with this study, the number in which the chemical substances exceeded the recommended upper limits are as follows:
| Constituent | Pleistocene deposits |
Dakota formation |
|---|---|---|
| Total samples analyzed | 9 | 16 |
| Iron and manganese (together) | 8 | 16 |
| Magnesium | 0 | 0 |
| Sulfate | 3 | 4 |
| Fluoride | 0 | 3 |
| Chloride | 1 | 2 |
| Dissolved solids | 3 | 7 |
The results given above indicate that troublesome quantities of iron are present in water in both shallow and deep wells. For the water in the Dakota formation, eight of the samples had iron in excess of 5 parts per million. The quantities of magnesium in all samples were relatively low. Excessive amounts of sulfate were found in eight of the samples, most of these being from the eastern half of the county. Samples from three wells in the Dakota formation had 1.7, 2.8, and 2.4 parts per million fluoride, and the concentrations appeared to increase somewhat with depth. Nearly half of the waters from the Dakota formation exceeded 1,000 parts per million dissolved solids.
Municipal
Water supplies from Barnard, Lincoln, and Sylvan Grove were inventoried, and analyses by the Kansas State Board of Health (personal correspondence) indicate that the water at both Lincoln and Sylvan Grove is of moderately low mineral content but is hard. The Lincoln supply is effectively softened from nearly 500 to less than 200 parts per million hardness, and the amounts of iron and manganese in the finished water are negligible.
The Barnard supply, which is obtained from a well 60 feet deep in the alluvium, is of poor quality (Table 13). The water is hard and contains nearly 2,100 parts per million of dissolved solids. Sodium and chloride are predominant constituents, and objectionable amounts of iron and manganese are present.
Table 13--Analyses of water supplies for the cities of Barnard, Lincoln, and Sylvan Grove.
| Constituent | Barnard1 | Lincoln2 | Sylvan Grove3 | |
|---|---|---|---|---|
| 3-10-1951 | 11-28-1949 (raw) |
8-21-1950 (treated) |
11-27-1950 | |
| Calcium | 91 | 165 | 57 | 108 |
| Magnesium | 33 | 15 | 13 | 11 |
| Sodium | 657 | 70 | 112 | 38 |
| Bicarbonate | 744 | 320 | 105 | 337 |
| Sulfate | 260 | 264 | 262 | 46 |
| Chloride | 640 | 46 | 45 | 40 |
| Nitrate | 8.4 | 27 | 20 | 20 |
| Fluoride | 0.6 | 0.3 | 0.3 | 0.1 |
| Iron | 0.48 | 2.2 | 0.10 | 0.15 |
| Manganese | 0.14 | 0.7 | 0 | 0 |
| Hardness | 362 | 473 | 196 | 314 |
| Dissolved solids | 2,100 | 791 | 590 | 467 |
| 1. From well, 60 feet deep, in alluvium. 2. From two wells, both 80 feet deep. One well draws water from the alluvium, the other from the Dakota formation. 3. From two wells. One well, 70 feet deep, draws water from the terrace deposits, the other, 68 feet deep, from the Dakota formation. |
||||
Irrigation
None of the wells sampled or inventoried is presently used for irrigation other than for lawns or gardens. As discussed previously in this report, the available ground-water supplies are generally adequate only for small irrigation projects. However, because of the variable quality of water in the county, the individual supplies should be carefully evaluated prior to application of the water to the lands. At least three factors should be considered in estimating the water quality (Wilcox, 1948, p. 25): (1) the total concentration of dissolved solids; (2) the percentage of sodium; and (3) the quantity of boron. Each must be considered with respect to other factors, such as soil composition, permeability, drainage, irrigation practices, and crop tolerances.
Continuous use of water high in dissolved solids may increase the salinity of the soil solution, which may ultimately affect the permeability of the soil and disturb plant growth.
Experience has shown that irrigation water containing a high percentage of sodium may cause dispersion of soil particles and may retard water and air movement through the soil. In addition to soil and drainage conditions, the amount and type of other constituents in the water and soil, such as calcium carbonate and gypsum, are important in establishing the permissible limits of sodium in the irrigation water. If the concentration of dissolved solids is low, a higher percentage of sodium is tolerable for a soil that is coarse-textured, calcareous, permeable, and well-drained than for a soil that is very tight.
A diagram proposed by Wilcox (1948, p. 26) is used to illustrate the suitability of water in Lincoln County for irrigation (Fig. 12). The water classes are determined by the quantity of mineral substances as indicated by the specific conductance (or equivalents per million) and the percentage of sodium. In general, the water takes a progressively lower classification as the mineralization and percentage of sodium increase.
Figure 12--Classification of water for irrigation use in Lincoln County (after Wilcox, 1948).
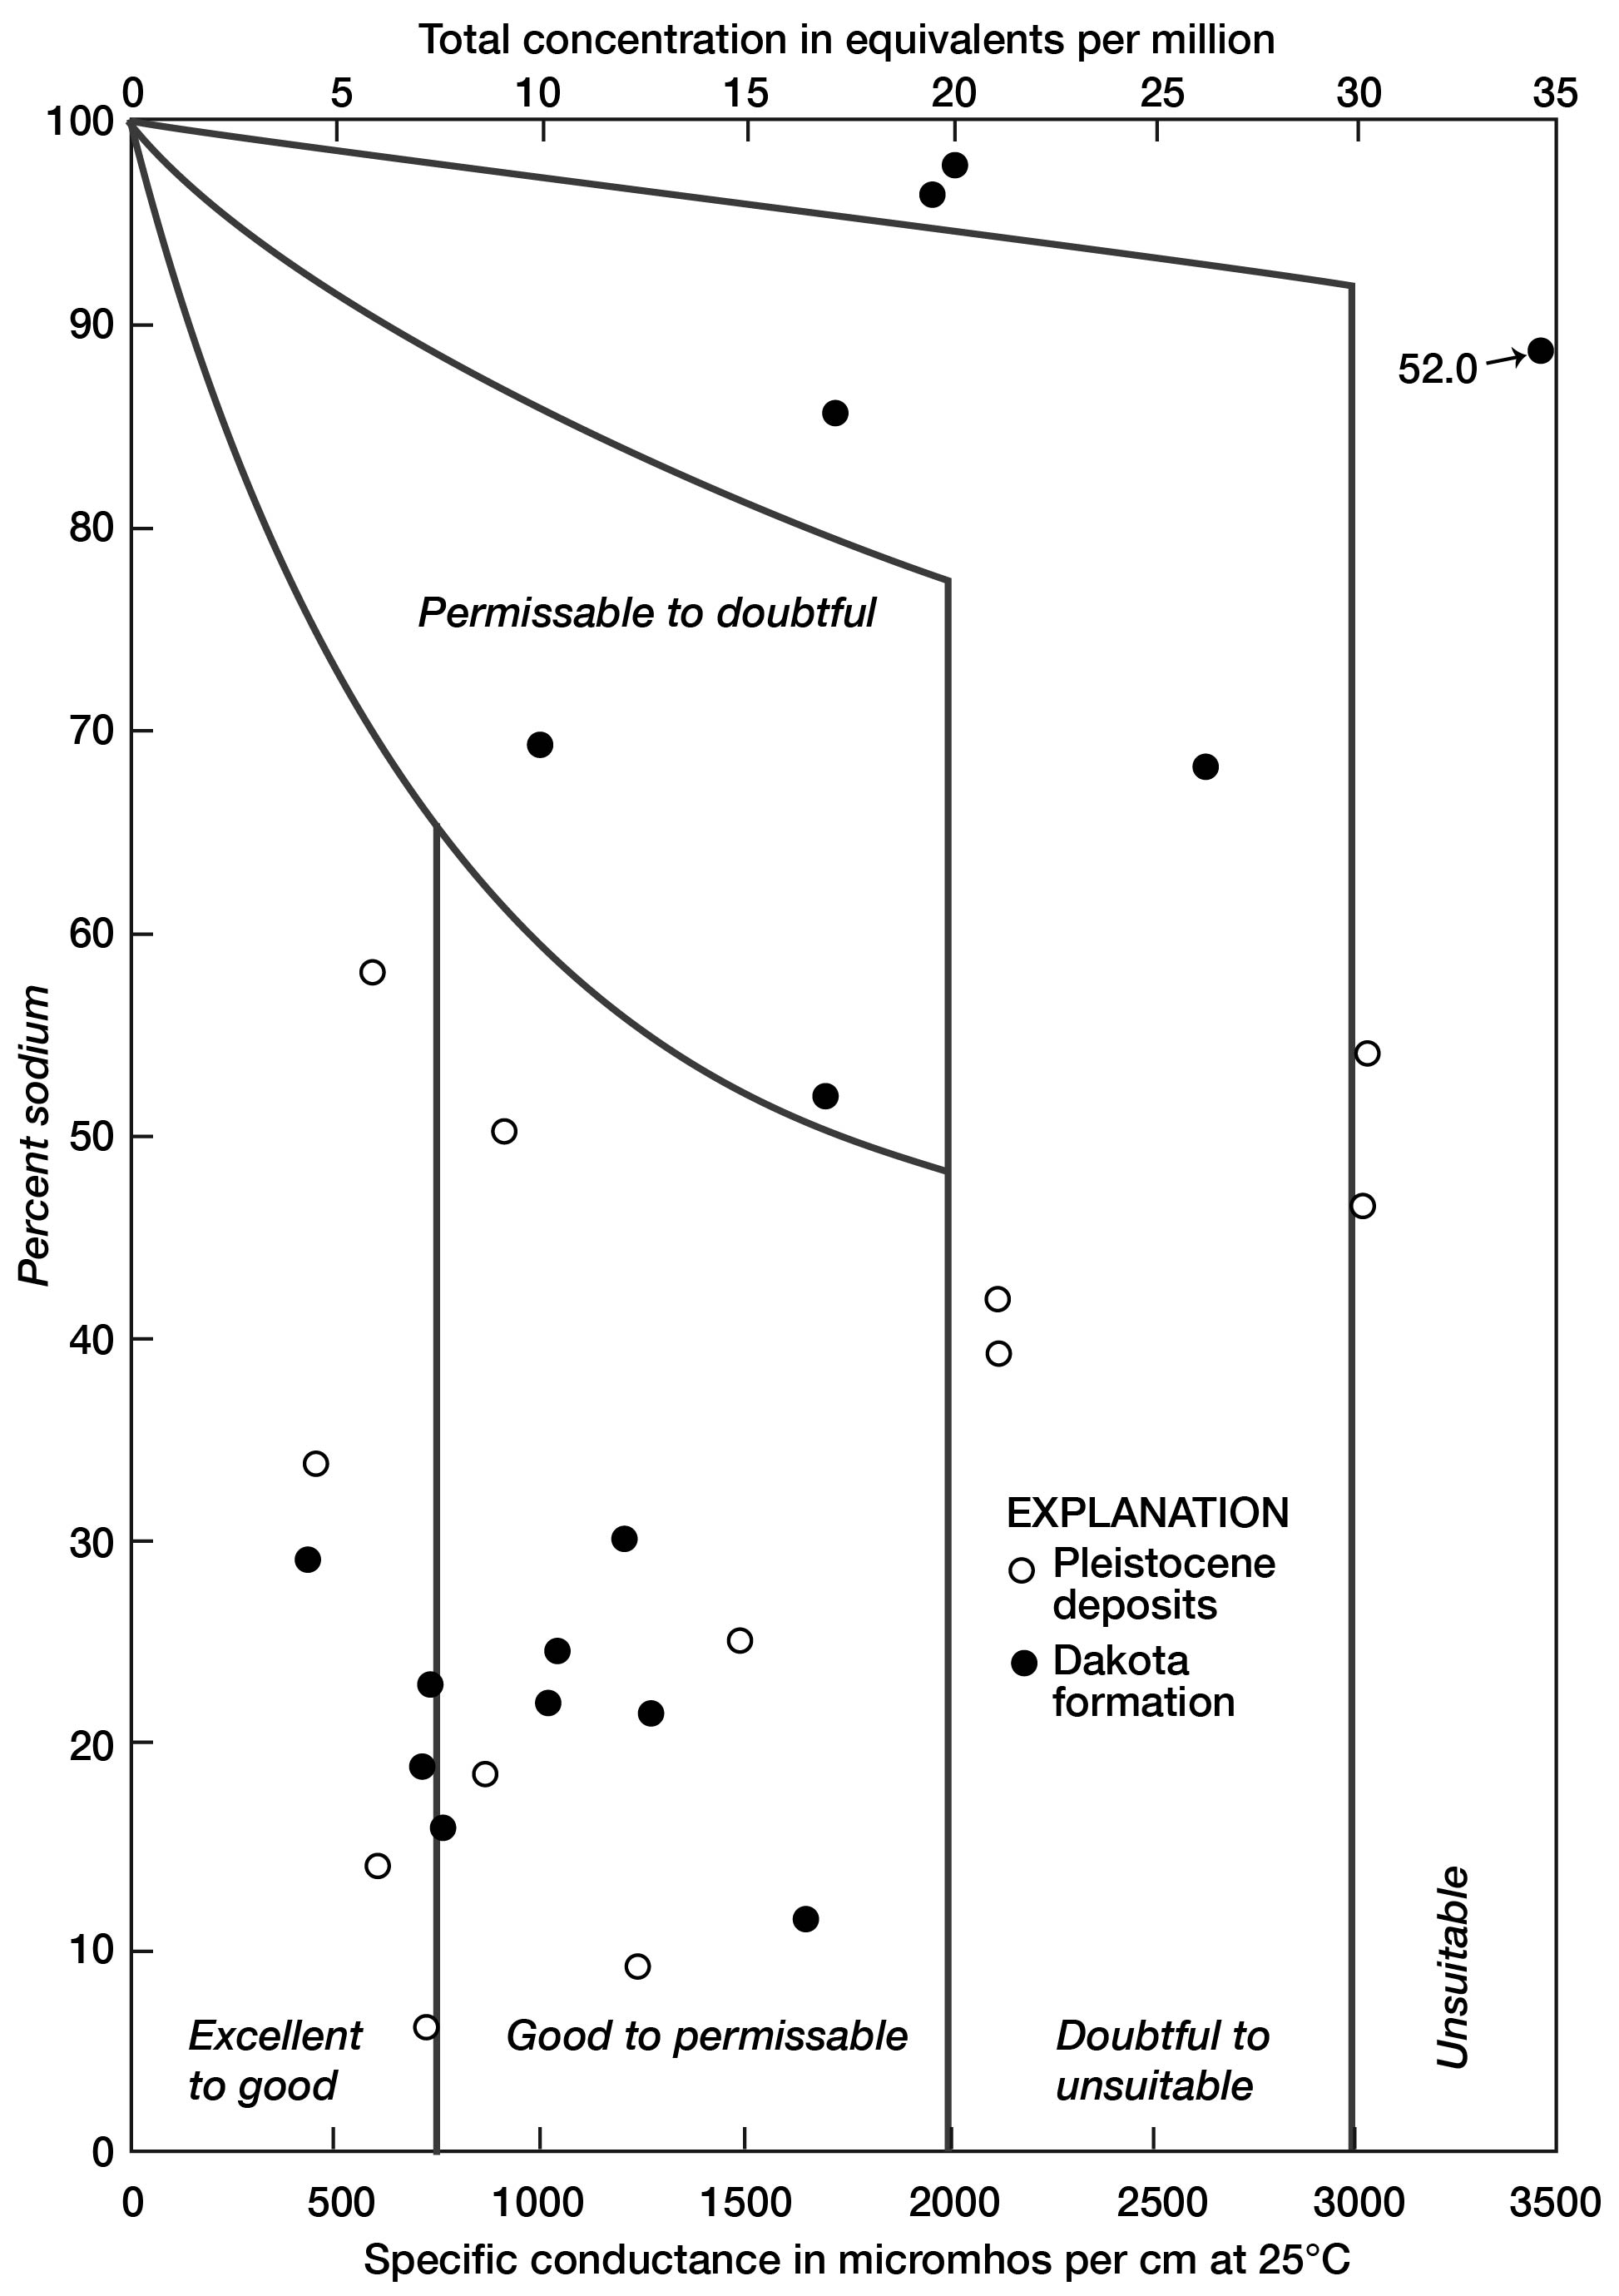
The water in the county varies widely in composition, as shown by representation in all classes. Seventeen samples, however, rate at least "good to permissible." Unsatisfactory water in the Pleistocene deposits is so designated largely by reason of a high content of dissolved solids, whereas water of poor quality in the Dakota formation has a high percentage of sodium.
Summary of Quality of Ground Water
Water examined in this study was essentially from three geologic sources: alluvium, Sanborn formation, and Dakota formation. In the five samples obtained from the alluvium the dissolved solids ranged from 409 to 2,940 parts per million, and the water was hard; the hardness (as CACO3) ranged from 136 to 1,300 parts per million. Dilute water is the calcium bicarbonate type, whereas the concentrated water is essentially the sodium chloride type. Saline water from the Dakota formation may be draining into the alluvium in some parts of the area; high concentrations of nitrate are common in water from many wells in the alluvium-an indication of surface pollution.
All water samples obtained from the Sanborn formation were hard, the hardness (as CACO3) ranging from 151 to 724 parts per million. Although only four samples were obtained from wells in the Sanborn formation, they represented on the average, the better-quality water in the area.
By comparison with water in the Pleistocene deposits, those samples obtained from the Dakota formation were generally lower in calcium, and they were softer. Sodium and chloride were frequently more prominent than in water from Pleistocene deposits; however, the dissolved solids in the Dakota formation generally ranged from approximately 400 to 1,200 parts per million. Fluoride is commonly more prominent in water of the Dakota formation, and some evidence is present that fluoride increases with the depth of the well.
Data obtained from chloride and nitrate determinations of 116 samples indicate that in approximately 31 percent of the samples from Pleistocene deposits the nitrate (as NO3), exceeds 45 parts per million, whereas in approximately 25 percent of the samples from the Dakota formation nitrate exceeds 45 parts per million. The average chloride and nitrate concentrations in Pleistocene deposits and in the Dakota formation are similar. No particular diminution of chloride or nitrate occurs to depths of 200 feet.
The chloride content of streams tributary to Saline River correlates well with the drainage pattern. Wolf Creek, which has a deeply cut channel, discharges highly mineralized water at base flow, at which period the chloride content may exceed 2,000 parts per million. In contrast, base-flow water of most intermittent streams tributary to Saline River east of Wolf Creek is generally more dilute.
Prev Page--Geomorphology || Next Page--Well Records
Kansas Geological Survey, Geology
Placed on web March 5, 2009; originally published July, 1952.
Comments to webadmin@kgs.ku.edu
The URL for this page is http://www.kgs.ku.edu/General/Geology/Lincoln/06_gw.html