![]()
Prev Page--Structure || Next Page--Summary
Ground Water
Principles of Occurrence
The rocks and surficial deposits that form the crust of the earth are not solid throughout but contain many openings, called voids or interstices. It is in these spaces that water is found beneath the surface of the earth and it is from them that water is recovered through wells and springs. There are many types of rocks, and they differ greatly in the number, size, and arrangement of their interstices and, therefore, in their water-bearing properties.
The interstices of rocks in Cowley County range in size from pores of microscopic dimensions to openings. several inches in width. These can be divided into primary and secondary interstices. Primary, or original, interstices, are the pore spaces between the rock grains and were formed during the deposition of the rocks. Secondary interstices are the joints, open bedding planes, and solution channels that were developed by the different processes that affected the rock after deposition. In Cowley County all the water-bearing rocks are of sedimentary origin and contain both primary and secondary interstices.
The amount of water that can be stored in any rock depends upon the porosity of that rock. Porosity is expressed as the percentage of the total volume of the rock that is occupied by interstices. When all the interstices in a rock are filled with water, the rock is said to be saturated. The amount of water that a saturated rock will yield to the force of gravity is known as the specific yield. The amount of water a rock can hold is determined by its porosity, but the amount of water that the rock can yield to wells is determined by its specific yield. The rate at which a rock will yield water to a well is determined by its permeability, i. e., its ability to transmit water under a hydraulic gradient, which is the measured rate at which a rock will transmit water through a given cross section under a given loss of head per unit of distance. Some beds of clay or shale may be porous, but because the interstices are small and poorly connected, they transmit little or no water, and the rock may be regarded as virtually impermeable. Rocks differ greatly in their degree of permeability, according to the number, size, and interconnection of their interstices.
Source
Water in the open pores or interstices of the rocks below the surface of the earth, in the zone that is completely saturated, is called ground water. In Cowley County, ground water is derived from precipitation, in the form of rain or snow, which falls on the county or on nearby areas. Part of the precipitation leaves the area as surface runoff discharged by streams, part evaporates, and part is transpired by vegetation into the atmosphere. The part that escapes direct surface runoff, evaporation, and transpiration moves slowly downward through the soil and underlying strata until it reaches the zone of saturation. After reaching the ground-water body, the water percolates slowly through the rocks in a direction determined by the geology, topography, and geologic structure, until it is discharged through wells and springs, or by evaporation and transpiration in areas where the water table is. relatively near the land surface, or is discharged into a stream or other body of water.
When the upper surface of the zone of saturation is in a permeable rock, this surface is called the water table, and the water is under water-table conditions. If the upper surface is in an impermeable rock, water will rise in a drill hole above the level of the saturated permeable rock, and the water is then under artesian conditions. The level at which water stands in an open hole under artesian conditions is not a water table but is a piezometric surface. In Cowley County ground water occurs under both artesian and water-table conditions.
Artesian Conditions
In much of the eastern two-thirds of Cowley County, where the interbedded limestones, sandstones, and shales of Permian and Pennsylvanian age crop out, the ground water generally occurs under artesian conditions. No artesian wells flow in this area, but the hydrostatic pressure in many wells is sufficient to raise the water above the point at which it is first encountered in the well.
Water entering permeable zones along the outcrop moves downdip in the aquifer. Where impermeable rock overlies the aquifer, the water is confined, and a pressure head is built up in the aquifer. When the aquifer is tapped by a well, the water in the well will rise above the point it which it was encountered to a point determined by this pressure head.
The many structurally low areas in the surface and near-surface rocks in Cowley County are favorable areas for the occurrence of artesian water. Wells drilled there will yield more water and will be more dependable than wells drilled in surrounding structurally high areas. Wells under some artesian head and more productive than wells elsewhere in these rocks were observed in the synclinal areas on the east sides of the Winfield and the Dexter Anticlines.
The Water Table and Movement of Ground Water
The water table is not a plane surface but is a sloping surface in which are irregularities caused by differences in permeability of water-bearing materials, by unequal additions to or withdrawals of water from the aquifer, and by topographic features.
Plate 2 shows the location and depth to water of wells and test holes for which data are given in Table 11 or in the logs at the end of the report. Plate 3B shows the location of wells and test holes in unconsolidated deposits associated with Arkansas River drainage, the altitude of the water table, and contours on the water table. No attempt was made to draw water-table contours in the area of outcrop of Permian and Pennsylvanian rocks, because in parts of the area the water is under artesian head and in other parts of the area the water table is discontinuous.
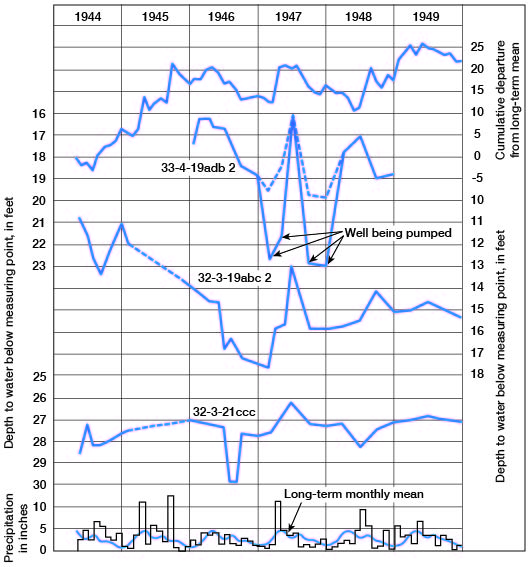
The water table is not stationary, but fluctuates in response to additions to and withdrawals of water from storage. Figure 5 shows the hydrographs of three wells over a period of about 6 years. The monthly precipitation and the cumulative departure from the long-term mean precipitation also are shown. These wells are in terrace deposits associated with Arkansas River. Fluctuations of the water level in these wells correlate with precipitation, the water rising sharply after periods of excessive precipitation and declining during periods of deficient precipitation. Other factors, such as heavy pumping, evaporation and transpiration, and discharge into streams, also cause declines in the water table.
Figure 5--Hydrographs of three wells, precipitation at Winfield, long-term monthly mean, and cumulative departure from long-term mean precipitation.
Direction of movement of the water may be determined from the water-table contours on Plate 3B. Water moves at a right angle to the contour at any given point. In the area north of T. 34 S. water moves generally southwestward toward Arkansas River; however, in sec. 13, 24, and 25, T. 33 S., R. 3 E., a low ground-water divide causes the water east of this divide to move eastward toward Walnut River. South of T. 33 S. the water moves directly toward the streams in the valley areas, and in the extreme southwestern part of the county it moves east-southeastward.
The spacing of contours on the water-table map may be an indication of the relative permeability of the water-bearing material, but other factors such as topography, recharge, and discharge also affect the spacing. The close spacing of contours just west of Winfield indicates a steep slope of the water table due to low permeability and topography. In this area the water-bearing deposits are of Kansan age and they contain a larger percentage of fine material than the younger, lower terrace materials. Also, the closely spaced contours near the northeast corner of sec. 29, T. 32 S., R. 3 E., are near the scarp of the Illinoisan terrace; here too the steep slope of the water table is the result of low permeability and the topography. The Wisconsinan terrace deposits near the foot of the Illinoisan terrace scarp are composed generally of finer materials, which were derived chiefly from slope wash, than those of the Wisconsinan terrace deposits nearer the river.
Recharge of Ground Water
The addition of water to the ground-water reservoir is known as ground-water recharge. In Cowley County the principal source of recharge is precipitation that falls directly on the county. Some water enters the county by subsurface movement from adjacent areas, and some is received from influent streams.
Recharge from Precipitation
The mean annual precipitation in Cowley County is 31.27 inches, but only a small part of this amount reaches the ground-water reservoir. A small part of the precipitation in Cowley County becomes direct runoff into the streams, part infiltrates into the soil and becomes soil moisture, and part is discharged through evaporation and transpiration. The small remainder moves downward to the zone of saturation to become ground water. The rate of precipitation, the type of soil or surface, and the character of the underlying rocks all affect the rate and quantity of recharge.
Except for a small area just northwest of Arkansas City where the surface is very sandy, the best area for recharge in Cowley County is in the alluvium and Wisconsinan terrace deposits in the Arkansas River valley. The sandy soils and permeable underlying materials are favorable for ground-water recharge, whereas less permeable silts and clays in the older terrace materials prevent much recharge.
The effect of precipitation on the water table is shown in Figure 5. Well 32-3-19abc2 is in Wisconsinan terrace deposits and wells 32-3-21ccc and 33-4-19adb2 are in Illinoisan deposits. Parts of the hydrographs correlate with the precipitation and show the response of the water table to recharge of water to and discharge (natural and by pumping) from the aquifer.
Permian and Pennsylvanian rocks have a wide range of geologic, structural, and topographic conditions and hence diverse recharge conditions. Recharge is very low in areas underlain by thick shale, but conditions are favorable for recharge where limestone or sandstone lies at the surface. Chert-bearing limestone is at or near the surface in large areas and receives much recharge through fractures and joints. Fluctuations in the discharge of many perennial springs and the rejuvenation of wet-weather springs during periods of precipitation indicate a considerable amount of recharge in these rocks. Some sinkholes in the upper part of the Barneston Limestone probably were caused by solution. Precipitation entering these sinkholes moves downward through solution channels and fractures and is discharged by springs in the same general vicinity. The flow of many of these springs fluctuates considerably in direct response to the precipitation. This response to precipitation is so rapid in some springs that the issuing water becomes turbid soon after a heavy rain.
Recharge from Adjacent Areas
Subsurface movement of water from outside the county is a relatively unimportant source of recharge to the ground-water reservoir in Cowley County. Some water moves across the west border, in the high upland area, into the southwestern part of the county, and some moves toward Arkansas River from the west into west-central Cowley County. Almost no water moves across the north or south borders of the county, because the dip of the strata is about parallel with the county boundaries. Precipitation on the outcrops of sandstone in the Wabaunsee and Admire, Groups east of Cowley County moves downdip, and part of this may eventually enter the county, but the quantity is probably small because the permeability of the sandstone is low.
Recharge from Streams
During periods of high water in Arkansas River, some water is contributed to the aquifer from the stream. This type of recharge is temporary in that as soon as the stage of the stream drops below the level of the water in the aquifer, the direction of movement of the water is reversed, and discharge into the stream begins. A small part of this recharge is utilized by wells before the rest is discharged back into the streams. Streams crossing permeable beds of Permian and Pennsylvanian rocks that dip away from the streams contribute water to these beds. This water moves downdip to the ground-water reservoir and may be recovered by wells or may be discharged farther downdip. The amount of recharge to the Permian and Pennsylvanian rocks in Cowley County is not large.
Discharge of Ground Water
Ground water is discharged in Cowley County by evaporation and transpiration, by seepage into streams, by subsurface movement to adjacent areas, and by springs and wells. The rate of natural discharge depends greatly on the stage of the water table and on the season of the year. Local differences in geology and topography cause more water to be discharged in some parts of the county than in others. At present only a small part of the ground-water discharge is by wells, but the amount is increasing almost annually.
Discharge by Evaporation and Transpiration
More ground water is discharged in Cowley County by evaporation and transpiration than by all other means combined. Ground water is discharged by direct evaporation in nearly all the valleys, where the water table is near the surface, and from seeps along the steep slopes of the valley walls. Much ground water is transpired by plants in the valley areas. In the Arkansas River valley the roots of nearly all. plants penetrate the zone of saturation or the capillary fringe. In the upland areas,, where the water table is relatively deep or discontinuous, few of the plants tap the ground-water reservoir.
Discharge by Seeps and Springs
Much ground water is discharged through seeps and springs, chiefly along valley walls adjacent to upland areas. A part of the water thus discharged is evaporated directly to the atmosphere and part is transpired by plants during the growing season. Any water that is not evaporated or transpired flows into streams and may leave the county as surface runoff. After the growing season, the amount of streamflow increases, as the ground water that has previously been intercepted by vegetation now discharges into the stream.
Discharge by Subsurface Movement
Discharge of ground water through subsurface movement into adjacent areas is relatively unimportant in Cowley County. The, water-table contours (Pl. 3B) indicate only one area in which water moves out of the county. In this area, along the west line of T. 31 S., water moves toward Arkansas River before the river enters Cowley County.
The north and south borders of the county nearly parallel the westerly dip of the strata, and little water moves in or out of the county along these borders. Along the east border of the county, water moves down the westward dip of the strata into the county.
Discharge by Wells
The preceding discussion considers the natural discharge of ground water, which is the way in which most of the discharge from the county takes place. The rest of the water that is discharged is by wells, and this method is discussed under the subject of recovery and utilization of ground water. The importance of discharge through wells will become greater with the increase in the use of water for irrigation and for industrial, public, and domestic purposes.
Recovery of Ground Water
When a well is standing idle, static equilibrium exists between the water in the well and the water outside the well. When water is withdrawn from the well, a difference in head is created between the water in the well and the water outside. The water table in the vicinity of the well develops a cone of depression (Fig. 6), which is deepest at the wall of the well and extends some distance from the well. The greater the pumping rate in the well, the greater the drawdown of the water level.
Figure 6--Diagrammatic section of a well that is being pumped, showing its drawdown, cone of depression, and radius of influence.
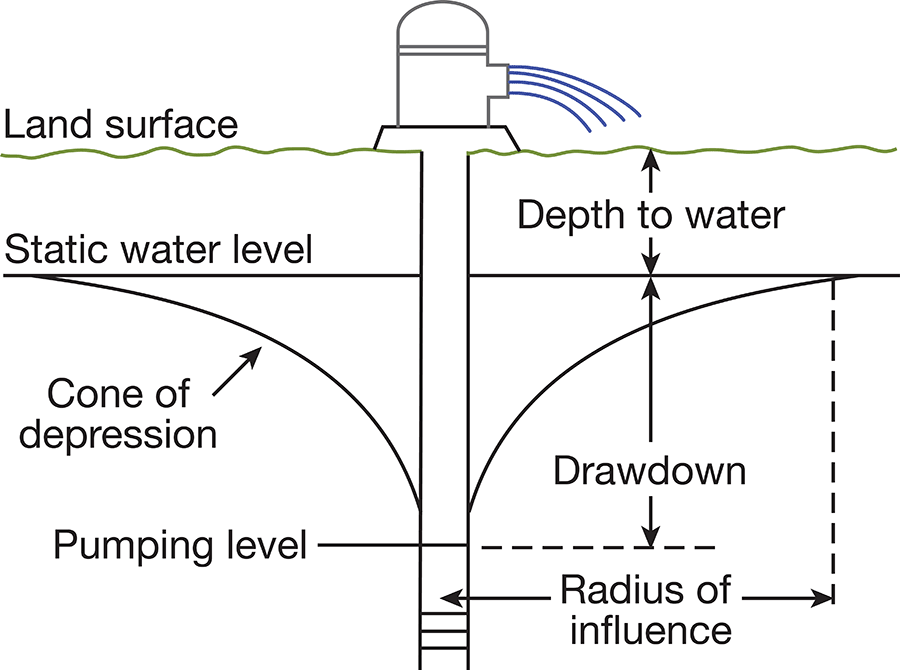
The specific capacity of a well is its rate of yield per unit of drawdown, and it usually is expressed as the yield in gallons per minute per foot of drawdown. The specific capacity of a well may be used in predicting the approximate drawdown in a well at various rates of pumping. If the specific capacity of a well is lower than that of nearby wells, it may be an indication of improper screening, insufficient development of the well, or partial plugging of the screen. The character of the water-bearing material determines the specific capacity of a properly constructed well. Large yields will be obtained from homogeneous, coarse-grained material, and smaller yields will be obtained from finer-grained materials.
Several types of wells are used to obtain water supplies in Cowley County. The type of well depends on the use for which the well is intended, the geologic materials to be penetrated, the depth to water, and the depth to which the well is to be constructed or drilled. In the following paragraphs the several types of wells are described briefly.
Dug wells--Dug wells are generally large-diameter wells excavated with hand tools or power equipment. The wells dug with hand tools penetrate the aquifer for only a short distance below the water table. Few dug wells are used in Cowley County in the areas underlain by Pleistocene deposits, but in upland areas in the county, which are underlain by stratified deposits of limestone and shale from which only small yields can be obtained, many of the wells are dug to provide the additional storage space needed because of the slow rate of infiltration.
Driven wells--Driven wells are small-diameter wells consisting of 1 1/4- to 2-inch pipe having a screen attached to the bottom. The pipe is driven into the aquifer far enough that the screen is below the water table. Use of a driven well is limited to areas underlain by unconsolidated materials in which the water table is not more than about 25 feet below the surface. Many wells have been driven in the alluvium and terrace deposits in the Arkansas River valley.
Drilled wells--Most wells in Cowley County are drilled wells. Constructed with either percussion or rotary drilling machines, these wells range in diameter from about 4 inches to 36 inches. Decision as to the diameter of a well to be drilled is based chiefly on the quantity of water needed. Wells in unconsolidated deposits must be cased and screened, but wells in consolidated deposits may have only a short string of casing in the upper part of the well to seal out surface contamination. Most domestic and stock wells in the county range in diameter from 5 to 8 inches, and their yields range from only a few gallons an hour to as much as 50 gallons a minute. Irrigation, industrial, and public-supply wells have larger diameters and may yield as much as 1,000 gpm.
Horizontal wells or infiltration galleries--Horizontal wells or infiltration galleries are constructed by sinking a vertical shaft from which one or more perforated pipes or screens are extended laterally. Water entering these horizontal pipes flows into the shaft, from which it is pumped. The laterals, which may extend several hundred feet from the shaft, can be forced into the aquifer from the shaft or can be laid in open trenches, which are backfilled with permeable materials. To induce infiltration from streams, one or more laterals are extended under the stream. In installations away from streams, the laterals may extend in all directions from the vertical shaft. Pumping large quantities of water from such installations lowers the water table much less than would pumping of the same volume from an ordinary vertical well.
In Cowley County this type of well construction could be used in thin permeable gravels near the base of the Illinoisan terrace deposits to obtain larger yields than can be obtained from a vertical well. The terrace deposits in the Arkansas River valley are relatively thin, and over much of the area the water in the basal part is of poor quality. A horizontal well in which the laterals extended from the central shaft at a depth only a short distance below the water table would yield larger quantities of water than a vertical well to the same depth. Water moves into a pumped well from all directions, and hence the poor-quality water moves upward into such a well. The terrace deposits are stratified, however, so the horizontal permeability is greater than the vertical permeability, and hence the upward movement of water having a greater density would be retarded. Proper setting of the laterals and regulated pumping would insure that a horizontal well would skim off the upper, good-quality water in the aquifer.
Utilization of Ground Water
In Cowley County, ground water is used chiefly for domestic, stock, and public supplies. Some water is used for irrigation, but irrigation is not practiced extensively in the county. Most industries use water from municipal supplies, but a few industries have their own supplies.
Domestic and Stock Supplies
Nearly all the domestic and stock water supplies in rural areas are obtained from privately-owned wells. In the valley areas these supplies are obtained principally from driven or drilled wells. In the upland areas the supplies are obtained from dug or drilled wells. In some upland areas where adequate water supplies are difficult to obtain, cisterns are used to catch rainwater to supplement the ground water, and at many places in the county ponds have been constructed for stock water.
Public Supplies
Seven public water-supply systems obtain their water in Cowley County. Two other cities formerly obtained water from within the county, but now obtain their supply from Sumner County.
Arkansas City--Arkansas City, the largest city in Cowley County, built its first public water supply in 1885. This supply was obtained from wells in the alluvial deposits in Arkansas River valley in the southwestern part of the city. Later wells were drilled in the valley at the south edge of the city near Summit Street. In 1915, two wells in this area provided 500,000 gpd. In 1918, four wells, 42 feet deep, supplied an average of 1.25 mgd. In 1932 the average daily pumpage from the four wells was about 2 mgd. The quality of the water deteriorated from 1912 to 1933, however; the water contained about 119 ppm of chloride in 1912 and 750 to 950 ppm in 1933. The old wells were therefore abandoned, and eight new wells were drilled west of Arkansas River. These wells range in depth from 35 to 40 feet and are equipped with 750-gpm turbine pumps. The average pumpage in 1958 was about 2 mgd, or about 2,200 acre-feet per year. Storage is provided by a 2.6-million-gallon reservoir at the pumping station and two 250,000-gallon elevated steel tanks. The water is chlorinated and treated with Calgon. Fluoride salts are added to raise the fluoride content to about 1 ppm.
Atlanta--The Atlanta water supply is obtained from an improved spring (30-6-28bdd1) about 2 miles south of the city in the Florence Limestone Member of the Barneston Limestone. The average pumpage is about 6,000 gallons a day or about 6 acre-feet per year. Well 30-628bdd2, which is adjacent to the spring, yielded about 1,000 gpd at a depth of 240 feet. The well was deepened to 300 feet, where it obtained salt water and was abandoned. Storage is provided by a 35,000-gallon elevated steel tank. The water is chlorinated at the spring pumphouse but receives no other treatment.
Bolton Township Water Cooperative--The Bolton Township Water Cooperative serves a suburban and rural area south and southeast of Arkansas City. In much of this area, ground water of usable quality is difficult to find in adequate quantity for domestic and stock use. The Cooperative obtains its water supply from one well (35-4-6bdc) in terrace deposits in the Arkansas River valley just south of Arkansas City. The well is 52 feet deep and is pumped at a rate of 225 gpm directly into the mains. The Cooperative serves 121 customers on 19 miles of pipeline. Storage and pressure are supplied by a 100,000-gallon elevated steel tank located in the upland area near the southwest corner of the Cooperative service area. The water is hard; it is chlorinated at the well but receives no other treatment. The annual pumpage is about 13 acre-feet.
Burden--For about 50 years the water supply for Burden has been obtained from an improved spring (31-6-28caa) in the Florence Limestone located in a branch of Silver Creek about 1 1/2 miles west of the city. In years of normal rainfall the supply is adequate, but in years of drought the yield declines, and water is shipped in to supplement the supply. Average pumpage is about 35,000 gallons a day or about 40 acre-feet per year. The water is chlorinated at the spring pumphouse and, although it is hard, it receives no other treatment.
Dexter--The water supply for Dexter is obtained from a dug well (33-6-13bcd) about half a mile west of the city in the terrace deposits adjacent to Grouse Creek. The well is 36 feet deep and 40 inches in diameter. In past years the city has had considerable difficulty with salt-water contamination of its water supply. Many oil and gas wells have been drilled in and adjacent to the city, and some of the wells were not properly plugged when abandoned. Brine-disposal ponds, although not now permitted, have in the past contributed salt water to the aquifer. In 1946 the chloride content of the water in well 33-6-13bcd was 1,600 ppm, and in June 1958 the concentration was 870 ppm. The average pumpage is about 25,000 gallons a day or about 27 acre-feet per year. The water is chlorinated at the well, and storage is provided by a 100,000-gallon elevated steel tank.
Geuda Springs--Part of the city of Geuda Springs is in Cowley County and part is across the county line in Sumner County. The city has had no public water supply since about 1950 and the residents have been using private wells. A public supply system for the city was constructed in 1918, and water was obtained from one dug well (34-3-7cba) about a quarter of a mile east of the city. The well was 52 feet deep and 8 feet in diameter. Water was obtained from porous zones in the lower part of the Wellington Formation. Storage was provided by two underground steel pressure tanks having a total capacity of about 8,000 gallons. Pressure in the mains was maintained by the pressure head in the tanks. The well was equipped with a centrifugal pump of about 175-gpm capacity, but the yield of the well was about 5 to 10 gpm. The depth to water in the well was 40 feet in 1919 and 43.5 feet in 1945. This well was abandoned shortly after 1950 because of contamination. The average daily pumpage at that time was 6,000 gallons.
Oxford--The city of Oxford is in Sumner County but it obtains its water supply from Cowley County. The first public supply was provided in 1914 and was obtained from shallow wells in the western part of the city. Water from these wells was good and had a chloride content of about 20 ppm, but yields were inadequate, and in 1920 a well was drilled in the alluvium on the east side of Arkansas River. This well was 46 feet deep and was pumped at a rate of 200 gpm, but the well became contaminated with salt water. In 1937 the city drilled a new well 1 1/4 miles east, in Cowley County. In 1958 Oxford obtained its water supply from two wells at this location. These wells are 37.5 feet deep and 18 inches in diameter and are pumped at about 500 gpm. Drawdown at this pumping rate is about 3 feet. The average pumpage is about 80,000 gallons a day or about 90 acre-feet per year. Water is pumped directly into the mains, and pressure and storage are provided by an elevated steel tank of 55,000-gallon capacity. The water is chlorinated at the wells and receives no other treatment.
Udall--The first public water-supply system for Udall was constructed prior to 1905. Wells drilled in and near the townsite obtained water from the lower part of the Wellington Formation and from the Nolans Limestone. In 1929 a well was dug in the southern part of the townsite. This well was 60 feet deep and obtained water from the Nolans Limestone. It yielded about 60 gpm during years of normal precipitation, but in periods of drought the yield decreased and the quality deteriorated. In 1954 two wells were drilled in terrace deposits adjacent to Arkansas River in Sumner County, about 3 1/2 miles west of the city. These wells are about 30 feet deep and yield about 130 gpm each. In 1959 all wells near the townsite had been abandoned. The average pumpage is about 60,000 gallons a day or about 65 acre-feet per year. Storage and pressure are provided by an elevated steel tank of 50,000-gallon capacity. The water is chlorinated at the wells but receives no other treatment.
Winfield--The original public water supply for the city of Winfield was obtained from Walnut River at the west edge of the city. About 1916, wastes from oil fields and allied industries began polluting the stream, making the water unsuitable for domestic use. By June 1918, eight wells had been drilled about 4 miles west of the city. The wells were about 30 feet deep. Two additional wells were drilled in 1921, at which time the average daily pumpage was about 1.25 mgd. By 1923 the yields of these wells were inadequate to supply the water requirements of the city, and this well field was abandoned. Wells were then drilled in the alluvium of Arkansas River about 9 miles west of the city. Six wells were drilled in three groups of two wells each. The wells in each pair were spaced about 150 feet apart and were pumped by one centrifugal pump located in a pit midway between them. The four east wells were 38 feet deep and the two west wells were 46 feet deep; all were cased with 25-inch concrete casings. The yield from each pair of wells was about 1,000 gpm.
In 1937 the chloride content of the water in the wells increased. The largest increase was in the middle group of wells (32-3-18dcc) from 507 ppm in 1938 to 12,000 ppm in 1939. The source of these chlorides was traced to disposal ponds and leaky casing in a disposal well south of the well field. These sources of contamination were eliminated, and the chloride content of the well water declined. In 1940 a new well was drilled a quarter of a mile north of well 32-3-18dcc. This well (32-318dbc) is 48 feet deep and yields 1,000 gpm. Continued difficulties with salt water in the well field caused the city to drill six new wells about 3 miles south of the old well field in sec. 5 and 6, T. 33 S., R. 3 E. The northernmost well in this group was never equipped with a pump, because of salt-water intrusion during the time between the drilling of test holes and the drilling of the well. In 1959 the chloride concentration in other wells in this field was increasing, but no additional wells were abandoned.
In 1955, wells 32-3-24bdc and 32-3-25bdc were drilled. These wells obtained water from cavernous Nolans and Winfield Limestones at a depth of 165 feet and 113 feet respectively. Yield of each of these wells was about 1,000 gpm, but because the sulfate content of the water in well 32-3-24bdc was excessive, only well 32-3-25bdc has been used.
The average pumpage by the city is about 1.5 mgd, or about 1,700 acre-feet per year. Water is stored in a concrete reservoir at the water plant, which has a capacity of about one million gallons, and a concrete reservoir on a hill in the eastern part of the city, which has a capacity of about two million gallons. The water is very hard at times and is chlorinated and treated with Calgon at the water plant.
Industrial Supplies
The industrial use of water in Cowley County is considerably less than the domestic or municipal use. Most industries depend on the public supplies for their water, but a few industries obtain part of their water from their own wells. The largest industrial user in the county is the Anderson-Prichard Oil Co. refinery in Arkansas City, and it obtains its supply from three wells in the Arkansas River valley, in southeast Arkansas City. The wells are pumped continuously at a rate of about 300 gpm each, or about 1,400 acre-feet annually. The water is used as boiler-feed water and for cooling.
The Maurer Neuer Packing Co. has one well to provide water for cooling. This well is 48 feet deep and is pumped intermittently at a rate of about 300 gpm; the annual pumpage is probably about 100-acre feet.
Wells at the former Army Air Force base (Strother Field) about 6 miles north of Arkansas City now provide water for industrial use. The base facilities are owned jointly by the cities of Arkansas City and Winfield, which lease the buildings and hangars to several industries. When the Air Force base was operated by the Army, the water supply was obtained from six wells about 40 feet deep. The wells were equipped with turbine pumps and their yields ranged from 97 to 188 gpm. In 1958 only one well was in operation. This well (33-4-18ddc) is pumped intermittently to supply the industries located at the former air base. The average pumpage is less than 10,000 gallons a day, and the annual pumpage is probably about 10 acre-feet.
Other smaller industries in the county obtain a part of their supply from privately-owned wells, but pumpage from these wells is small.
Irrigation Supplies
Irrigation has not been practiced extensively in Cowley County. There was some irrigation in the Arkansas River valley from 1920 to 1940, but most of the projects were operated for only a few years. Since 1940 other irrigation projects have been carried on for short periods. In 1958 there were 11 irrigation plants in operation in the county, most of which had been built during the drought years from 1952 through 1956.
Thirteen irrigation plants were visited during the investigation. Eleven were in operation, one was partly dismantled, and another (32-3-34abb2) had been abandoned because of salt-water contamination. Of the operating irrigation plants, six were in the Arkansas River valley and obtained water from Wisconsinan terrace deposits or alluvium. Their yields ranged from 500 to 1,000 gpm. Four wells obtained water from Illinoisan deposits east of the Arkansas River valley. These wells have relatively low yields; the water is pumped into ponds from which it flows over the land to be irrigated. One well (34-4-20dbc) is in terrace deposits adjacent to Walnut River, and it yields about 300 gpm. The combined yield of the irrigation wells in the county is about 6,200 gpm, or about 1,000 acre-feet per year, and the total acreage irrigated is about 700 acres.
Water in Storage
Saturated thickness of the Pleistocene deposits in the Arkansas River valley, Walnut River valley, and adjacent areas was mapped (Pl. 3C). The volume of saturated material in the Pleistocene deposits was computed from this map. A specific yield of 20 percent was applied to the volume of sediments in the Wisconsinan terrace deposits and alluvium in the Arkansas River valley, and a specific yield of 10 percent was applied to the other saturated deposits, which are less permeable. The area underlain by and the volume of water in storage in Wisconsinan terrace deposits and alluvium in Arkansas River valley are given in Table 4, and similar information for the Illinoisan, Kansan, and Walnut River terrace deposits are given in Table 5.
Table 4--Area underlain by, and volume of water in storage in, Wisconsinan terrace deposits and alluvium in Arkansas River valley
| Township | Area (acres) |
Water in storagea (acre-feet) |
|---|---|---|
| T. 31 S., R. 3 E. | 3,770 | 13,000 |
| T. 32 S., R. 3 E. | 7,630 | 33,000 |
| T. 33 S., R. 3 E. | 10,120 | 45,000 |
| T. 34 S., R. 3 E. | 9,700 | 34,000 |
| T. 34, 35 S., R. 4, 5 E. | 6,250 | 32,000 |
| Total | 37,470 | 157,000 |
| a. Based on a specific yield of 20 percent. | ||
Table 5--Area underlain by, and volume of water in storage in, the Illinoisan, Kansan, and Walnut River terrace deposits
| Township | Area (acres) |
Water in storagea (acre-feet) |
|---|---|---|
| T. 31 S., R. 3 E. | 5,700 | 5,000 |
| T. 32 S., R. 3 E. | 11,190 | 18,000 |
| T. 33 S., R. 3 E. | 10,160 | 18,000 |
| T. 33 S., R. 4 E. | 9,750 | 18,000 |
| T. 34 S., R. 4 E. | 4,800 | 7,000 |
| T. 34, 35 S., R. 3 E. | 9,100 | 15,000 |
| Total | 50,700 | 81,000 |
| a. Based on a specific yield of 10 percent. | ||
In the deposits listed in Table 5, the quantity of water in storage is about 1.6 feet of water per acre, or about the quantity that would be pumped in 1 year if all the acreage underlain by these deposits were irrigated. In the Arkansas River valley the quantity of water in storage is about 4.2 feet per acre, or about 3 years' supply under the same pumping conditions.
Chemical Character of Ground Water
When water comes into contact with the rocks that form the crust of the earth, it dissolves a part of the rock material. The type and composition of the rock through which the water passes thus determines, to a large degree, the chemical character of such ground water. The more soluble minerals are naturally taken into solution more easily and in greater concentration than the less soluble minerals.
The chemical character of ground water in Cowley County is indicated by analyses of 57 samples of water from wells and test holes (Table 6) and by partial analyses of 158 samples (Table 7). Of the 57 complete analyses, 9 are of water from public-supply wells or springs. Five partial analyses are from surface-water samples. Although not all minerals present in the water samples are reported, those that commonly are present in sufficient quantity to affect adversely the quality of the water for domestic, industrial, and irrigation use are reported.
The mineral constituents listed in Table 6 are reported in parts per million (ppm) by weight. One part per million is equivalent to one pound of substance per million pounds of water, or 8.34 pounds of substance per million gallons of water. The concentrations of minerals in the water in equivalents can be computed by multiplying the parts per million by the conversion factors given in Table 8. When expressed in equivalents per million, the sum of the anions is equal to the sum of the cations.
The samples of water from the wells and test holes in Cowley County were analyzed by Howard A. Stoltenberg, chemist in the Sanitary Engineering Laboratory of the Kansas State Board of Health. The analyses give only the dissolved mineral content of the water and do not indicate sanitary conditions.
Table 6--Analyses of water, in parts per million(a), from representative wells, springs, and test holes in Cowley County.
| Well number |
Depth (feet) (b) |
Geologic source | Date of collection |
Temp. (°F) |
Dissolved solids (residue at 180° C) |
Silica (SiO2) |
Iron (Fe) |
Calcium (Ca) |
Magnesium (Mg) |
Sodium, Potassium as sodium (Na) |
Bicarbonate (HCO3) |
Sulfate (SO4) |
Chloride (Cl) |
Fluoride (F) |
Nitrate (NO3) |
Hardness as CaCO3 | |
|---|---|---|---|---|---|---|---|---|---|---|---|---|---|---|---|---|---|
| Calcium, magnesium |
Non- carbonate |
||||||||||||||||
| 30-4-19add | 31 | Terrace deposits | 9-25-1958 | 57 | 566 | 26 | 1.5 | 128 | 25 | 45 | 489 | 48 | 44 | 0.0 | 9.3 | 422 | 21 |
| 30-6-28dbd1 | Spring | Barneston Limestone | 5-5-1958 | 57 | 290 | 18 | .23 | 80 | 7.9 | 14 | 273 | 16 | 12 | .2 | 5.3 | 232 | 8 |
| 30-8-21cac | 42 | Bader Limestone | 10-2-1958 | 56 | 483 | 19 | .26 | 63 | 38 | 68 | 478 | 38 | 20 | .1 | 1.9 | 313 | 0 |
| 31-3-1abb | 123 | Barneston Limestone | 9-14-1958 | 55 | 1,570 | 14 | .07 | 262 | 86 | 127 | 359 | 722 | 150 | 1.3 | 28 | 1,000 | 710 |
| 31-4-18cbb | 34 | Terrace deposits | 9-25-1958 | 56 | 621 | 25 | .13 | 115 | 21 | 62 | 237 | 96 | 105 | .2 | 80 | 374 | 180 |
| 31-6-28caa | Spring | Barneston Limestone | 5-19-1958 | 56 | 368 | 15 | .16 | 105 | 7.3 | 17 | 327 | 18 | 12 | .1 | 30 | 292 | 24 |
| 31-7-10bdd | 24 | Terrace deposits | 10-2-1958 | 56 | 422 | 24 | .31 | 122 | 12 | 18 | 427 | 19 | 15 | .0 | 2.2 | 354 | 4 |
| 31-8-17cdd | 75 | Bader Limestone | 10-2-1958 | 57 | 392 | 14 | 1.6 | 17 | 12 | 116 | 306 | 44 | 25 | .9 | 12 | 92 | 0 |
| 32-3-6dcc | 37-42 | Alluvium | 6-5-1944 | 12,100 | 1,330 | 333 | 2,790 | 168 | 46 | 7,500 | .1 | 5.8 | 4,700 | 4,560 | |||
| 32-3-7ddd1 | 37.5 | Terrace deposits | 9-13-1954 | 530 | 17 | .02 | 97 | 24 | 43 | 317 | 107 | 37 | .5 | 12 | 340 | 80 | |
| 32-3-9abb | 38-43 | Terrace deposits | 4-27-1944 | 342 | 55 | 16 | 52 | 295 | 16 | 22 | .2 | 33 | 203 | 0 | |||
| 32-3-18dba | 40 | Terrace deposits | 1-14-1959 | 56 | 486 | 18 | .05 | 99 | 25 | 41 | 373 | 82 | 30 | .5 | 4.2 | 350 | 44 |
| 32-3-21ccc | 36-38 | Terrace deposits | 4-10-1944 | 269 | 54 | 13 | 33 | 256 | 19 | 18 | .5 | 3.3 | 188 | 0 | |||
| 32-2-24bdc | 167 | Nolans and Winfield Limestones | 3-20-1956 | 58 | 1,690 | 14 | .13 | 304 | 89 | 108 | 329 | 918 | 94 | .8 | .9 | 1,120 | 850 |
| 32-3-32cdd | 40 | Terrace deposits | 8-20-1943 | 468 | 2.3 | 77 | 27 | 66 | 403 | 46 | 47 | .3 | 1.4 | 303 | 0 | ||
| 32-3-32ddc | 52 | Terrace deposits | 9-22-1958 | 56 | 382 | 17 | .04 | 71 | 17 | 46 | 332 | 24 | 22 | .4 | 22 | 247 | 0 |
| 32-3-34abb | 32 | Terrace deposits | 10- 3-1958 | 57 | 2,500 | 21 | .12 | 414 | 150 | 288 | 217 | 134 | 1,380 | .0 | 6.6 | 1,650 | 1,470 |
| 32-4-6ccc | 90 | Terrace deposits and Barneston Limestone | 9-25-1958 | 56 | 395 | 22 | .78 | 82 | 21 | 25 | 299 | 26 | 23 | .1 | 49 | 291 | 46 |
| 32-4-8aaa | 100 | Doyle Shale | 10-3-1958 | 56 | 364 | 14 | .05 | 91 | 22 | 16 | 395 | 5.3 | 11 | .0 | 9.7 | 318 | 0 |
| 32-4-34ccb | 30 | Terrace deposits | 9-26-1958 | 57 | 360 | 14 | .12 | 82 | 17 | 26 | 312 | 50 | 15 | .3 | 2.4 | 274 | 18 |
| 32-5-4aaa | 180 | Barneston and Wreford Limestones | 10-2-1958 | 56 | 575 | 10 | .08 | 126 | 32 | 28 | 390 | 76 | 31 | .4 | 80 | 446 | 126 |
| 32-5-24cbc | 140 | Barneston Limestone | 9-11-1958 | 56 | 423 | 11 | 2.0 | 90 | 29 | 28 | 404 | 48 | 14 | .5 | 3.6 | 344 | 13 |
| 32-7-11aaa | 120 | Wreford Limestone | 10-2-1958 | 56 | 369 | 13 | 1.8 | 75 | 30 | 23 | 393 | 26 | 7 | .5 | .9 | 310 | 0 |
| 33-3-5bbb | 20 | Terrace deposits | 8-16-1943 | 304 | 1.2 | 74 | 15 | 18 | 256 | 53 | 12 | .5 | 2.3 | 246 | 36 | ||
| 33-3-5cac | 44 | Terrace deposits | 1-14-1959 | 56 | 1,590 | 18 | .02 | 312 | 65 | 179 | 248 | 84 | 810 | .1 | 1.5 | 1,040 | 840 |
| 33-3-10ccc | 35 | Terrace deposits | 8-20-1943 | 57 | 422 | .17 | 76 | 22 | 56 | 383 | 42 | 26 | .3 | 8.4 | 280 | 0 | |
| 33-3-13aaa | 47-52 | Crete and Loveland Formations | 4-15-1944 | 435 | 64 | 21 | 74 | 361 | 56 | 34 | .4 | 4.9 | 246 | 0 | |||
| 33-3-14dda | 40 | Crete and Loveland Formations | 8-20-1943 | 448 | .33 | 72 | 20 | 70 | 361 | 74 | 26 | .3 | 4.4 | 262 | 0 | ||
| 33-3-17aaa1 | 43-47 | Terrace deposits | 4-3-1944 | 6,980 | 558 | 125 | 1,940 | 238 | 90 | 4,140 | .3 | 6.6 | 1,900 | 1,710 | |||
| 33-3-20dcc | 39-44 | Terrace deposits | 3-28-1944 | 28,000 | 1,640 | 408 | 8,710 | 214 | 140 | 17,300 | 5,770 | 5,590 | |||||
| 33-3-25bbb | 29-34 | Crete and Loveland Formations | 3-20-1944 | 525 | 72 | 18 | 108 | 427 | 60 | 51 | .3 | 2.2 | 254 | 0 | |||
| 33-3-34cdd | 48 | Wellington Formation | 8-18-1943 | 379 | .43 | 75 | 22 | 32 | 321 | 12 | 15 | .3 | 62 | 278 | 15 | ||
| 33-3-34dcc | 45 | Wellington Formation | 9-22-1958 | 57 | 498 | 17 | .04 | 72 | 24 | 78 | 332 | 18 | 92 | .2 | 33 | 278 | 6 |
| *33-4-7ddd | 30 | Winfield Limestone | 8-20-1943 | 650 | 1.0 | 116 | 43 | 43 | 306 | 216 | 34 | .2 | 44 | 466 | 215 | ||
| *33-4-7ddd | 30 | Winfield Limestone | 9-22-1958 | 56 | 796 | 20 | .08 | 132 | 46 | 65 | 329 | 291 | 38 | .2 | 42 | 518 | 248 |
| 33-4-19adc | 41 | Crete and Loveland Formations | 9-2-1942 | 560 | 2.6 | 95 | 25 | 78 | 349 | 86 | 89 | .3 | 10 | 340 | 54 | ||
| 33-4-21cdd | 33-38 | Crete and Loveland Formations | 4-17-1944 | 458 | 76 | 25 | 58 | 344 | 82 | 26 | .2 | 19 | 292 | 10 | |||
| 33-4-23ccc2 | 29 | Crete and Loveland Formations | 9-26-1958 | 56 | 729 | 23 | .06 | 155 | 30 | 58 | 406 | 60 | 128 | .1 | 75 | 510 | 177 |
| 33-4-30add1 | 40 | Crete and Loveland Formations | 8-20-1943 | 525 | .99 | 69 | 20 | 103 | 368 | 78 | 64 | .3 | 5.3 | 254 | 0 | ||
| 33-5-33bbb | 110 | Barneston Limestone | 10-2-1958 | 57 | 558 | 13 | .56 | 87 | 58 | 31 | 464 | 87 | 13 | .5 | 40 | 456 | 76 |
| 33-6-1acc | 25 | Terrace deposits | 4-21-1944 | 581 | 12 | .38 | 148 | 23 | 17 | 461 | 42 | 32 | .1 | 43 | 464 | 86 | |
| 33-6-13bcd | 36 | Terrace deposits | 6-2-1958 | 58 | 1,870 | 15 | .13 | 333 | 35 | 325 | 371 | 104 | 870 | .1 | 5.3 | 975 | 671 |
| 33-7-14adc | 100 | Bader Limestone | 10-2-1958 | 57 | 423 | 14 | .08 | 44 | 49 | 49 | 442 | 20 | 17 | .3 | 12 | 312 | 0 |
| *34-3-4bbb | 29 | Terrace deposits | 8-18-1943 | 1,070 | .17 | 161 | 27 | 197 | 254 | 140 | 410 | .5 | 8.4 | 512 | 304 | ||
| *34-3-4bbb | 29 | Terrace deposits | 9-22-1958 | 57 | 697 | 16 | .24 | 97 | 16 | 135 | 298 | 100 | 167 | .5 | 19 | 308 | 64 |
| 34-3-7baa | 16 | Alluvium | 8-19-1643 | 1,400 | .38 | 215 | 66 | 162 | 443 | 635 | 80 | .6 | 26 | 808 | 445 | ||
| 34-3-23cbb | 39-44 | Alluvium | 4-20-1944 | 451 | 94 | 27 | 32 | 312 | 109 | 31 | .2 | 2.0 | 346 | 90 | |||
| 34-3-26bad2 | 40 | Alluvium | 5-26-1959 | 57 | 808 | 17 | .4 | 67 | 16 | 205 | 203 | 144 | 255 | .6 | 1.5 | 233 | 67 |
| 34-4-12bbb | 28 | Alluvium | 9-26-1958 | 56 | 373 | 21 | .54 | 88 | 10 | 28 | 281 | 23 | 25 | .0 | 40 | 260 | 30 |
| 34-4-21dcc | 41 | Alluvium | 9-23-1958 | 57 | 459 | 22 | .09 | 97 | 19 | 22 | 245 | 46 | 21 | .1 | 111 | 320 | 119 |
| 34-4-28aba | 242 | Barneston Limestone | 9-23-1958 | 56 | 2,670 | 10 | .22 | 233 | 56 | 600 | 359 | 1,190 | 410 | 3.0 | 2.2 | 812 | 518 |
| 34-4-33ddd | 16 | Terrace deposits | 8-18-1943 | 595 | .09 | 86 | 13 | 121 | 264 | 68 | 170 | .3 | 4.9 | 268 | 52 | ||
| 34-4-34ddd | 22 | Terrace deposits | 8-18-1943 | 991 | .22 | 150 | 23 | 191 | 345 | 93 | 352 | .2 | 8.8 | 468 | 185 | ||
| 34-8-30 Lot 3 | 365 | Sandstone in Willard and Pillsbury Shales | 10-2-1958 | 838 | 15 | .06 | 8.2 | .9 | 329 | 537 | 33 | 184 | 1.5 | 1.5 | 24 | 0 | |
| **35-3-1aaa | 46-48 | Terrace deposits | 8-27-1958 | 48 | 773 | 13 | .22 | 78 | 20 | 172 | 200 | 177 | 213 | .5 | 1.0 | 276 | 112 |
| 35-4-2add | 42-47 | Alluvium | 4-20-1944 | 402 | 102 | 20 | 22 | 374 | 49 | 16 | .3 | 5.8 | 336 | 30 | |||
| 35-4-6bdc | 52 | Alluvium | 10-4-1958 | 56 | 936 | 17 | .6 | 91 | 25 | 258 | 232 | 230 | 326 | .6 | .7 | 330 | 148 |
| (a) One part per million is equivalent to one pound of substance per million pounds of water or 8.33 pounds per million gallons of water. (b) Total depth of well except where two numbers are given; 37-42 indicates depth from which sample was pumped. * Two samples of water from same well on different dates. ** Partial analysis given in Table 7. |
|||||||||||||||||
Table 7--Partial analyses of water, in parts per million(a), from wells and test holes in Cowley County.
| Well number |
Depth (feet) (b) |
Geologic source | Date of collection |
Sulfate (SO4) |
Chloride (Cl) |
|---|---|---|---|---|---|
| 31-3-16cdd | 54-56 | Terrace deposits | 6-16-1957 | 31 | |
| 31-3-29dcc | 38-43 | Terrace deposits | 4-29-1944 | 14 | |
| 31-3-30ccc | 41-43 | Terrace deposits | 9-8-1955 | 56,400 | |
| 43-48 | Terrace deposits | 5-26-1944 | 40,700 | ||
| 31-3-30dcc | 27-32 | Terrace deposits | 5-26-1944 | 23 | |
| 31-3-31ccc | 33-35 | Alluvium | 6-21-1956 | 26,200 | |
| 31-3-31ccd | 30 | Alluvium | 8-21-1943 | 196 | |
| 31-3-32bbb | 20-22 | Terrace deposits | 8-10-1956 | 162 | 26 |
| 26-28 | Terrace deposits | 8-10-1956 | 384 | 43 | |
| 31-3-32ddc | 18-20 | Terrace deposits | 8-10-1956 | 116 | 3,150 |
| 31-3-33abb | 14-19 | Terrace deposits | 5-2-1944 | 3,980 | |
| 31-4-6bdd | 28 | Terrace deposits | 4-15-1958 | 512 | |
| 32-3-5baa | 16-18 | Terrace deposits | 8-10-1956 | 200 | 66 |
| 25-27 | Terrace deposits | 8-10-1956 | 246 | 104 | |
| 32-3-5ccc1 | 30 | Terrace deposits | 8-21-1943 | 11 | |
| 32-3-5ccc2 | 30-35 | Terrace deposits | 5-2-1944 | 19 | |
| 32-3-5ccc3 | 15-17 | Terrace deposits | 8-10-1956 | 62 | 63 |
| 26-28 | Terrace deposits | 8-10-1956 | 70 | 67 | |
| 32-3-5dcc | 29-34 | Terrace deposits | 5-2-1944 | 50 | |
| 32-3-6aaa | 11-13 | Terrace deposits | 8-10-1956 | 38 | 10 |
| 26-28 | Terrace deposits | 8-10-1956 | 68 | 20 | |
| 32-3-6ccc | 40-45 | Alluvium | 6-6-1944 | 38,000 | |
| 32-3-7dca | Surface | 8-10-1956 | 132 | 5,310 | |
| 32-3-8dbb | Surface | 8-10-1956 | 166 | 2,490 | |
| 32-3-10baa | 28-33 | Terrace deposits | 5-3-1944 | 6 | |
| 32-3-17abb | 18-20 | Terrace deposits | 8-11-1956 | 48 | 16 |
| 32-3-17bbb | 13-15 | Terrace deposits | 8-11-1956 | 216 | 57 |
| 27-29 | Terrace deposits | 8-11-1956 | 84 | 31 | |
| 33-3-17dcc | 9-11 | Terrace deposits | 8-11-1956 | 28 | 27 |
| 33-3-18abb | 15-19 | Terrace deposits | 8-11-1956 | 78 | 30 |
| 34-36 | Terrace deposits | 8-11-1956 | 68 | 58 | |
| 32-3-18bba | 7-9 | Alluvium | 8-12-1956 | 78 | 570 |
| 33-35 | Alluvium | 8-12-1956 | 122 | 8,330 | |
| 32-3-19aaa | 16-18 | Terrace deposits | 8-11-1956 | 56 | 13 |
| 25-27 | Terrace deposits | 8-11-1956 | 62 | 16 | |
| 19-21 | Terrace deposits | 6-25-1957 | 50 | ||
| 32-3-19abb | 36-38 | Terrace deposits | 6-25-1957 | 1,760 | |
| 32-3-19abc1 | 33-35 | Terrace deposits | 4-7-1944 | 4,300 | |
| 32-3-19abc2 | 37-39 | Terrace deposits | 4-7-1944 | 34,800 | |
| 32-3-19bbb | 12-14 | Terrace deposits | 6-25-1957 | 85 | |
| 23-25 | Terrace deposits | 6-25-1957 | 80 | ||
| 45-47 | Terrace deposits | 6-25-1957 | 290 | ||
| 32-3-19ddd | 25 | Alluvium | 8-21-1943 | 46 | |
| 32-3-20dbc | 15-17 | Terrace deposits | 8-11-1956 | 98 | 21 |
| 32-3-29cdc | 13-15 | Terrace deposits | 8-12-1956 | 50 | 51 |
| 32-3-30aaa | 5-7 | Alluvium | 8-12-1956 | 74 | 37 |
| 14-16 | Alluvium | 8-12-1956 | 58 | 20 | |
| 32-3-30ddd | 7-9 | Alluvium | 8-12-1956 | 64 | 19 |
| 14-16 | Alluvium | 8-12-1956 | 60 | 21 | |
| 32-3-31aaa | 20 | Alluvium | 8-20-1943 | 19 | |
| 32-3-31dac | 14-18 | Terrace deposits | 8-14-1956 | 52 | 60 |
| 34-36 | Terrace deposits | 8-14-1956 | 152 | 485 | |
| 32-3-31dca | 42 | Terrace deposits | 8-10-1956 | 142 | 325 |
| 32-3-31dcd | 13-15 | Terrace deposits | 8-14-1956 | 36 | 26 |
| 33-35 | Terrace deposits | 8-14-1956 | 116 | 365 | |
| 11-13 | Terrace deposits | 8-17-1957 | 23 | ||
| 36-38 | Terrace deposits | 8-17-1957 | 2,800 | ||
| 32-3-32ccc2 | 13-15 | Terrace deposits | 8-14-1956 | 32 | 28 |
| 26-28 | Terrace deposits | 8-14-1956 | 60 | 33 | |
| 32-4-5ccc | 27-32 | Terrace deposits | 5-5-1944 | 12 | |
| 32-4-7bba | 36-41 | Terrace deposits | 5-5-1944 | 31 | |
| 33-3-3bbb | 29-34 | Terrace deposits | 4-21-1944 | 31 | |
| 33-3-5ccc1 | 12-14 | Alluvium | 8-13-1956 | 86 | 34 |
| 14-16 | Alluvium | 8-17-1957 | 46 | ||
| 34-36 | Alluvium | 8-17-1957 | 332 | ||
| 33-3-5ddc | 15-17 | Terrace deposits | 8-13-1956 | 32 | 39 |
| 32-34 | Terrace deposits | 8-13-1956 | 44 | 29 | |
| 33-3-6bab | 13-15 | Terrace deposits | 8-14-1956 | 64 | 235 |
| 33-35 | Terrace deposits | 8-14-1956 | 364 | 7,770 | |
| 15-17 | Terrace deposits | 6-25-1957 | 87 | ||
| 35-37 | Terrace deposits | 6-25-1957 | 14,700 | ||
| 33-3-7aaa | 30 | Alluvium | 8-20-1943 | 64 | |
| 33-3-8ccc | 11-13 | Terrace deposits | 8-14-1956 | 68 | 41 |
| 33-3-8dcc | 35-40 | Alluvium | 4-3-1944 | 4,750 | |
| 33-3-15aaa | 34-39 | Terrace deposits | 4-4-1944 | 35 | |
| 33-3-17aaa2 | 15-17 | Terrace deposits | 8-15-1956 | 112 | 330 |
| 33-35 | Terrace deposits | 8-15-1956 | 1,62 | 475 | |
| 33-3-17aaa3 | 25 | Terrace deposits | 8-20-1943 | 81 | |
| 33-3-17bba | 19-24 | Terrace deposits | 4-1-1944 | 285 | |
| 33-3-17daa | 14-16 | Terrace deposits | 8-15-1956 | 68 | |
| 33-35 | Terrace deposits | 8-15-1956 | 52 | 193 | |
| 33-3-19ccc | 20-25 | Terrace deposits | 4-1-1944 | 426 | |
| 33-3-19dcc | 33-38 | Terrace deposits | 3-30-1944 | 1,680 | |
| 33-3-20ddc | 20 | Terrace deposits | 8-20-1943 | 115 | |
| 33-3-21aaa | 40 | Terrace deposits | 8-20-1943 | 12 | |
| 33-3-21dda | 35-40 | Terrace deposits | 3-27-1944 | 7,600 | |
| 33-3-21ddb | 19-24 | Alluvium | 3-27-1944 | 3,090 | |
| 33-3-23ccc | 11-15 | Crete and Loveland Formations |
3-22-1944 | 100 | |
| 33-3-27dcc | 25-30 | Crete and Loveland Formations |
3-23-1944 | 6.0 | |
| 33-3-28bbb | 42-47 | Terrace deposits | 3-27-1944 | 16,900 | |
| 33-3-28dbc1 | 17-19 | Terrace deposits | 8-16-1956 | 36 | 122 |
| 30-32 | Terrace deposits | 8-16-1956 | 146 | 462 | |
| 33-3-28dbc2 | Surface | 8-16-1956 | 168 | 720 | |
| 33-3-29cca1 | 15-17 | Alluvium | 8-16-1956 | 182 | 890 |
| 34-36 | Alluvium | 8-16-1956 | 146 | 2,620 | |
| 33-3-29cca2 | Surface | 8-16-1956 | 172 | 790 | |
| 33-3-29ddd1 | 28-30 | Terrace deposits | 8-15-1956 | 124 | 324 |
| 33-3-29ddd2 | 21-23 | Terrace deposits | 8-15-1956 | 114 | 391 |
| 48-50 | Terrace deposits | 8-15-1956 | 162 | 1,580 | |
| 33-3-30aaa | 25-30 | Terrace deposits | 3-30-1944 | 1,120 | |
| 33-3-31aaa | 16-18 | Terrace deposits | 8-16-1956 | 176 | 480 |
| 39-41 | Terrace deposits | 8-16-1956 | 176 | 13,000 | |
| 33-3-31add | 20 | Terrace deposits | 8-20-1943 | 248 | |
| 33-3-31daa | 13-15 | Terrace deposits | 8-16-1956 | 116 | 740 |
| 30-32 | Terrace deposits | 8-16-1956 | 162 | 1,220 | |
| 33-3-32daa | 23-25 | Terrace deposits | 8-16-1956 | 148 | 343 |
| 39-41 | Terrace deposits | 8-16-1956 | 208 | 435 | |
| 33-3-33abb | 15-17 | Terrace deposits | 8-15-1956 | 44 | 26 |
| 24-26 | Terrace deposits | 8-15-1956 | 46 | 33 | |
| 33-3-33dcc | 23-28 | Terrace deposits | 3-23-1944 | 43 | |
| 33-4-17cbb | 48-53 | Crete and Loveland Formations |
3-16-1944 | 14 | |
| 33-4-19aaa | 37-42 | Crete and Loveland Formations |
3-16-1944 | 13 | |
| 33-4-29abb | 38-43 | Crete and Loveland Formations |
4-17-1944 | 56 | |
| 33-4-30add2 | 38-43 | Crete and Loveland Formations |
3-18-1944 | 64 | |
| 33-6-12aaa | 32 | Terrace deposits | 8-13-1946 | 19 | |
| 34-3-4abb | 23-25 | Terrace deposits | 8-17-1956 | 68 | 31 |
| 34-3-4dcc | 25-27 | Terrace deposits | 9-2-1956 | 48 | 40 |
| 43-45 | Terrace deposits | 9-2-1956 | 76 | 83 | |
| 34-3-5aab | 10-12 | Terrace deposits | 8-17-1956 | 136 | 292 |
| 20-22 | Terrace deposits | 8-17-1956 | 176 | 512 | |
| 35-37 | Terrace deposits | 8-17-1956 | 208 | 5,160 | |
| 34-3-5add | 40-45 | Terrace deposits | 3-23-1944 | 1,660 | |
| 34-3-5bab | 12-14 | Terrace deposits | 8-18-1956 | 88 | 298 |
| 29-31 | Terrace deposits | 8-18-1956 | 148 | 690 | |
| 43-45 | Terrace deposits | 8-18-1956 | 196 | 4,950 | |
| 34-3-5bbb | 23-25 | Terrace deposits | 8-17-1956 | 144 | 419 |
| 34-3-5caa | 21-23 | Terrace deposits | 9-2-1956 | 178 | 810 |
| 37-39 | Terrace deposits | 9-2-1956 | 178 | 9,160 | |
| 34-3-5dcc1 | 20 | Alluvium | 8-20-43 | 103 | |
| 34-3-5dcc2 | 37-42 | Terrace deposits | 3-24-1944 | 5,750 | |
| 34-3-8aaa | 19-21 | Terrace deposits | 9-2-1956 | 178 | 308 |
| 34-36 | Terrace deposits | 9-2-1956 | 220 | 1,060 | |
| 34-3-8acc1 | 22-24 | Alluvium | 9-2-1956 | 642 | 1,105 |
| 34-3-8acc2 | Surface | 9-2-1956 | 348 | 1,580 | |
| 34-3-8baa | 10-12 | Alluvium | 9-2-1956 | 198 | 212 |
| 32-34 | Alluvium | 9-2-1956 | 196 | 1,570 | |
| 34-3-8cdd | 15-17 | Terrace deposits | 9-2-1956 | 1,490 | 265 |
| 34-3-9dad | 20 | Terrace deposits | 8-20-1943 | 19 | |
| 34-3-15bbb | 26-28 | Terrace deposits | 6-22-1957 | 36 | |
| 34-3-15cdd | 34-36 | Alluvium | 6-22-1957 | 560 | |
| 34-3-15dcd | 20 | Alluvium | 8-20-1943 | 30 | |
| 34-3-16bbb | 15-17 | Terrace deposits | 9-2-1956 | 198 | 63 |
| 30-32 | Terrace deposits | 9-2-1956 | 564 | 277 | |
| 34-3-23ccc | 19-21 | Terrace deposits | 6- 5-1957 | 157 | |
| 34-3-26add | 28-30 | Alluvium | 6-7-1957 | 530 | |
| 34-3-26bab | 26-28 | Terrace deposits | 6-6-1957 | 960 | |
| 34-3-26bdc | 28-30 | Terrace deposits | 6-6-1957 | 650 | |
| 34-3-35aab | 28-30 | Terrace deposits | 6-7-1957 | 505 | |
| 34-3-36bab | 22-24 | Terrace deposits | 6-6-1957 | 155 | |
| 34-4-20cab | 19-21 | Terrace deposits | 6-12-1957 | 302 | |
| 34-4-30adc | 24-26 | Terrace deposits | 6-12-1957 | 86 | |
| 34-4-31aba | 21-23 | Terrace deposits | 6-11-1957 | 399 | |
| *35-3-1aaa | 34-36 | Terrace deposits | 6-8-1957 | 390 | |
| 35-4-3ada | 31-33 | Terrace deposits | 6-9-1957 | 317 | |
| 35-4-4aad | 18-20 | Terrace deposits | 6-9-1957 | 157 | |
| 35-4-5abb | 28-30 | Alluvium | 6-11-1957 | 610 | |
| 35-4-5daa | 17-19 | Terrace deposits | 6-8-1957 | 585 | |
| 35-5-18bbb | 12-14 | Terrace deposits | 6-9-1957 | 372 | |
| (a) One part per million is equivalent to one pound of substance per million pounds of water or 8.33 pounds per million gallons of water. (b) Total depth of well except where two numbers are given; 54-56 indicates depth from which water sample was pumped. * Complete analysis given in Table 6. |
|||||
Table 8--Factors for converting parts per million to equivalents per million.
| Mineral constituent |
Chemical symbol |
Factor |
|---|---|---|
| Calcium | Ca++ | 0.0499 |
| Magnesium | Mg++ | 0.0822 |
| Sodium | Na+ | 0.0435 |
| Potassium | K+ | 0.0256 |
| Carbonate | CO3-- | 0.0333 |
| Bicarbonate | HCO3- | 0.0164 |
| Sulfate | SO4-- | 0.0208 |
| Chloride | Cl- | 0.0282 |
| Fluoride | F-- | 0.0526 |
| Nitrate | NO3-- | 0.0161 |
Chemical Constituents in Relation to Use
The dissolved solids, hardness, iron, fluoride, nitrate, sulfate, and chloride in the samples of water from Cowley County are summarized in Table 9 and are discussed briefly in the following paragraphs.
Table 9--Summary of dissolved mineral consituents in water in Cowley County.
| Range, in parts per million |
Number of samples |
|---|---|
| Dissolved Solids | |
| 500 or less | 27 |
| 500 to 1,000 | 19 |
| more than 1,000 | 11 |
| Hardness | |
| 50 or less | 1 |
| 51 to 150 | 1 |
| 151 to 300 | 20 |
| more than 300 | 35 |
| Iron | |
| 0. 1 or less | 14 |
| .11 to 0.3 | 14 |
| .31 to 1. 0 | 11 |
| more than 1. 0 | 7 |
| Fluoride | |
| less than 1.0 | 53 |
| 1.0 to 1.5 | 2 |
| more than 1. 5 | 1 |
| Nitrate | |
| 45 or less | 5o |
| 46 to 90 | 5 |
| 91 to 150 | 1 |
| more than 150 | 0 |
| Sulfate | |
| 50 or less | 37 |
| 51 to 250 | go |
| more than 250 | 11 |
| Chloride | |
| 250 or less | 128 |
| 251 to 500 | 31 |
| 501 to 750 | 12 |
| 751 to 5, 000 | 27 |
| more than 5,000 | 17 |
Dissolved Solids
After water has been evaporated, the residue consists of mineral matter, some organic matter, and water of crystallization. The kind and quantity of minerals in the water determine its suitability for various uses. Water containing less than 500 ppm of dissolved solids generally is satisfactory for domestic use. Water containing more than 1,000 ppm of dissolved solids may contain enough of certain constituents to cause a noticeable taste or to render it unsuitable for use in some other respect.
The dissolved solids in the 57 samples of water from Cowley County ranged from 290 ppm to 28,300 ppm; in 11 samples the concentration exceeded 1,000 ppm.
Hardness
The hardness of water, the property that generally receives the most attention, is commonly recognized by the effect of the use of soap in the water; the soap does not lather readily and it leaves a curd on the water. Calcium and magnesium cause nearly all the hardness of ordinary water. These constituents are also the active agents in the formation of scale in steam boilers or other containers in which water is evaporated.
The calcium carbonate hardness, the calcium and magnesium, and the noncarbonate hardness of the water samples from Cowley County are given in Table 6. The carbonate or "temporary" hardness is caused by calcium and magnesium bicarbonates and is almost entirely removed by boiling. The noncarbonate or 11 permanent" hardness is caused by calcium and magnesium sulfates and chlorides and other salts and cannot be removed by boiling. Carbonate hardness and noncarbonate hardness react to soap in the same manner.
Water having a hardness of less than 50 ppm is regarded as soft, and under ordinary circumstances no treatment for removal of hardness is necessary. Hardness of 50 to 150 ppm does not seriously affect the use of water for most purposes but does increase the use of soap. Water hardness exceeding 150 ppm is easily noticeable, and if it is much more than 150 ppm, the water may need to be softened. When municipal supplies are softened, generally the hardness is decreased to about 100 ppm. Further softening of municipal supplies may not be economically justified. In most softening processes, only the carbonate or temporary hardness is removed.
The hardness of 57 samples of water from Cowley County ranged from 24 to 5,770 ppm as CaCO3. All but two samples of water had hardness in excess of 150 ppm.
Iron
Next to hardness, iron is the constituent of natural water that generally is most objectionable. The quantity may differ greatly from place to place even in water from the same formation. If water contains more than 0.3 ppm of iron in solution, the iron, upon oxidation by exposure to air, may settle out as a reddish sediment. Iron may be present in sufficient quantity to give a disagreeable taste to the water, stain cooking utensils and plumbing fixtures, and be objectionable in the preparation of foods and beverages. Aeration, followed by settling or filtration, will remove the iron from some water, but treatment with chemicals is required for others.
In the 47 samples of water analyzed for iron, the concentration ranged from 0.02 to 2.6 ppm. In 18 of the samples the amount of iron exceeded 0.3 ppm.
Fluoride
Although the quantity of fluoride present in natural water is relatively small in comparison to other common constituents, the amount present in water used by children should be known. Fluoride in water has been associated with the dental defect known as mottled enamel, which may appear on the teeth of children who, during the formation of the permanent teeth, habitually drink water containing more than 1.5 ppm of fluoride (Dean, 1936). A smaller quantity of fluoride in the drinking water (about 1 ppm) is likely to be beneficial by preventing or decreasing the incidence of caries in the permanent teeth of children (Dean and others, 1941). Fluoride is now added to many public supplies in quantities sufficient to increase the total fluoride concentration to about 1 ppm.
The fluoride content of 56 samples of water from Cowley County ranged from 0.0 to 3.0 ppm, but only one sample contained more than 1.5 ppm.
Nitrate
Large amounts of nitrate in water may cause cyanosis in infants when the water is used for drinking or in the food formula. Water containing less than 45 ppm of nitrate is generally regarded as safe, but water containing more than 90 ppm is regarded by the Kansas State Board of Health as likely to cause severe, possibly fatal, cyanosis if used continually (Metzler and Stoltenberg, 1950). The source of nitrate in natural water is not definitely known, but excessive concentrations of the constituent may be an indication of pollution.
The nitrate content in the 56 samples of water ranged from 0.9 to 111 ppm. In 50 samples the nitrate concentration was less. than 45 ppm and in only one sample was it more than 90 ppm.
Sulfate
Sulfates when combined with calcium or magnesium contribute most of the "permanent hardness" to a natural water, and the removal of these salts is both difficult and expensive. Sulfate in excessive amount (more than 500 ppm) in a domestic or stock water supply is undesirable because of the laxative effect when the water is first used for drinking. A concentration of less than 250 ppm is recommended for human consumption, although a concentration as great as 2,000 ppm may be tolerated; a somewhat greater tolerance by cattle has been observed.
The sulfate content in 138 water samples ranged from 5.3 to 1,490 ppm; 11 samples contained more than 250 ppm.
Chloride
Chloride salts are found in nature in abundance and are dissolved in widely varying quantities from many rock materials. They are found in sea water and in many ground waters at appreciable depths. Most oil-field brines contain considerable chloride. Chloride has little effect on the suitability of water for ordinary use unless present in sufficient quantity to make the water unpotable or corrosive to metal pipes and storage containers. Permissible quantities of chloride in irrigation waters vary considerably with the crop being irrigated. Removal of the chloride ion from water has been prohibitively expensive in the past, but research in recent years has discovered methods for the removal of salt from brackish water that are economically feasible.
Chloride salts in solution having a concentration of less than 250 ppm cannot be detected by taste, and such waters are regarded as satisfactory for ordinary uses. Water containing between 250 and 500 ppm of chloride may have a slightly salty taste but can be used for drinking and household uses. Water containing more than 500 ppm has a disagreeable taste but ordinarily causes no ill effects. It is reported that cattle can drink water having a chloride content of 5,000 ppm.
During the last 25 years the city of Winfield has had to abandon several wells because of salt-water contamination, and many individuals in the Arkansas River valley have reported salt-water contamination of their water supply. In the spring of 1944 about 75 test holes were drilled in the alluvium and terrace deposits in and adjacent to the Arkansas River valley. Samples were collected from these test holes and from wells in the area and these were analyzed. (See Tables 6 and 7 and Pl. 6.) During the present investigation, many additional test holes were augered and water samples collected; the results of these analyses also are given in Tables 6 and 7 and shown on Plate 6. Samples were collected at different depths in many of these later test holes, to determine whether the chlorides were confined to any particular horizon within the aquifer. In general, the greatest concentration of chlorides was near the base 'of the aquifer.
Of 215 water samples analyzed for chloride content, 87 contained chloride in excess of 250 ppm; and all but 1 were collected from wells in alluvium or terrace deposits in the Arkansas River valley and adjacent areas. Well 34-4-28aba obtains water containing 410 ppm of chloride from the Barneston Limestone at a depth of 242 feet. The chloride content of 128 samples was less than 250 ppm, and that of 17 samples was more than 5,000 ppm.
Temperature
Ordinarily the temperature of ground water receives little attention in a discussion of the quality of water or its suitability for use. Ground water is preferred by many industries that use large quantities of water for cooling because of its relatively uniform temperature. In areas where industrial users return large quantities of water to the aquifer, a marked rise in temperature of the ground water may be noted.
In Cowley County the temperature of the water, given in Table 6, ranged from 55° F to 58° F, excluding that from test hole 35-3-1aaa, in which the temperature was exceptionally low. On June 8, 1957, a sample from this test hole bad a temperature of 48° F. On August 27, 1958, this test hole was redrilled and resampled at a depth of 47 feet and the temperature was again 48° F. The cause for this abnormally low temperature was not determined.
Suitability of Water for Irrigation
This discussion of the suitability of water for irrigation is adapted from Agriculture Handbook No. 60, U. S. Department of Agriculture (U. S. Salinity Laboratory Staff, 1954).
The development and maintenance of successful irrigation projects involve not only the supplying of irrigation water to the land, but also the control of the salinity and alkalinity of the soil. Soil that was originally nonsaline and nonalkaline may become unproductive if excessive soluble salts or exchangeable sodium are allowed to accumulate because of improper irrigation and soil management or poor drainage.
The characteristics of an irrigation water that seem to be most important in determining its quality are (1) total concentration of soluble salts; (2) relative proportion of sodium to total principal cations (magnesium, calcium, sodium, and potassium); (3) concentration of boron or trace elements that may be toxic to the plant; and (4) under some conditions the concentration of bicarbonate as related to the concentration of calcium and magnesium.
For classification of irrigation water, the dissolved solids content can be adequately expressed in terms of specific conductance, which is a measure of the ability of the inorganic salts in solution to conduct an electric current. The conductivity is usually expressed in terms of micromhos per centimeter at 25° C and may be approximated by multiplying by 100 the total equivalents per million of calcium, magnesium, sodium, and potassium. Factors for converting parts per million to equivalents per million are given in Table 8. In general, water having a conductance of less than 750 micromhos is satisfactory insofar as salt content is concerned, although some salt-sensitive crops may be adversely affected by water having a conductance in the range of 250 to 750 micromhos per centimeter. Waters ranging from 750 to 2,250 micromhos per centimeter are widely used, and satisfactory crop growth is obtained under good management and favorable drainage conditions. Very few instances can be cited where water having a conductivity greater than 2,250 micromhos per centimeter has been used successfully.
The relative proportion of sodium to other cations in irrigation water may be expressed simply as the percentage of sodium. The U.S. Department of Agriculture uses the sodium-adsorption ratio (SAR) to express the relative activity of sodium ions in exchange reactions with the soil, and to measure the suitability of water for irrigation. The sodium-adsorption ratio may be determined by the formula
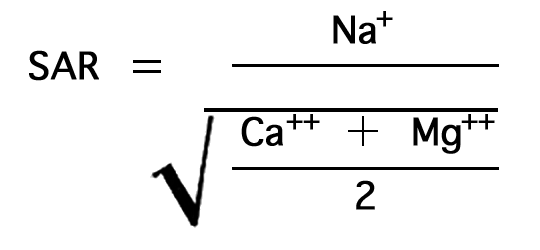
Figure 7--Nomogram for determining sodium-adsorption ratio of irrigation water.

Figure 8--Diagram showing classification of water samples from Cowley County for irrigation use.
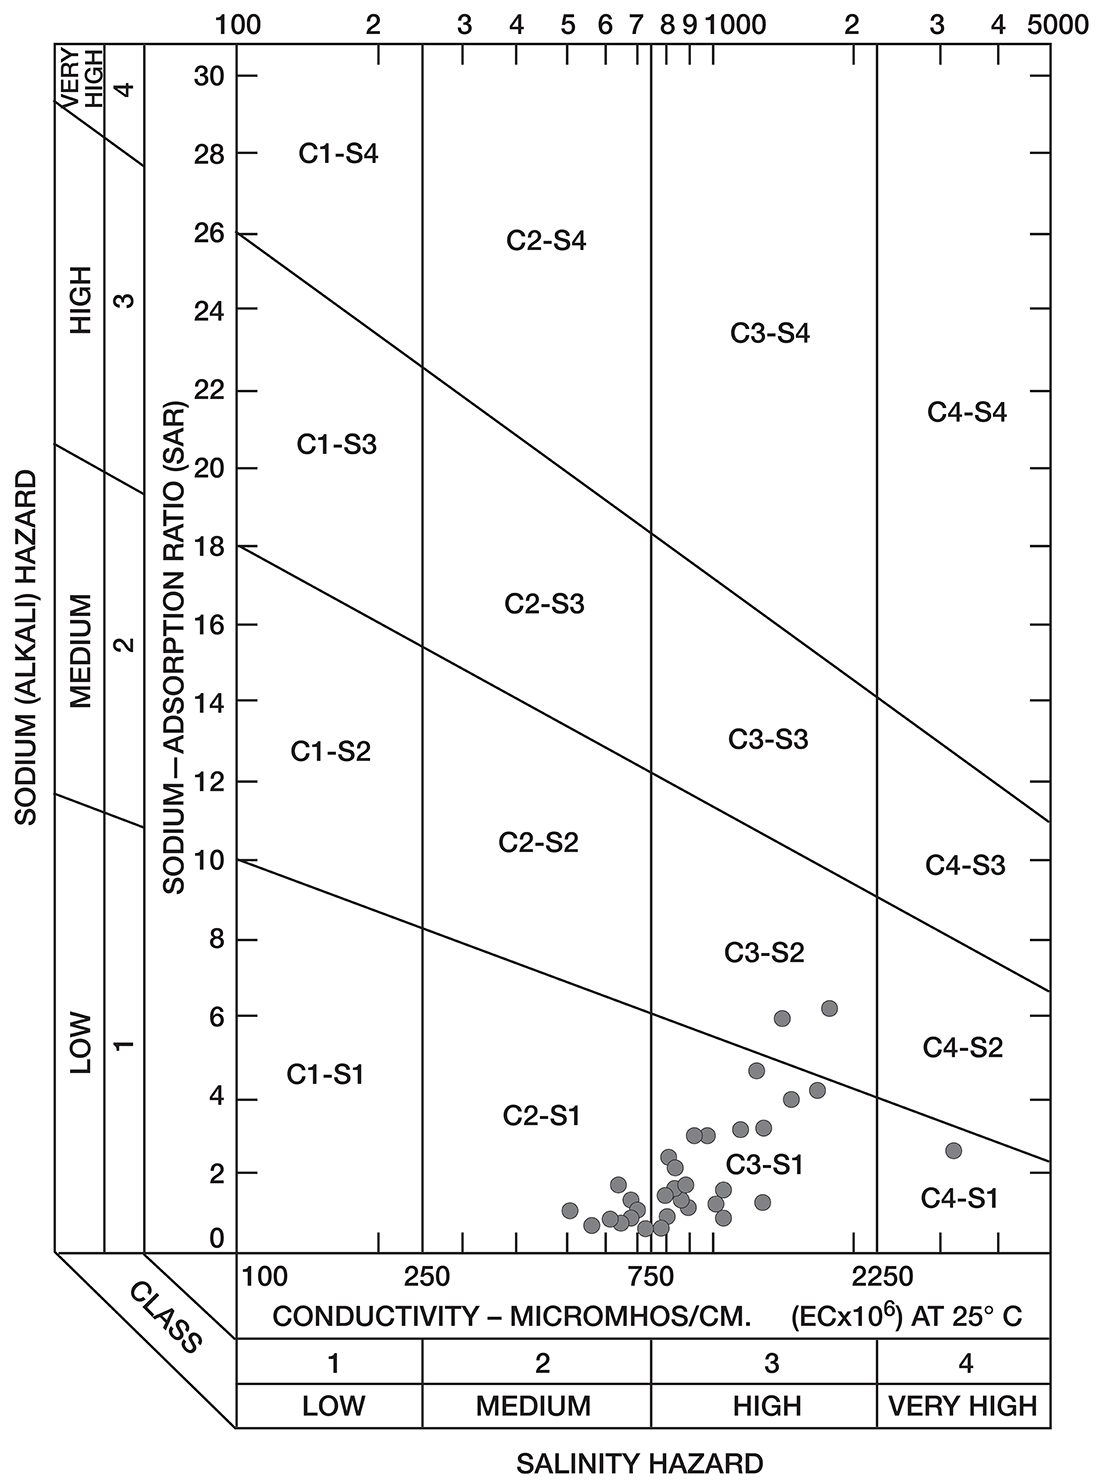
Low-salinty water (C1) (Fig. 8) can be used on most soils with little likelihood that salinity will develop. Medium-salinity water (C2) can be used if there is a moderate amount of leaching. Moderately salt-tolerant crops such as potatoes, corn, wheat, oats, and alfalfa can be irrigated with such water without special practices. High-salinity water (C3) cannot be used on soils having restricted drainage. Very high salinity water (C4) can be used only on certain very salt-tolerant crops, and then only if special practices are used. The sodium-adsorption ratio, conductivity, and class of irrigation water for samples from 37 wells in the Arkansas River valley and Walnut River valley are given in Table 10. Water from six of the wells is not suitable for irrigation. Three of the six samples of water have very large values for both the sodium-adsorption ratio and the conductivity; they are probably from areas contaminated by oil-field brines. In the other three samples, the alkali hazard is not great, but the salinity hazard exceeds the limit of satisfactory water for use in irrigation.
Table 10--Sodium-adsorption ratio (SAR), conductivity (C), and class of irrigation water from wells in Arkansas River valley and Walnut River valley
| Well number | SAR | Conductivity | Class |
|---|---|---|---|
| 30-4-19add | 0.9 | 1,040 | C3-S1 |
| 31-4-18cbb | 1.3 | 1,010 | C3-S1 |
| 32-3-6dcc | 18 | 21,500 | No plot |
| 32-3-7ddd1 | 1.0 | 870 | C3-S1 |
| 32-3-9abb | 1.6 | 630 | C2-S1 |
| 32-3-18ddc | 1 | 880 | C3-S1 |
| 32-3-21ccc | .9 | 520 | C2-S1 |
| 32-3-24bdc | 1.4 | 2,720 | No plot |
| 32-3-32cdd | 1.6 | 890 | C3-S1 |
| 32-3-32ddc | 1.2 | 690 | C2-S1 |
| 32-3-34abb | 3.1 | 4,550 | No plot |
| 32-4-6ccc | .6 | 690 | C2-S1 |
| 32-4-34ccb | .7 | 660 | C2-S1 |
| 33-3-5bbb | .4 | 570 | C2-S1 |
| 33-3-5cbc | 2.4 | 2,870 | No plot |
| 33-3-10ccc | 1.4 | 800 | C3-S1 |
| 33-3-13aaa | 2.1 | 810 | C3-S1 |
| 33-3-14dda | 2 | 830 | C3-S1 |
| 33-3-17aaa1 | 19 | 12,200 | No plot |
| 33-3-20dcc | 50 | 49,400 | No plot |
| 33-3-25bbb | 2.9 | 970 | C3-S1 |
| 33-3-34cdd | 1 | 700 | C2-S1 |
| 33-4-19adc | 1.8 | 1,020 | C3-S1 |
| 33-4-21cdd | 1.5 | 840 | C3-S1 |
| 33-4-23ccc2 | 1.1 | 1,270 | C3-S1 |
| 33-4-30add1 | 2.8 | 960 | C3-S1 |
| 34-3-4bbb | 3.8 | 1,880 | C3-S1 |
| 34-3-4bbb | 3.2 | 1,200 | C3-S1 |
| 34-3-7baa | 2.5 | 2,320 | C4-S1 |
| 34-3-23cbb | .8 | 830 | C3-S1 |
| 34-3-26bad2 | 5.9 | 1,360 | C3-S2 |
| 34-4-12bbb | .8 | 640 | C2-S1 |
| 34-4-21dcc | .4 | 740 | C2-S1 |
| 34-4-33ddd | 3.1 | 1,060 | C3-S1 |
| 34-4-34ddd | 3.9 | 1,770 | C3-S1 |
| 35-3-1aaa | 4.5 | 1,300 | C3-S1 |
| 35-4-2add | .4 | 770 | C3-S1 |
| 35-4-6bdc | 6.1 | 1,780 | C3-S2 |
The values for the other 32 samples from wells given in Table 10 are plotted in Figure 8. Nine samples of water are in the C2-S1 class and can be used in areas of good drainage and moderate leaching. Twenty samples of water are in the C3-S1 class and should not be used in areas of restricted drainage; they will require some leaching. Two samples of water in the C3-S2 class should be used only in permeable soils where considerable leaching can take place. One sample of water in the C4-S1 class would present a salinity hazard and could be used only on certain crops and would require very good soil management.
Most of the soils in the Arkansas River valley are relatively permeable, drain readily, and are thoroughly leached. In parts of the Walnut River valley and in the area underlain by Illinoisan terrace deposits (Pl. 1), some of the soils are heavy and poorly drained and cannot be leached readily.
Available information concerning trace elements in ground water in Kansas is sparse. Elements that might be toxic to plants are not known to be present in harmful quantities, however.
Prev Page--Structure || Next Page--Summary
Kansas Geological Survey, Geology
Placed on web May 21, 2009; originally published August 1962.
Comments to webadmin@kgs.ku.edu
The URL for this page is http://www.kgs.ku.edu/General/Geology/Cowley/07_gw.html