Kansas Geological Survey, Mineral Resources Series 9, originally published in 1981
Next Page--Appendix
Originally published in 1981 as Kansas Geological Survey Mineral Resources Series 9. This is, in general, the original text as published. The information has not been updated. An Acrobat PDF version (82.7 MB) is also available.
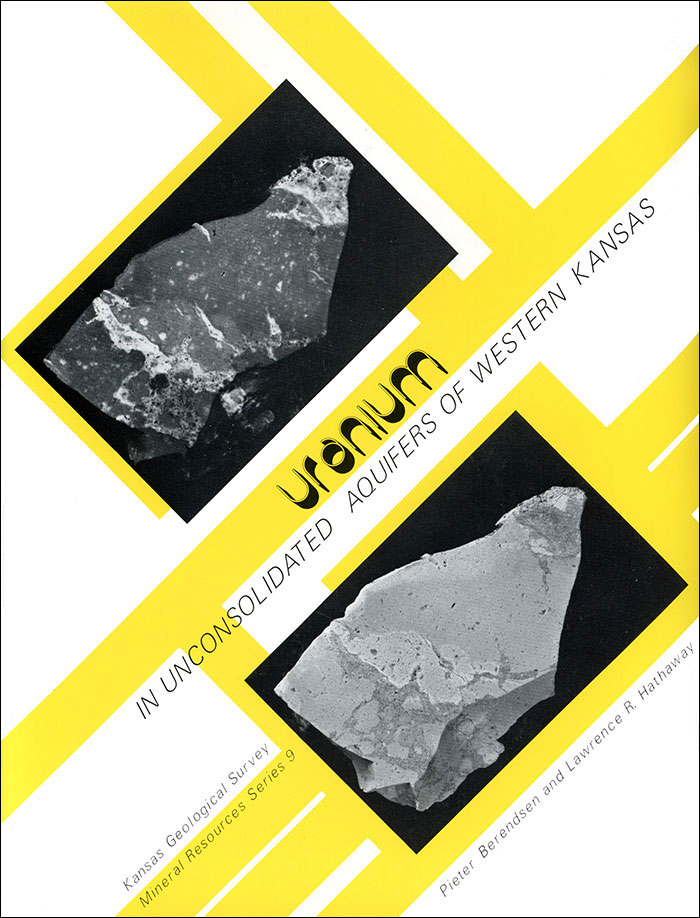
Cover Photographs: Silicified Ogallala material from Clark County, Kansas, as seen under short-wavelength ultraviolet light (upper left) and white light (lower right). Uranium-enriched silicified regions fluoresce green under ultraviolet light. Photographs by T. C. Waugh.
As the direct result of dwindling and unstable supplies of oil, gas, and coal, the search for uranium as an energy source has expanded rapidly. The U.S. Department of Energy initiated a program to evaluate most of the United States for its potential to contain uranium ore deposits. The information we gathered in western Kansas augments the available data. It is used to assess the variability that may result as a consequence of when the sample was collected, and gives a measure of the reliability of the data.
A total of 1,048 water samples from irrigation wells pumping water from the Plio-Pleistocene sediments were analyzed for their uranium content. The same samples were also analyzed for all other major and some minor constituents. The results of these analyses are reported in the Chemical Quality Series of the Kansas Geological Survey. The study shows that a large regional anomaly exists in western Kansas. The source of the uranium in the groundwater is probably the volcanic ash that is widely distributed throughout the Plio-Pleistocene sediments. No good trapping mechanisms for the uranium are available in these sediments. Reducing environments conducive to concentrating uranium are not found in the Plio-Pleistocene sediments. However, some uranium is concentrated in secondary silicified Ogallala sediments. Uranium isotope ratio studies also suggest that not much of the uranium is precipitated from the waters. However, it is possible that some of the uranium-rich waters penetrate or have access to older formations such as the Cretaceous, which may be better host rocks for uranium ore deposits.
In order to assess these possibilities, a longer term, sustained program of sampling, drilling, and chemical analysis will have to be pursued.
Groundwater samples from 1,048 irrigation wells in Plio-Pleistocene sediments, collected in western Kansas during the summers of 1974 through 1978 as part of a chemical quality study of irrigation waters, were also analyzed for their uranium content and showed a concentration range from 2 to 172 parts per billion (ppb) with a mean of 9.5 ppb. The Plio-Pleistocene sediments contain abundant source materials for potential uranium deposits in the form of volcanic ash but, with the exception of some silcrete occurrences, no favorable reducing environments have been identified within the sediments.
Except for the sediments in the Great Bend area and extending westward south of the Arkansas River, most of the area is characterized by a large regional anomaly associated with the sediments of the Ogallala Formation and the alluvium of the Arkansas River. A few threshold anomalies above 45 ppb occur along the east side of the Scott-Finney depression and in the Arkansas River alluvium. Several silcrete anomalies, showing concentration ranges up to 125 parts per million (ppm), have been identified in the Ogallala Formation. The uranium content of the silcretes is a function of the degree of silicification of the preexisting sediments, with the silica probably being derived from dissolution of the volcanic ash.
Hydrogeochemical prospecting techniques are especially useful in those areas where the rocks that are considered to be of potential economic interest cannot be sampled directly, but where the aquifers have a configuration such that the water comes in contact with enough of the rock to give a representative sample. Fix (1956) briefly discussed some of the more fundamental factors that affect the uranium content of ground and surface waters as well as some of the principles involved in proper sampling procedures. He also pointed to the difference between regional and areal background values; however, the absolute values cited are open to question. He reported that the threshold of anomaly in the western United States is about 1.0 part per billion (ppb) or 10 times the regional background (0.1 ppb).
As part of a study to better understand the nature and chemical quality of the groundwater aquifers in western Kansas (Hathaway and others, 1975, 1976, 1977, 1978, 1979) , Hathaway (1977) reported uranium concentrations ranging from 2 to 172 ppb with a mean of 14 ppb for groundwater from unconsolidated sediments. Berendsen (1977) found uranium values of up to 106 ppm in silicified material from the Ogallala Formation and 9.8 ppm in associated volcanic ash from Clark and Meade counties.
Scott and Barker (1962) reported a threshold anomaly of 48 ppb for well samples collected from Tertiary and Cretaceous aquifers in the Midcontinent region. Uranium concentrations ranged from less than 0.1 to 120 ppb. Curiously, the threshold anomaly for the region that includes western Kansas is the second highest reported for all of the 10 regions covering the United States. Only the Rocky Mountain Orogenic Belt has a higher value (54 ppb).
Landis (1960) reported on a study of the uranium content of ground and surface water in western Kansas and adjoining parts of Colorado, Oklahoma, and New Mexico, in which 231 water samples were collected in western Kansas from springs, wells, streams, and reservoirs. Generally water derived from alluvial material has a higher uranium content than that from the Pliocene Ogallala Formation. However, the average uranium content of Ogallala water is very much above the 1.0 ppb threshold anomaly reported by Fix (1956). Two samples of well water derived from what Landis (1960) thought to be Triassic rocks showed the highest average uranium (38 ppb) content compared with water derived from other units of different ages.
As part of the National Uranium Resource Evaluation (NURE) program, Union Carbide (1979) published a report of the chemical composition of 611 groundwater samples from the Pratt quadrangle and reported uranium values ranging from less than 0.20 ppb to 80 ppb with a mean of 5.3 ppb.
In the southwestern part of the study area and extending into the Texas Panhandle, anomalous amounts of helium associated with natural gas in Permian and older rocks are believed to be of radiogenic origin. Much of the uranium seems to be associated with asphaltite, which has been identified in cuttings from oil and gas wells (Pierce and others, 1956).
All of Kansas belongs to the major physiographic division of the Interior Plains. The area discussed in this study belongs to the Great Plains Province, which covers the western two-thirds of the State. This is, again, subdivided into the Dissected High Plains Section, which covers the eastern part of the study area, and the High Plains Section to the west (Schoewe, 1949).
The Arkansas River Lowlands dissecting the area in an east-west direction along the Arkansas River is the only other major section. The surface rocks are chiefly unconsolidated gravels, silts, and clays of Tertiary and Quaternary age.
The Dissected High Plains Section is made up of the Red Hills south of the Arkansas River and the Smoky Hills and Blue Hills to the north. The Smoky Hills occur to the east just outside the study area. Cretaceous strata form the bedrock of the Smoky Hills and the Blue Hills.
The Red Hills are underlain by Permian rocks. The landscape is characterized by small table-like plateaus and flat-topped hills, steep-sided buttes, pyramids, pinnacles, buttresses, and stream valleys lined by steep bluffs. solution features are common. The area is drained by the Medicine Lodge and Cimarron rivers and their tributaries.
The bluish haze in the atmosphere above the hills gave rise to the naming of the Blue Hills (Haworth, 1897, p. 47). The area is characterized by two dissected cuestas; the easternmost one is controlled by the underlying Greenhorn Limestone and the western one by the Niobrara Chalk (Fig. 1, Pl. 2).
Figure 1—Major physiographic provinces in western Kansas.
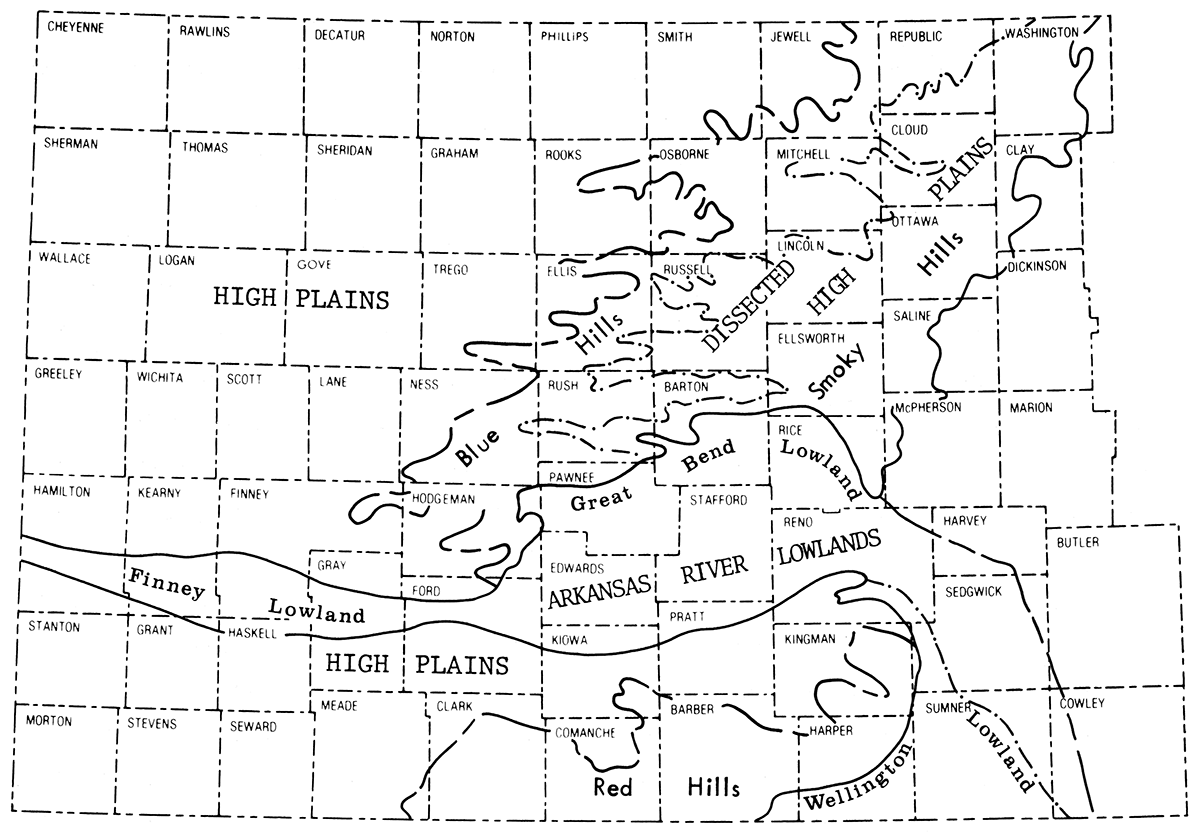
On a regional scale the Dissected High Plains Section is a treeless, featureless plain, which rises gradually westward at an average rate of two to three meters per kilometer. It is a partially dissected plateau characterized mainly by broad reaches of flat uplands that, in places, are undrained. Depressions and basins ranging from a few meters to several kilometers in diameter and generally less than three meters deep, which are related to dissolution of the salt in the lower part of the section, characterize much of the area. Cretaceous chalk, shale, and limestone (Pierre Shale, Niobrara Chalk, Carlile Shale, Greenhorn Limestone, Graneros Shale), which are exposed along the major streams, form the bedrock. The near-surface rocks consist of Tertiary (Ogallala Formation) and Quaternary deposits, all of which are unconsolidated or poorly cemented.
The two main water-bearing sequences in the area under discussion are the Plio-Pleistocene deposits, which include the Ogallala Formation, and the Pleistocene to Recent alluvial deposits associated with the more prominent streams, in particular the Arkansas River.
Darton (1899) named the Ogallala Formation from outcrops in Keith County, Nebraska. The following description of Ogallala rocks is taken from the excellent descriptions of the regional nature and occurrence of the formation by Elias (1932, 1942), Smith (1940), Frye and others (1956), and Merriam (1963); and from more restricted local geologic and geohydrologic investigations of individual counties by numerous workers from 1940 through 1965.
Plate 1 shows the area in Kansas underlain by rocks of the Pliocene Ogallala Formation. The formation consists of stream-laid sand, gravel, silt, and some clay, which were derived from a westerly source in the Rocky Mountain region of Wyoming, Colorado, and New Mexico. Because the provenance of the sediments covers a large area with varied rock types, the Ogallala Formation itself also has a variable lithology with none of the units extending very far. The sediments were deposited by aggrading streams that shifted position continually throughout the area. The sediments are generally poorly and variably indurated. The so-called "mortar beds" or caliche layers, which commonly form the caprock near the surface, resist weathering because they are cemented by calcium carbonate. The Ogallala Formation ranges in thickness from a few meters to more than 90 m. The formation was deposited on an erosional surface exposing rocks of Cretaceous age and was itself eroded after deposition, partially accounting for the changes in thickness. The formation also thickens in the direction of its source area to the west. Stream erosion along the Arkansas and Smoky Hill rivers has cut deeply into and removed much Ogallala sediment, exposing Cretaceous rocks along the valley floors.
The Ogallala Formation has been divided into three members that may be recognizable in northern Kansas, but are difficult if not impossible to recognize farther to the south. Fossil vertebrates and plant material are important in unraveling the stratigraphy. However, considerable confusion still exists with regard to the age of some of the units because it was previously not recognized that the volcanic ash beds present in the Ogallala Formation may have been derived from several sources covering a wide time span (0.61 to 1.97 million years). Thus unwarranted correlations based upon volcanic ash beds present in the sequence have arisen (Bayne, 1976).
The occurrences of Plio-Pleistocene volcanic ash beds in Kansas have been well documented by Carey and others (1952). They recognize four distinct ash units, referred to as the Calvert, Reager, Pearlette, and unnamed Ogallala. The distribution of the known near-surface volcanic ash beds is also shown in Plate 1.
Silicified Ogallala occurs locally in several places in western Kansas and was described by Frye and Swineford (1946) who, on the basis of texture, color, degree of cementation, and the predominant lithology of the original rock-type, classified the occurrences as either chert or quartzite. The source of the silica is believed to be the volcanic ash that Frye and Swineford (1946) always found stratigraphically higher or above the silicified material. In those areas where we examined the silicified material, the chert shows anomalous uranium concentrations but the quartzite does not. The uranium concentrations in the ash range from 6 to 10 parts per million (ppm), while the chert shows uranium concentrations ranging up to 106 ppm, depending upon the degree of silicification.
Predominantly, alluvial deposits of Pleistocene to Recent age composed of clay, silt, fine to coarse sand, and gravel are associated with the major rivers traversing the area in an easterly direction. These rivers are the Smoky Hill in the north-central part of the area and the Arkansas and Cimarron and their tributaries in the southern part of the area. Some loess, dune sand, and undifferentiated deposits cover much of the area. South of the Arkansas River these deposits reach thicknesses of over 90 m. Typical thickness of the alluvial fill in the Arkansas River valley is 60 m and in the Smoky Hill River valley a little over 30 m.
Permian, Jurassic, and Cretaceous rocks make up the bedrock in the study area (Pl. 2). Permian rocks consisting of shale, fine-grained sandstone, dolomite, and gypsum (Flowerpot Shale and younger units) form the bedrock in the southern tier of counties. All of the sandstones and shales were thoroughly oxidized before the Cretaceous rocks were deposited and are presently exposed as far west as eastern Meade County.
Except for one small outcrop area in southern Morton County along the Cimarron River, rocks of Jurassic age occur in the subsurface in northwestern Kansas. They form the bedrock in southwestern Kansas, but difficulty in recognizing the transition units in the subsurface has so far prevented establishing the contact with the younger rocks. Gutentag and Stullken (1974) identified rocks of Jurassic age in Haskell County. They consist mainly of varicolored red sandstones and shales and reach a maximum thickness of about 110 m. Kume and Spinazola (in preparation) recognize rocks of Jurassic age forming the bedrock over a much larger area , including parts of Morton, Stevens, Grant, Seward, Haskell, and Meade counties.
Cretaceous age rocks form the bedrock in 80 percent of the area. South of a line roughly paralleling the Arkansas River, rocks of the Lower Cretaceous Series (Cheyenne Sandstone, Kiowa Formation, and Dakota Formation) make up the bedrock. The Cheyenne Sandstone, which reaches a thickness of up to 30 m, consists mainly of light-colored, fine-grained sandstone. The overlying Kiowa Formation, 18 to 45 m thick, is mainly made up of dark gray illitic shale that becomes more sandy toward the north. Varicolored shales and siltstones with interbedded lenticular sandstones make up the bulk of the 60 to 90 m thick Dakota Formation. In outcrop, the sand lenses are always oxidized and frequently contain ironstone concretions.
Immediately north of the Arkansas River, rocks belonging to the Graneros Shale, Greenhorn Limestone, and Carlile Shale form the bedrock. The units consist of light- to dark-colored shales and thin chalky limestones with interbedded thin bentonite beds. Combined total maximum thickness of these units reaches 150 m near the Colorado state line. Farther to the north, the younger Niobrara Chalk, composed of chalk, chalky limestone, and calcareous shale, reaches a thickness of 230 m near the Colorado border and forms the bedrock over a large part of central northwestern Kansas. Overlying the Niobrara Chalk is the Pierre Shale, which reaches a thickness of up to 490 m, It forms the bedrock in the northwestern part of the State and is made up of thin-bedded, dark-colored shale with a few thin beds of bentonite.
There are few documented faults of any consequence in western Kansas. The Bear Creek Fault (Lobmeyer and Sauer, 1974) traverses southwestern Hamilton and northeastern Stanton counties in a southeasterly direction. In northwestern Grant County the fault turns abruptly in a northeasterly direction. Lobmeyer and Sauer (1974) considered this to be one continuous fault. However, the possibility that we are dealing with two intersecting faults certainly should not be ruled out. This argument may be strengthened by the fact that these two trends are parallel to the two predominant trends of other postulated and documented faults and linear structures in Kansas (Berendsen and others, 1980). Furthermore, Cole (1976) showed a northeasterly trending fault affecting the Precambrian basement rocks in eastern Morton County and extending into eastern Stanton County. These basement faults were periodically reactivated throughout geologic time (Willoughby and Berendsen, 1978). The northeasterly trending segment of the Bear Creek Fault and the fault shown by Cole (1976) may be the same fault, with the segment of the Bear Creek Fault showing renewed movement in Quaternary time. The sense of movement on the fault shown by Cole (1976) and on the northeasterly trending segment of the Bear Creek Fault is the same. Lobmeyer and Sauer (1974) showed a vertical displacement in Hamilton County of 60 m of undifferentiated Quaternary deposits with the north side of the fault being the upthrown side.
The Crooked Creek and Fowler faults (Frye and others, 1942) trend northeasterly through the center of Meade County. Gutentag and Weeks (1980) considered the two faults to be one fault or fault system with the east side being the upthrown block. Frye and others (1942) showed a vertical displacement of 60 m near the town of Fowler. About 15 km south of the town of Meade, the Crooked Creek Fault consists of a five-kilometer-wide structural trough, fault-bounded on each side. Frye and others (1942) reported that the first recognizable faulting took place at the close of middle Pliocene time.
The last major episode of tectonism, as evidenced by widespread movement on major faults in Kansas, took place in early Pennsylvanian time. Major linear structural trends, apparent on aeromagnetic maps and from high-altitude photography, correlate well with major stream courses (Berendsen and others, 1980). In many cases the streams follow planes of weakness or faults that are apparent in the deeper subsurface. The Crooked Creek and Bear Creek faults are examples of this, with renewed movement taking place in Pliocene time.
Several northwest and north-northeast trending faults have been identified affecting Paleozoic and older rocks associated with the Central Kansas Uplift (Merriam, 1963; Cole, 1976). Numerous minor faults with offsets on the order of several meters are common in the Niobrara Chalk, but not much is known about the nature of these faults.
The Scott-Finney depression is an asymmetrical trough with its long axis extending in a south-north direction from Garden City to Scott City and beyond (Waite, 1947). It was formed in pre-Tertiary time as a result of folding, but was probably again affected by deformational processes after the Ogallala was deposited. In the deepest part of the depression, to the south of Shallow Water, all of the Ogallala was removed and only Pleistocene undifferentiated material is present above the Niobrara Chalk.
Basically the groundwater flows in an easterly direction, modified by north-south flow patterns associated with the rivers traversing the area as well as the presence of bedrock highs. Undoubtedly, other unknown features like the ScottFinney depression influence the groundwater flow patterns. The Scott-Finney depression is an internal drainage basin with no surface water escaping from it.
The groundwater flow patterns are governed by the general dip of the beds and the lithology of the rock material. Regional and local structures such as faults, folds, solution collapses, and others exercise a modifying effect on these general patterns.
We examined and sampled the Pliocene Ogallala Formation and the Plio-Pleistocene volcanic ash deposits in many places in western Kansas to determine the distribution of uranium within these rock types. In the field a Mount Sopris Scintillometer (Model SC-132) was used to record the radioactivity of the various rock types. Wherever anomalous readings were recorded, samples were taken for laboratory analysis.
Samples were prepared for analysis using a small jaw crusher with porcelain plates and a Spex Industries shatterbox.
All samples were analyzed for their uranium content by wavelength-dispersive x-ray fluorescence spectrometry using a Philips 1410 vacuum spectrograph with an XRG 3000-watt generator operated at 50 kV and 50 mA. A molybdenum target x-ray tube with a LiF220 analyzing crystal was employed (James, 1977a).
Duplicate analyses using different analytical methods were obtained for a number of samples. These methods included analysis by gamma-ray spectrometer (Bunker and Bush, U.S. Geological Survey, Denver, Colorado), radiometry (U.S. Bureau of Mines, Reno, Nevada), and fluorimetry (Hazen Research, Golden, Colorado).
In 1974, the Kansas Geological Survey initiated a program to investigate the chemical quality relationships for irrigation waters from the unconsolidated aquifers of western Kansas. During the last week of July in 1974, 1975, 1976, 1977, and 1978, water samples were collected from pumping irrigation wells in five- to 11-county areas; the number of wells sampled each year varied from 154 to 315. In this five-year span a total of 1,048 different wells were sampled in 35 western counties of the State. Discussions of sample collection, handling procedures, and analytical methods used for major chemical constituents, as well as geochemical classifications of these groundwaters, may be found in Hathaway and others (1975, 1976, 1977, 1978, 1979).
Groundwater samples used for uranium analysis were splits from samples collected for the study of chemical quality of irrigation waters. These samples were collected in one-liter polyethylene bottles, which contained three milliliters of concentrated hydrochloric acid. The resultant solutions had pH values of about 1.5. Uranium levels of groundwater samples were determined by x-ray fluorescence (XRF) , using either Chelex-100 chelating ion-exchange resin to pre-concentrate the uranium by batch process (Hathaway and James, 1975) or using resin-impregnated filter membranes (Hathaway and James, 1977). Uranium values were determined for 40 of the 154 samples collected in 1974, all by batch process. In subsequent years, uranium values were determined for all wells sampled; 33 samples in 1975 were analyzed by batch process and all other determinations were made by use of the impregnated filter membranes. Results of the analyses are tabulated in the Appendix.
The five annual sampling programs yielded 49 wells that were sampled during two consecutive years. Chemical-quality data from these wells were used as a guide in integrating the data of the five individual sampling programs into a regional composite. The average difference in uranium levels for these 49 wells was 1.8 ppb.
Uranium levels were also monitored in filtered water samples from the Arkansas River at Syracuse, Kansas, on a monthly basis between January 1976 and February 1977. In addition, nine groundwater samples were collected in 1977 for total uranium and 234U/238U activity ratio determinations by J.B. Cowart, Florida State University, using alpha pulse height spectroscopy (Cowart, 1974). Water from the wells selected had been evaluated by XRF in 1974-1975.
Silicified fluviatile sediments of the Ogallala Formation containing anomalous uranium concentrations form a continuous northwest-southeast trending outcrop band in eastern Meade and western Clark counties (Fig. 2). This band can be traced on the surface for about 18 km and has a maximum composite width of about 3 km. Toward the southeast, the Ogallala sediments are eroded and toward the northwest the unit dips under younger loess deposits. The pre-existing fluviatile sediments of the Ogallala Formation have been replaced by a mixture of calcite, quartz, and alpha-cristobalite, giving rise to a well-indurated rock unit. The maximum thickness of the replaced rock reaches about 3 m near the center and tapers off toward either side. The degree of replacement also diminishes toward the sides. Field observations suggest that the unit was formed by replacement of pre-existing sediment in a braided channel some time after the rocks were deposited. Several arms or branches of the stream can be traced in the field (Fig. 2). Evidence for a channel-type deposit can be found in Sec. 21, T. 32 S., R. 25 W. in Clark County, where the silicified Ogallala directly overlies a depression in the underlying Permian red shales. The area was surveyed with a Mount Sopris SC-132 scintillometer and it was found that only the silicified sediments showed anomalous radioactivity. The results of analyses for uranium of a number of samples are shown in Table 1. The unaltered unsilicified sediments consist of quartz grains and pebbles cemented by calcium carbonate and have a uranium content of only a few parts per million U3O8 (sample 8). A sample (1B) collected from a more resistant bed (caliche) a few feet below a silicified unit consists mainly of calcium carbonate with minor quartz and has a uranium content of about 17 ppm U3O8. The uranium content of the rock is a function of the degree of silicification. The most intensely silicified rocks contain up to 125 ppm U3O8 (Table 1). X-ray diffraction patterns of selected samples confirm this observation in a qualitative sense, and indicate that the uranium content is a function of the amount of alpha-cristobalite in the sample. Naturally occurring hydrous silicas of this type are referred to as Opal-C by Jones and Segnit (1971).
Figure 2—Distribution of the silicified sediments of the Ogallala Formation in Clark and Meade counties. See Table 4 for sample locations.
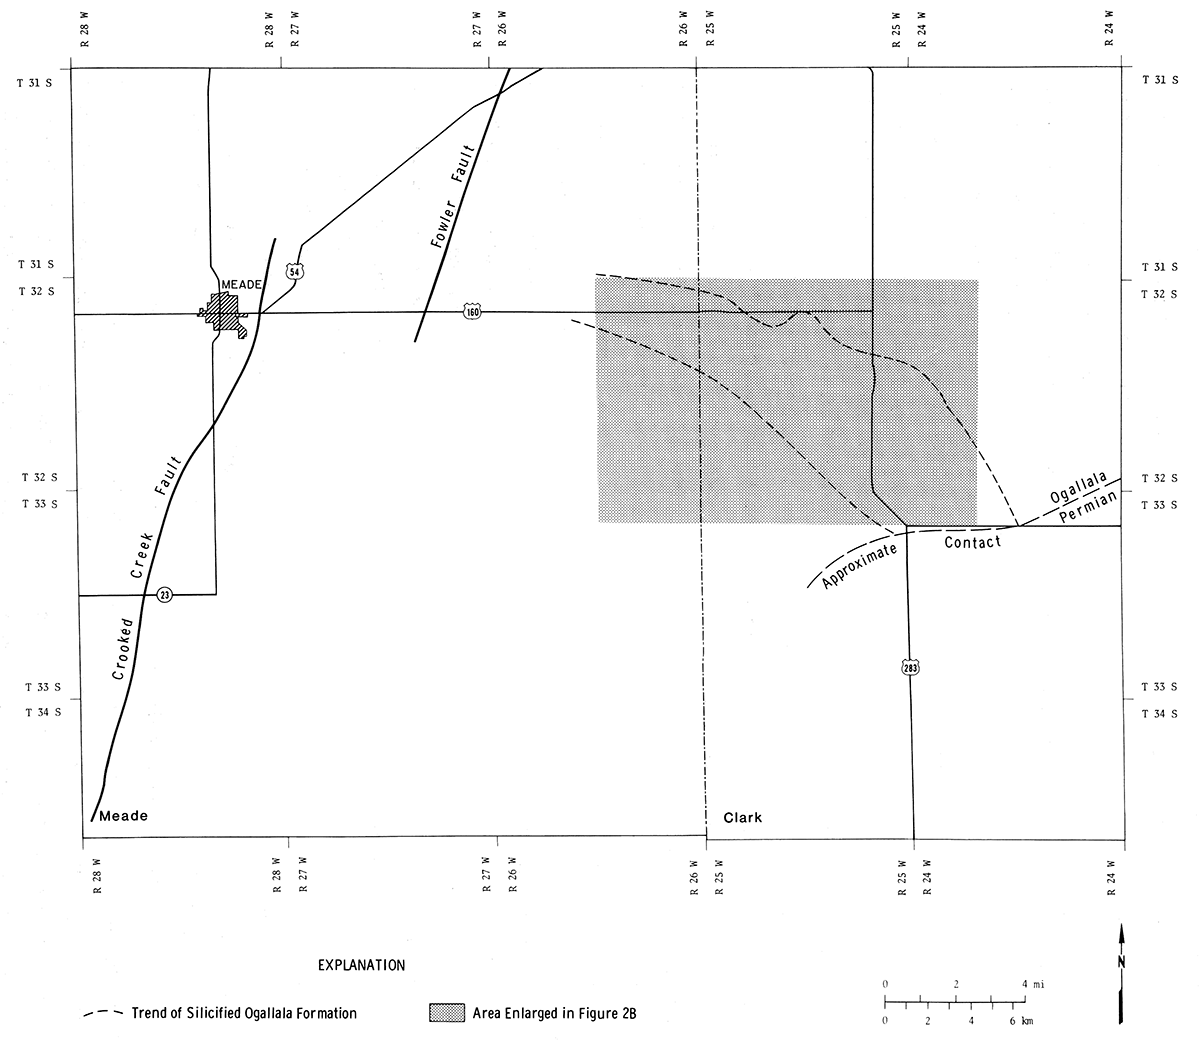
Figure 2, continued—Detail of distribution of silicified sediments.
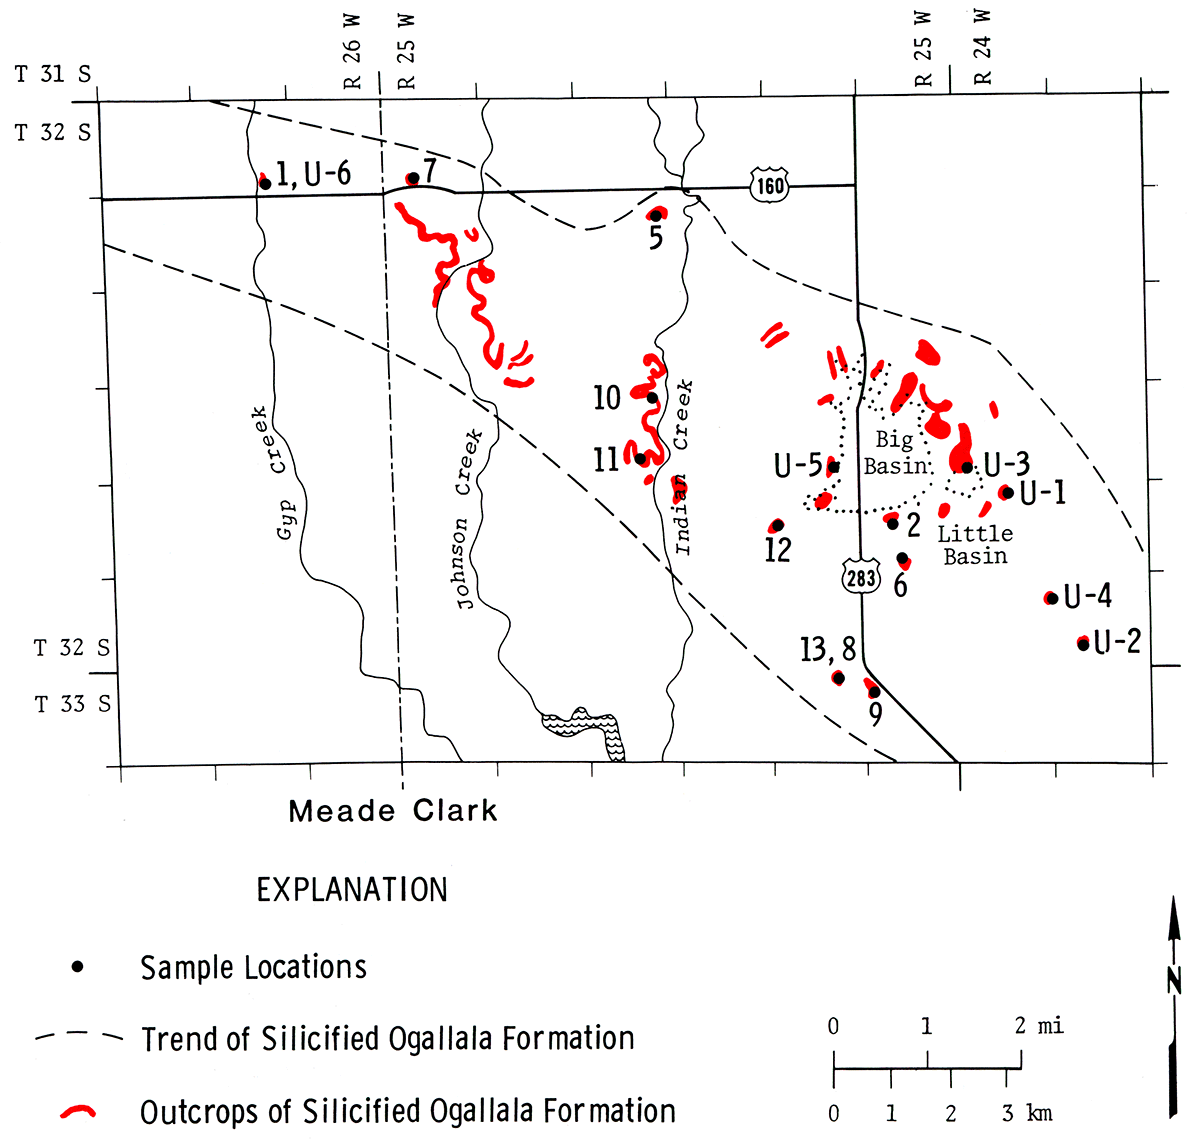
Table 1—Uranium content of silicified and unsilicified sediments of the Ogallala Formation in Clark and Meade counties. Location of sample sites shown in Figure 4.
| Sample Designation |
Rock Type | U3O8 in ppm | |||
|---|---|---|---|---|---|
| A* | B* | C* | D* | ||
| 1A | Unsilicified | 8 | <10 | ||
| 1B | Unsilicified | 17 | 13 | 20 | |
| 1C | Partially Silicified | 35 | 33 | 30 | |
| 1D | Silicified | 91 | 87 | 80 | |
| 2 | Silicified | 85 | 93 | ||
| 5 | Silicified | 88 | 92 | 80 | |
| 6 | Silicified | 65 | 68 | 60 | |
| 7 | Silicified | 120 | 121 | 100 | |
| 8 | Unsilicified | 2 | <10 | <10 | |
| 9 | Silicified | 84 | 99 | 80 | |
| 10 | Silicified | 52 | |||
| 11 | Silicified | 64 | |||
| 12 | Silicified | 112 | |||
| 13 | Silicified | 99 | |||
| U-1 | Partially Silicified | 44 | |||
| U-2 | Silicified | 62 | |||
| U-3 | Silicified | 94 | |||
| U-4 | Silicified | 69 | |||
| U-5 | Partially Silicified | 19 | |||
| U-6 | Silicified | 123 | |||
| A* Analyses carried out at KGS--X-ray fluorescence. B* Analyses carried out by Hazen Research—Fluorimetry. C* Analyses carried out by U.S. Bureau of Mines—Radiometric. The results only indicate general uranium levels; they are not assay values. D* Analyses carried out by Bendix Field Engineering Corporation—Fluorimetry. |
|||||
We took the average ratio of the major peaks of Opal-C to quartz for the six samples analyzed and divided the individual ratios by the parts per million uranium found in the sample. This generated a constant which was used to recalculate the uranium content of the samples. Table 2 shows that there is a definite relationship between the Opal-C and the uranium content of the samples.
Table 2—Correlation between the amount of Opal-C and the uranium content of the silicified sediments.
| Sample | Peak height A = (Opal-C/quartz) (arbitrary units) |
U3O8 ppm (KGS analyses) |
U3O8 ppm/A* | Recalculated U3O8 ppm (constant x A) |
|---|---|---|---|---|
| 9 | 50/27 = 1.85 | 84 | 45.4 | 86 |
| 7 | 28/10 = 2.73 | 120 | 44.0 | 127 |
| 5 | 26/12 = 2.17 | 88 | 40.5 | 101 |
| 6 | 37/30 = 1.23 | 65 | 52.8 | 57 |
| 1C | 15/15 = 1.00 | 35 | 35.0 | 47 |
| 1D | 52/35 = 1.49 | 91 | 61.1 | 69 |
| Average 46.5 | ||||
| *Average = Constant = U3O8 ppm/A | ||||
The degree of silicification can easily be assessed in the field (Figs. 3, 4) and is especially evident if the rocks are examined with an ultraviolet light source (see cover photograph). Many of the outcrops in the area were examined with a model MS-47 "Mineralight" ultraviolet light. The calcium carbonate cement in the rock is the first constituent to be replaced by the silica, followed by replacement of the clasts. X-ray diffraction patterns show that the rock consists of calcite, quartz, and alpha-cristobalite. To study the nature of the mineralization in the silicified samples, J. R. Dooley, Jr., of the U.S. Geological Survey in Denver analyzed sawed rock sections and thin sections using the Radioluxographic method (Dooley and others, 1977). In completely silicified samples (U-6, 123 ppm U3O8) the uranium is evenly distributed throughout the specimen and appears as many tiny spots on the photograph (Fig. 5). Sample U-2 (62 ppm U3O8) contains a few clasts of partially replaced calcium carbonate, which clearly show in the autoradiograph as having less radioactivity (Fig. 6). No uranium-bearing minerals can be recognized either on the photographs obtained with the Radioluxograph or on the x-ray diffraction patterns. It is believed that the uranium atoms are distributed throughout the structure of the alpha-cristobalite, perhaps even preventing this material from converting into a more ordered structure.
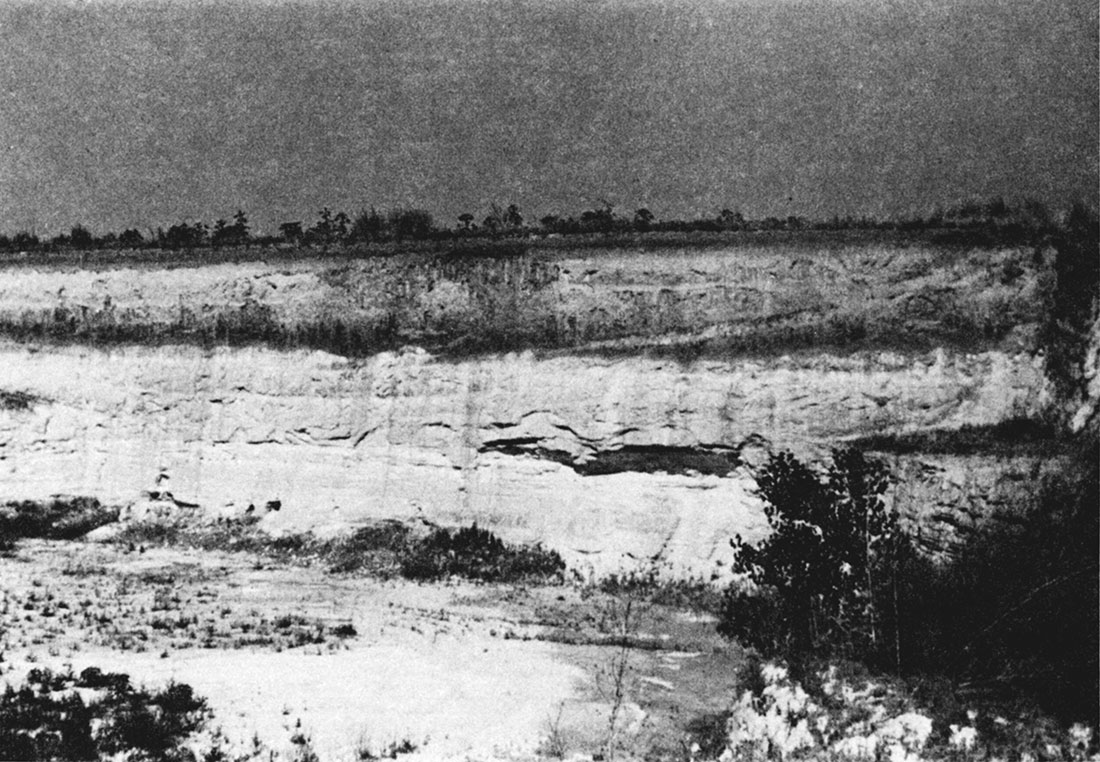
Figure 3—Outcrops of silicified material of the Ogallala Formation along the northern edge of Big Basin, Clark County (T. 32 S., R. 25 W.).
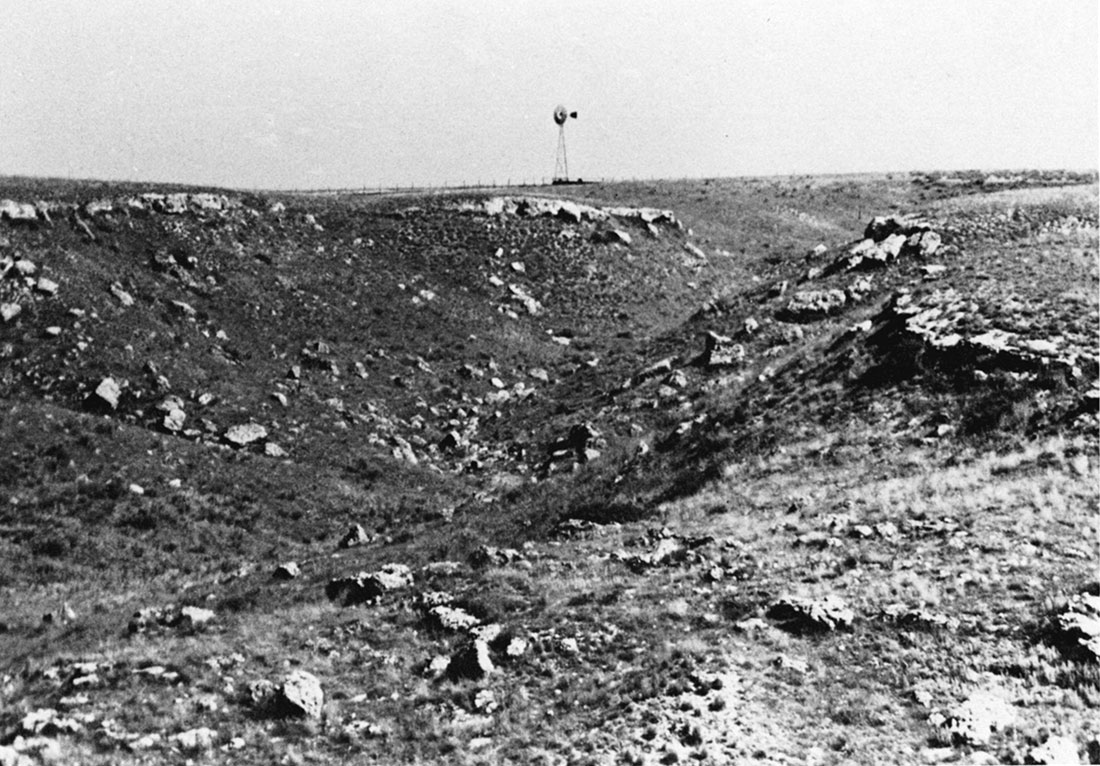
Figure 4—Silicified Ogallala Formation showing the sharp lower contact and gradational upper contact with the unsilicified material (T. 32 S., R. 25 W.).
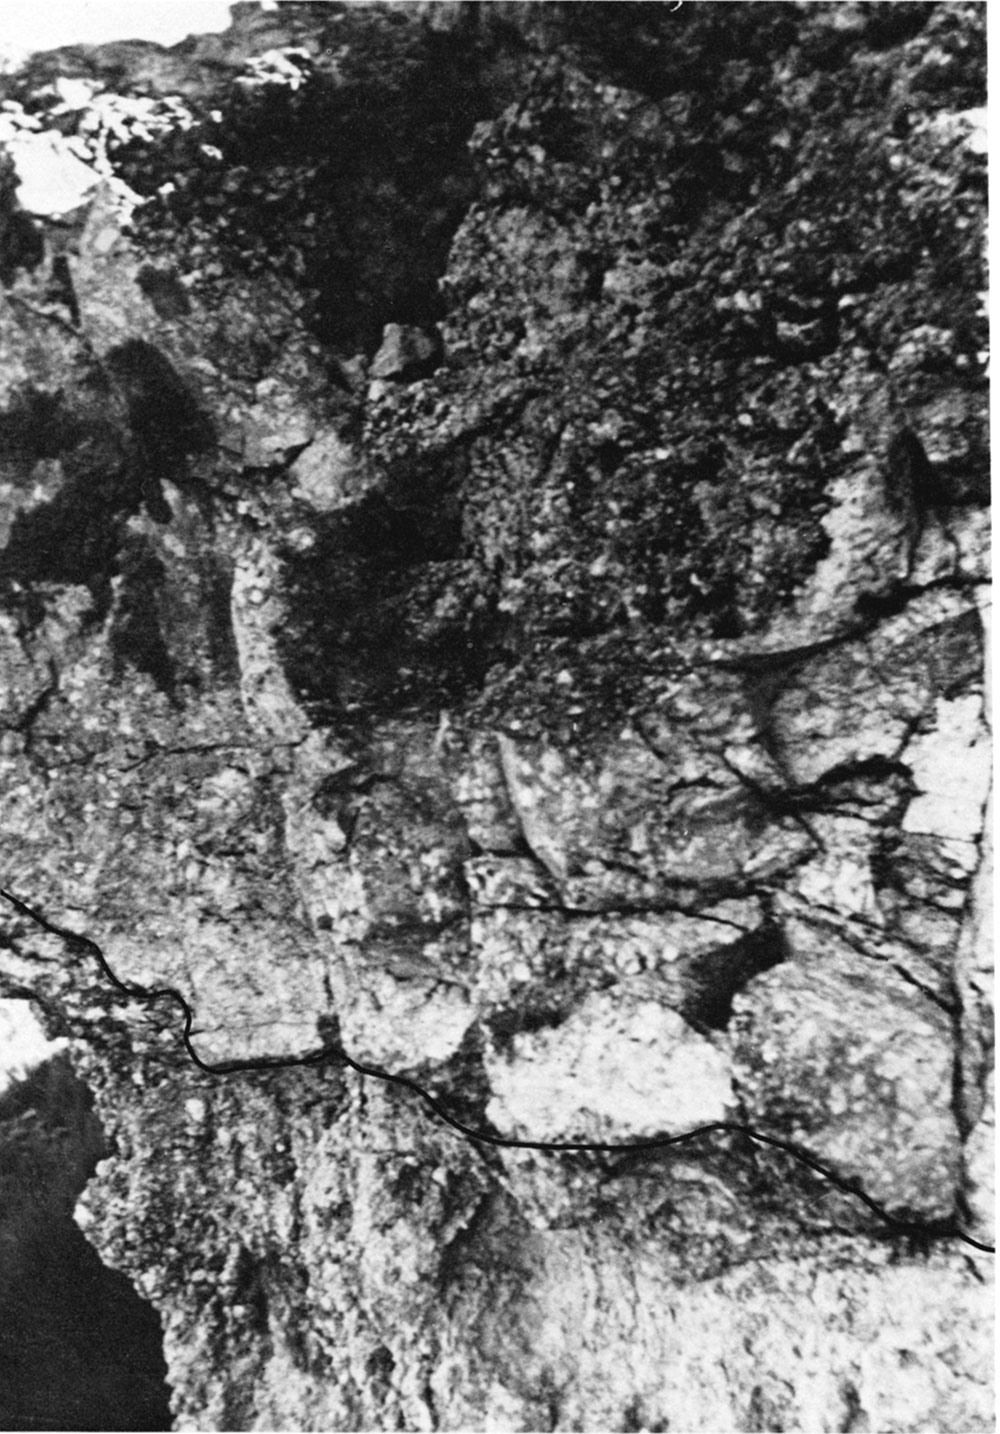
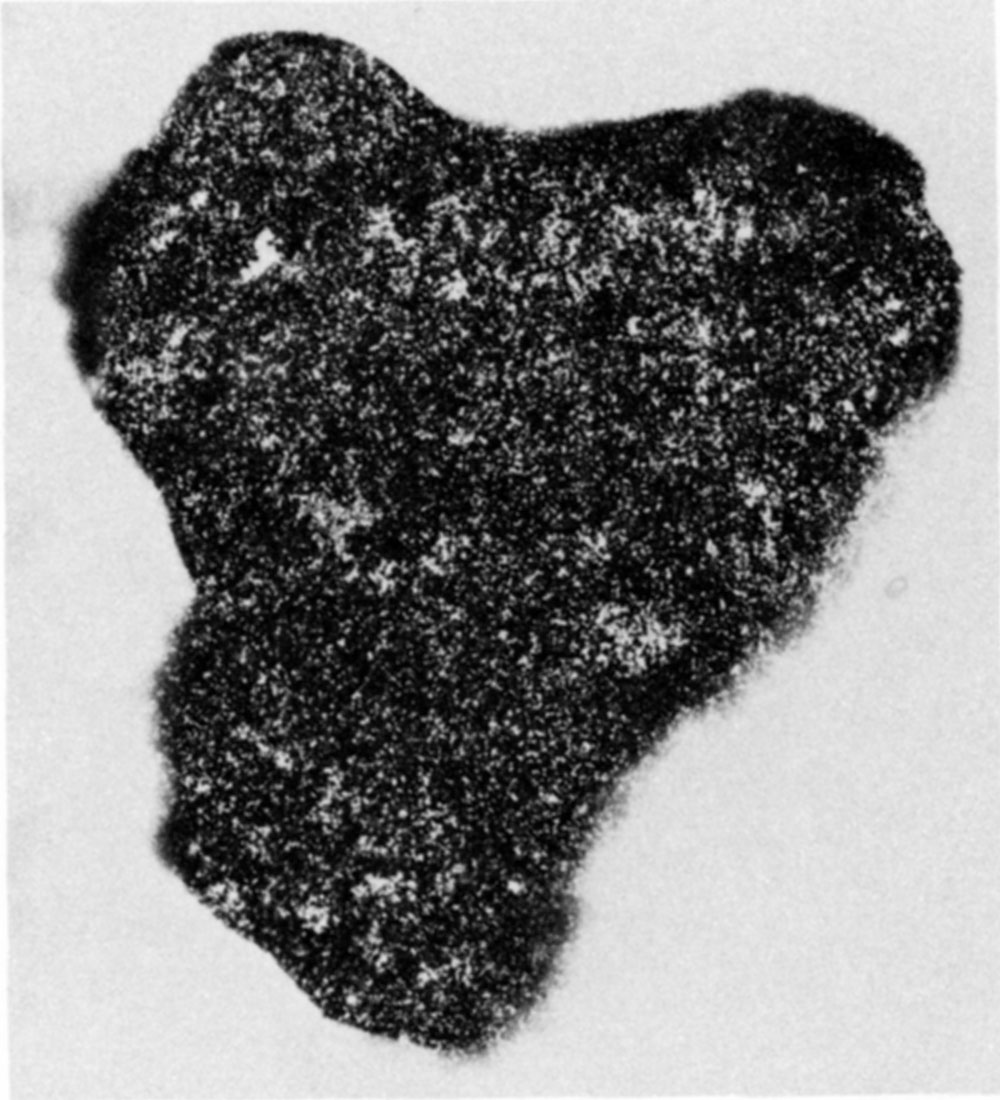
Figure 5—Radioluxograph of silicified Ogallala Formation (sample U-6, 123 ppm U3O8, exposure time 70 hours) shows the fairly even distribution of radioactive material throughout the sample. Radioluxograph made by J. R. Dooley, U.S. Geological Survey, Denver.
It is postulated that the source of the uranium as well as the silica in silicified material is the volcanic ash of Plio-Pleistocene age. Frye and Swineford (1946) believed that the volcanic ash was the source material for the silica, but Franks and Swineford (1959) proposed that leaching of Ogallala sediments in Scott County freed enough silica, sodium, potassium, calcium, aluminum, etc., to be redeposited as opal with a disordered low-cristobalite structure. If the volcanic ash is indeed the source for the uranium, the lack of widespread obvious alteration of the volcanic ash presents a problem. Swineford and Frye (1946) described alteration in the form of narrow anistropic boundaries around the edges of glass shards. They contended that what they considered pliocene ashes were generally more altered than Pleistocene ashes. An x-ray diffraction pattern from a well-bedded 1.5 meter-thick volcanic ash bed (Fig. 7) just north of the outcrop of silicified Ogallala shows no devitrification and contains 8 ppm U3O8. Except in a few thin beds up to 13 cm thick, most of the volcanic ash in this outcrop is contaminated to varying degrees with sand and silt particles.
Figure 6—Radioluxograph of silicified Ogallala Formation (sample U-2, 62 ppm U3O8, exposure time 144 hours). Partially silicified and lesss radioactive clasts are easily identified. Radioluxograph made by J.R. Dooley, U.S. Geological Survey, Denver.
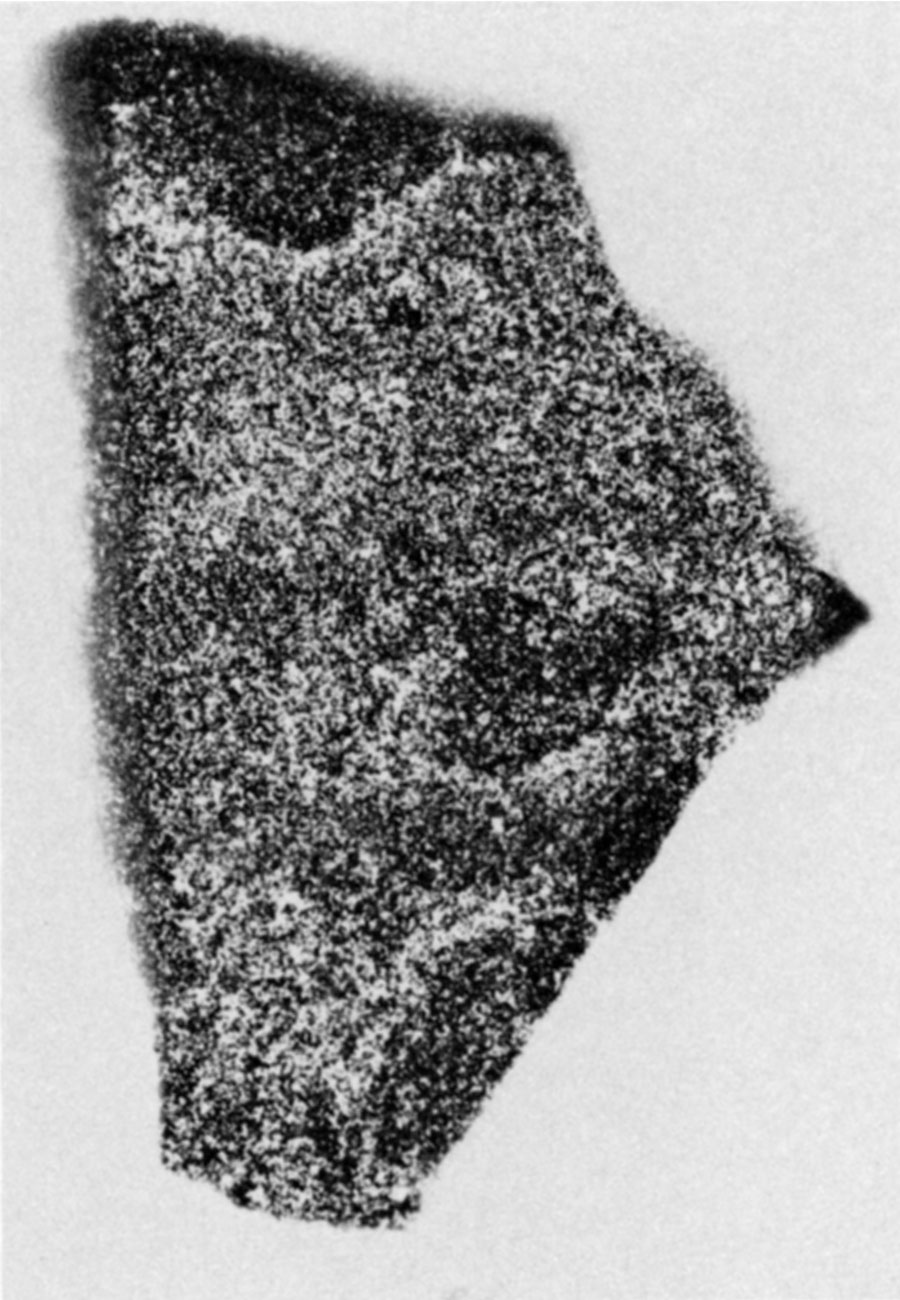
Figure 7—Volcanic ash pit in Clark County (Sec. 23, T. 30 S., R. 24 W.). The ash is generally contaminated with other sedimentary materials. Only about 13 cm of clean ash occur near the center of the outcrop. The deposit is ovep\rlain by about 3 m of alluvium.
All of the volcanic ash occurrences in Kansas are considered to be secondary concentrations of limited areal extent. After being distributed by wind over the existing land surface, the material was carried by water into low-lying areas (Carey and others, 1952). There is no way of telling by examining an outcrop whether the material has undergone more than one erosional cycle. It seems reasonable to believe that all gradations between uncontaminated volcanic ash and Ogallala containing only a few percent ash are present. No work has been carried out and indeed it would be difficult to recognize a sediment containing, for example, 15 percent volcanic ash. It is also possible that minor amounts of volcanic ash contained within the sediment are more easily altered and are thus more difficult to recognize. Chemical analyses from the ash occurrence in Clark County (Carey and others, 1952) and, for comparison, from the santana Tuff, Trans-Pecos, Texas (Henry and Tyner, 1978), are reproduced in Table 3. Henry and Tyner (1978) considered their sample to be a devitrified, high-silica, alkali rhyolite, low in aluminum, calcium, magnesium, and iron. The volcanic ash from Kansas is quite similar and, judging from the available chemical data, is peralkaline in nature, having a molar (Na + K)/Al lower than 1. The ash contains about 8 ppm U3O8, which is typical of many of the volcanic ash units elsewhere; 28 ppm thorium; and 4.9 percent potassium by weight.
Table 3—Chemical composition of volcanic ash (weight percent) from Clark County (Sec. 23, T. 30 S., R. 24 W.) and from Texas.
| SiO2 | Al2O3 | Fe2O3 | TiO2 | CaO | MgO | K2O | Na2O | |
|---|---|---|---|---|---|---|---|---|
| Clark County | ||||||||
| 1. | 73.73 | 11.67 | 1.63 | 0.49 | 0.73 | 0.09 | 4.95 | 2.71 |
| 2. | 73.34 | 10.96 | 1.86 | 0.68 | 0.87 | 0.14 | 4.80 | 3.33 |
| Santana Tuff, Texas | ||||||||
| 76.0 | 12.18 | 1.99 | 0.11 | 0.52 | 0.03 | 5.12 | 3.75 | |
| Clark County: Carey and others, 1952 Texas: Henry and Tyner, 1978 |
||||||||
The results of thorium and potassium analyses carried out on a few samples are shown in Table 4.
Table 4—Thorium, potassium, selenium, and molybdenum content of some silicified and unsilicified samples from Clark and Meade counties. Sample locations are shown in Figure 4.
| Sample Designation |
Thorium ppm |
K pct. |
Se ppm |
Mo ppm |
|---|---|---|---|---|
| 1B* | <1 | 0.15 | ||
| 1C* | 0.07 | |||
| 1D* | ||||
| 5* | ||||
| 6* | 0.10 | |||
| 7* | ||||
| 8* | 1.8 | 1.28 | ||
| 9* | 0.34 | |||
| 10** | 11 | 0.05 | 0 | <1 |
| 11** | 12 | <0.01 | 0 | 2 |
| 12** | 10 | <0.01 | <0.1 | 2 |
| 13** | 14 | <0.01 | 0 | <1 |
| * Analysis provided by C. M. Bunker and C. A. Bush, U.S. Geological Survey, Denver (gamma-ray spectrometer). **Analysis provided by Bendix Field Engineering Corporation, Grand Junction, Colorado. |
||||
Uranium leached from the volcanic ash was concentrated in the surrounding silicified sediments; the enrichment depends on the degree of silicification. What happens to the thorium is poorly understood. The volcanic ash contains about four times as much thorium as uranium, but the silicified sediments contain five to 10 times less thorium than uranium. Several possibilities for this phenomenon exist. Uranium may be preferentially leached from the volcanic ash and thorium may concentrate in the alteration products, which may include montmorillonite, opal, clinoptilolite, quartz, and analcime. Some of the uranium may have been derived from water-soluble salts adsorbed on the surface of the fresh volcanic glass shards. Or, thorium was leached with the uranium from the volcanic ash, but was not concentrated in the same manner as urani um and may have escaped from the mineral assemblage. However, we found no altered ash in the course of this work to substantiate either of these hypotheses.
In Table 4 other miscellaneous element analyses of some of the samples are given and they show that the amounts of phosphate, selenium and molybdenum are quite low in the silicified material.
We examined volcanic ash deposits and Ogallala outcrops in other parts of the State, some of which are listed in Table 5. Samples were collected from several ash deposits, but scintillometer readings obtained on the sediments showed them all to be low in radioactivity. Uranium and thorium analyses of the volcanic ash are also given in Table 5. They show the same range as reported by James (1977b). X-ray diffraction patterns show little or no devitrification of the samples. Frye and Swineford (1946) noted two types of silicification in the Ogallala, but neither the quartzite (Table 5) nor the chert seemed to contain anomalous radioactivity. An x-ray diffraction pattern of the green quartzite (Sec. 14, T. 5 S., R. 19 W. in Phillips County) indeed shows it to be quite different from the typical silicified Ogallala described from Clark and Meade counties and from Cheyenne County. This rock consists of quartz and feldspar (microcline and albite). Furthermore, no extensive silicification such as that decribed from Meade and Clark counties was observed anywhere else. The spotty silicification in Scott County (Franks and swineford, 1959) may indeed be the result of a different process.
Table 5—Uranium and thorium content of volcanic ash in western Kansas and of sediments of the Ogallala Formation exclusive of Clark and Meade counties.
| Location | Scintillometer reading (with [first number] and without [second number] lead shield in place) |
U Content (ppm) |
Th Content (ppm) |
Age of the ash |
|---|---|---|---|---|
| Volcanic Ash | ||||
| Sec. 25, T. 2 S., R. 22 W. | 270-320 | Pliocene | ||
| Sec. 17, T. 14 S., R. 19 W. | 180-210 | Pliocene | ||
| Sec. 18, T. 7 S., R. 18 W. | 225-275 | 8 | 34 | Pliocene |
| Sec. 34, T. 8 S., R. 28 W. | 500-575 | 7 | 34 | Pliocene |
| Sec. 12, T. 13 S., R. 35 W. | 8 | 37 | Pliocene? Directly overlies Cret. Pierre Shale? |
|
| Sec. 11, T. 3 S., R. 33 W. | 165-195 | 7 | 26 | Pliocene |
| Sec. 23, T. 30 S., R. 24 W. | 225-265 | 9 | Pliocene | |
| Location | Scintillometer reading (with [first number] and without [second number] lead shield in place) |
Rock type | Estimated equivalent U3O8 content** (ppm) |
|---|---|---|---|
| Ogallala Formation | |||
| Sec. 13, T. 20 S., R. 37 W. | 90-105 | Non-silicified | <10 |
| Sec. 30, T. 18 S., R. 37 W. | 140-165 | Partially silicified | 6** |
| Sec. 7, T. 17 S., R. 35 W. | ~100 | Non-silicified | <10 |
| Sec. 1B, T. 10 S., R. 39 W. | ~120 | Non-silicified | <10 |
| Sec. 19, T. 11 S., R. 3B W. | <100 | Non-silicified | <10 |
| Sec. 14, T. 5 S., R. 19 W. | Silicified (green quartzite) | 2** | |
| Sec. 7, T. 14 S, R. 38 W. | 135-150 | Partially silicified | <10 |
| Sec. 2, T. 5 S., R. 42 W. | 115-135 | Partially silicified | <10 |
| Sec. 35, T. 4 S., R. 42 W. | 275-310 | Partially silicified | <20 |
| Sec. 32, T. 4 S., R. 41 W. | ~100 | Non-silicified | <10 |
| Sec. 11, T. 3 S., R. 33 W. | ~120 | Non-silicified | <10 |
| Sec. 6, T. 9 S., R. 21 W. | 200-245 | Silicified (green quartzite) | <10 |
| * Common scintillometer background values are in the range from 80-120 cps (<10 ppm equivalent U3O8). **U3O8 content analyzed. |
|||
Irregularly silicified Ogallala in Cheyenne County (Sec. 2, T. 5 S., R. 42 W.) shows anomalous radioactivity. The material occurs on the surface and reaches a thickness of up to 2 m, However, the uneven or spotty distribution and lesser degree of silification sets it apart from the material in Clark and Meade counties. The history of silicification of this material is more complicated than that in Clark and Meade counties. Two generations of alpha-cristobalite are present (Fig. 8). The material was first silicified; subsequently solution cavities were formed, which were later filled in with a second generation of alpha-cristobalite.
Figure 8—Silicified Ogallala Formation from Cheyenne County (Sec. 35, T. 4 S., R. 42 W.).
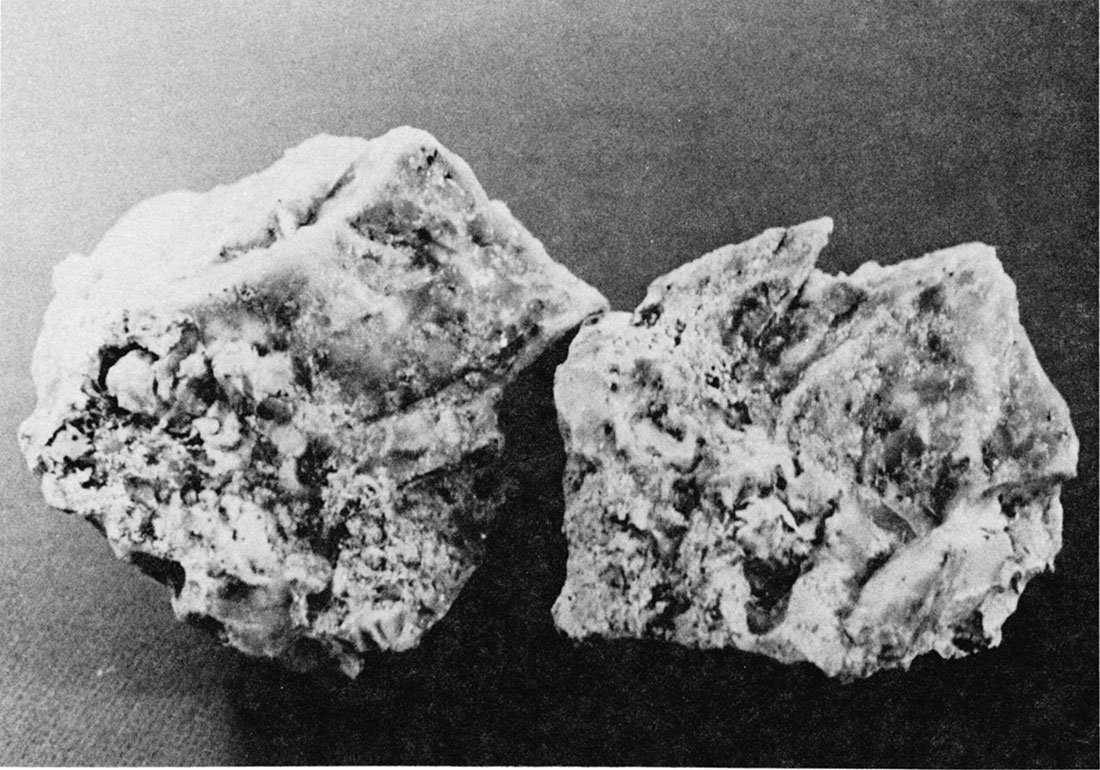
Plate 3 shows an areal display of uranium concentration levels found in irrigation waters from western Kansas. Groundwaters from the unconsolidated aquifers in this area are predominantly of a bicarbonate type. However, sulfate becomes an increasingly important component along many of the drainage ways in the study area and in the Scott-Finney depression. Chloride-type waters are encountered west of the Crooked Creek-Fowler fault system in Meade County and in the eastern half of the Great Bend Prairie south of the Arkansas River (Hathaway and others, 1975, 1976, 1977, 1978, 1979). Waters from wells located in areas overlying the Ogallala Formation (Pl. 1) exhibited a uranium concentration range of 2 to 172 ppb, with a mean of 9.5 ppb. Earlier data of Scott and Barker (1962) generally agree with regional uranium levels found in this study. Cowart's more recent data (personal communication, 1978) for waters from wells sampled in the 1974 and 1975 Kansas Geological Survey studies also generally agree with data from the present study (Table 6). Differences between the Kansas Geological Survey data and Cowart's data may be due to the time interval between sample collections and to differences in the amount of pumpage that had occurred during the irrigation season in which the samples were collected. The uniformly low 234U/238U activity ratios (values near 1.0) reported by Cowart, together with the relatively high uranium levels in groundwater, suggest an absence of significant reducing depositional environments for uranium since the deposition of the Ogallala Formation in this portion of western Kansas. Thus we suggest that commercial ore-grade uranium deposits are not likely to be found in the Ogallala Formation. Groundwaters in southeastern Kansas, by contrast, showed disequilibrium 234U/238U activity ratios, low uranium levels, and the presence of sulfide, indicating that the potential for uranium deposits is much better there (Hathaway and Macfarlane, 1980). One exception may be the uraniferous silicified Ogallala that occurs south of the Arkansas River. It is possible that the anomalous 234U/238U activity ratio of 1.75 (Table 6, location: NW NW SE Sec. 3, T. 26 S., R. 33 W. in Finney County) is related to uranium being precipitated from solution and incorporated in the silicified material. However, more data need to be gathered before any positive statements can be made. The origin of the regional uranium anomaly in groundwaters from areas overlying the Ogallala Formation may be the leaching and dissolution of volcanic ash that is found within the Ogallala Formation (Swineford and others, 1955) and that was shown to contain about 8 ppm uranium (Table 5).
Table 6—Comparison of uranium data from western Kansas.
| County | Location | KGS Data (ppb) |
Cowart DataC (ppb) |
Activity Ratio 234U/238U |
|---|---|---|---|---|
| Scott | SW SE SE Sec. 12, T. 19 S., R. 33 W. | 172b | 142 | 1.30 |
| Scott | SW NW SW Sec. 14, T. 20 S., R. 31 W. | 31a | 27 | 1.27 |
| Scott | NE NW SW Sec. 7, T. 20 S., R. 32 W. | 79a | 20 | 1.24 |
| Finney | SW SW SE Sec. 10, T. 23 S., R. 33 W. | 16b | 20 | 1.29 |
| Finney | SW SE SW Sec. 28, T. 23 S., R. 33 W. | 25b | 30 | 1.31 |
| Finney | NE NE sec. 5, T. 24 S., R. 34 W. | 33b | 15 | 1.20 |
| Finney | NW NW SE Sec. 3, T. 26 S., R. 33 W. | 2b | 2 (4)* | 1.75 |
| Wichita | NE NW SE Sec. 31, T. 16 S., R. 35 W. | 14a | 14 | 1.34 |
| Wichita | SE NW SW Sec. 17, T. 20 S., R. 38 W. | 15a | 15 | 1.32 |
| aCollected July 1974 bCollected July 1975 cCollected June-July 1977 *may be high by factor of 2 due to spiking error |
||||
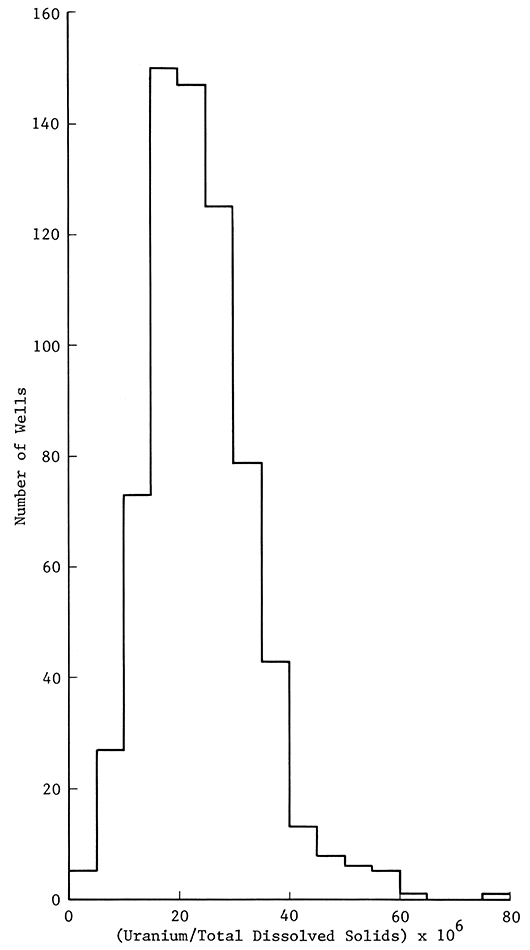
Figure 9 is a histogram of uranium concentrations versus frequency for all groundwater data from the study area. Figure 10 reflects the distribution of uranium values for groundwater from only those wells with an Ogallala component. This interpretation is subject to the uncertainties involved in the identification of the Ogallala Formation from drillers' logs and well cuttings. Hathaway (1977) observed that groundwaters from west-central Kansas exhibited significant correlations between their uranium levels and the total dissolved solids content as well as the concentration levels of major chemical constituents. Figures 11 and 12 are histograms of uranium to total dissolved solids ratios versus frequency for all groundwaters from the study area and for groundwaters from only those wells with an Ogallala component, respectively. A high proportion of wells with uranium to total dissolved solids ratios in excess of 30 x 10-6 is found in the west-central area of Lane, Scott, Wichita, Greeley, and southern Wallace counties. Comparisons between Figures 9 and 10 and between Figures 11 and 12 suggest that more than a single uranium groundwater population is responsible for the distribution of uranium concentration values shown in Plate 3.
Figure 9—Histogram showing the distribution of the uranium concentrations in ppb versus the frequency of occurrence for the total number of wells sampled.
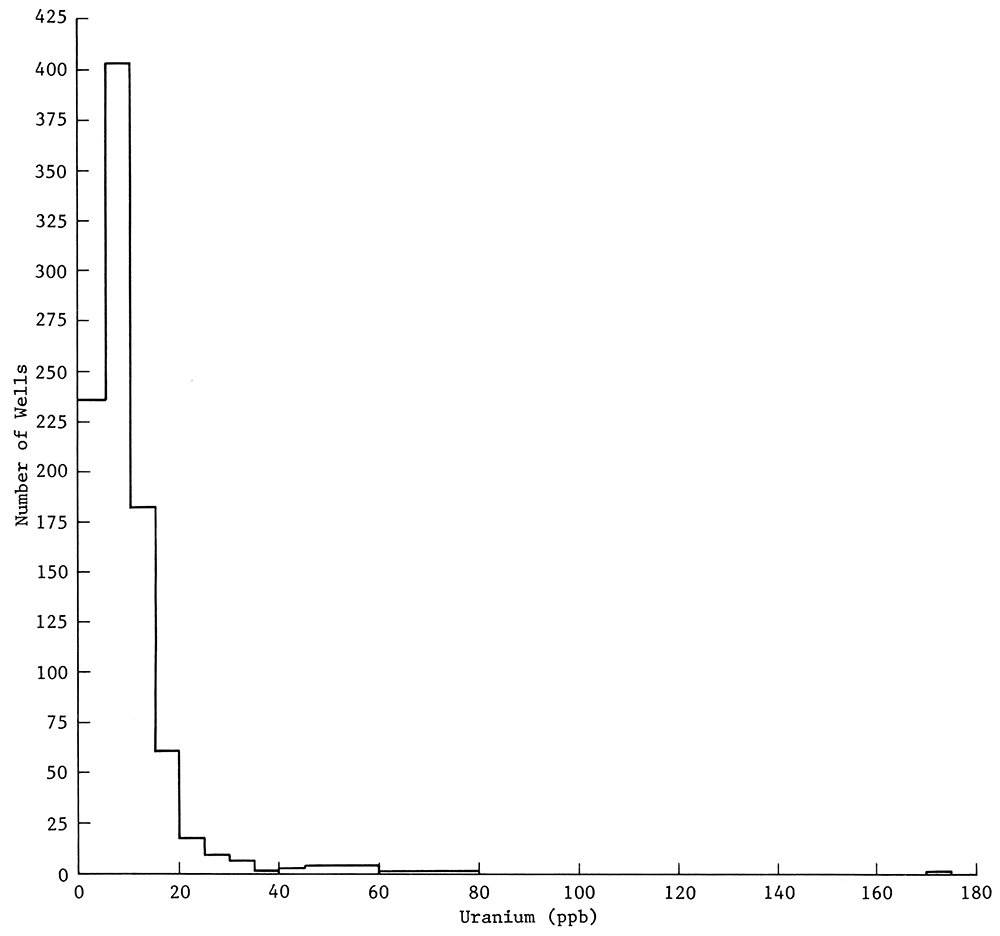
Figure 10—Histogram showing the distribution of the uranium concentrations in ppb versus the frequency of occurrence for those wells that derive some or all of their water from the Ogallala Formation.
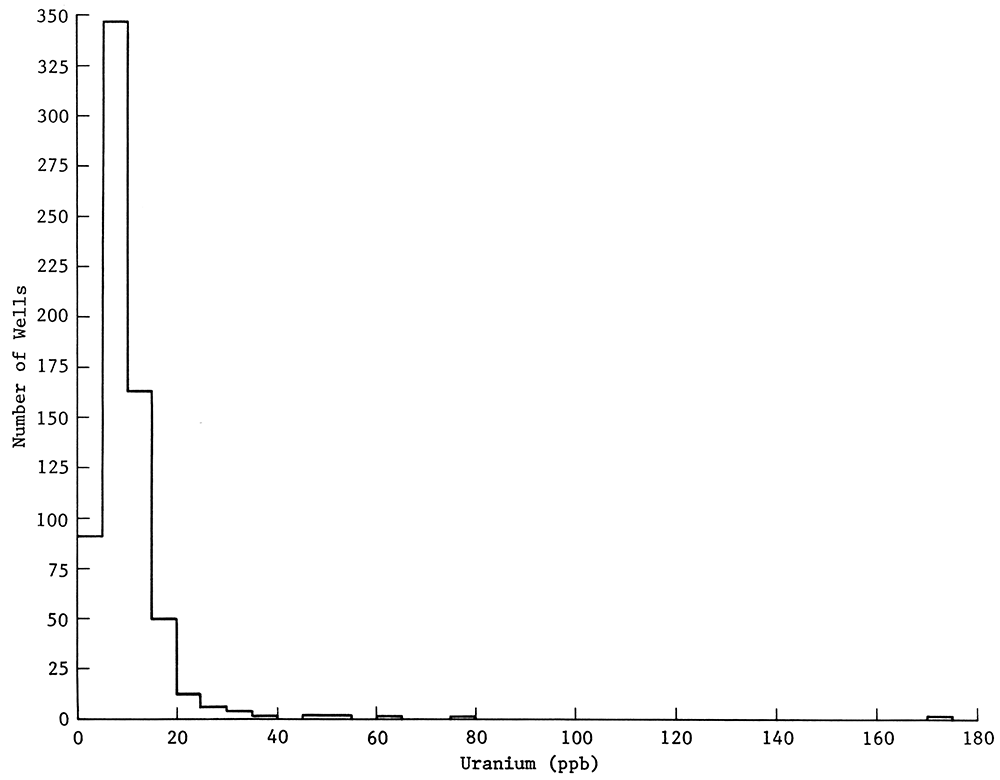
Figure 11—Histogram showing the relationship between the uranium to dissolved solids ratio and the frequency of occurrence for the total number of wells sampled.
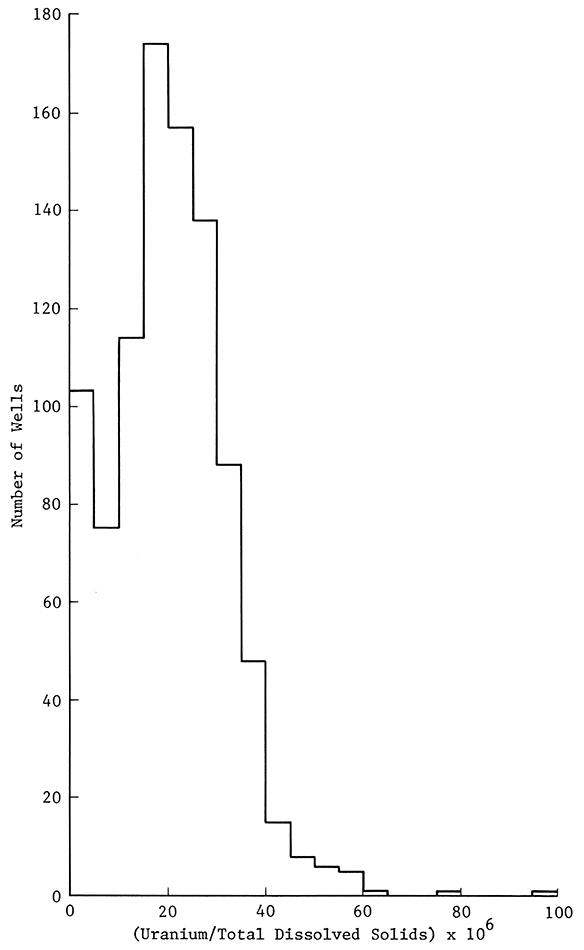
Figure 12—Histogram showing the relationship between the uranium to dissolved solids ratio and the frequency of occurrence for those wells that derive all or part of their water from the Ogallala Formation.
Other features shown on plate 3 are worthy of note. The Arkansas River and the Smoky Hill River constitute two major drainage features in the study area, but the alluvial sediments from their valleys yield waters with greatly differing uranium contents. Waters from the Arkansas River Valley exhibit uranium levels in excess of 20 ppb from the Colorado-Kansas border eastward to about the FinneyGray county line, and about 5 to 15 ppb in much of the valley system east of this point. In Gray County, fresher groundwaters from south of the Arkansas River appear to recharge the river system and thereby reduce the salinity of waters from the river valley (Hathaway and others, 1976). The uranium content of water samples collected in 1976 from the Arkansas River at Syracuse, Kansas, varied from 27 ppb in March to 4 ppb in June. In contrast, groundwaters from alluvium of the Smoky Hill river valley have lower uranium contents, about 10 ppb in the western half of the study area and less than 4 ppb for much of the eastern half of the study area. The differences between the two river systems probably reflect differences in the nature of materials derived from surface drainage as a result of different geology and the extent to which each system is able to receive recharge directly from the Ogallala Formation. Also, part of the dissolved uranium in the Arkansas River and related alluvial deposits is derived from sources rich in uranium, which are located in the headwaters of the river in the Rocky Mountains of Colorado.
Much of the Great Bend Prairie south of the Arkansas River in south-central Kansas is characterized by groundwaters with uranium levels of 2 ppb or less (Pl. 3). Several factors may contribute to these low uranium concentrations. First, the Ogallala Formation is no longer present in this area. The water-bearing unconsolidated sediments in this area are undifferentiated Quaternary-Tertiary age deposits. This area received extensive alluviation during each of the glacial ages of the Pleistocene, and reworking of these materials occurred in late Pleistocene time with the northeastward migration of the ancestral Arkansas River (Fent, 1950; Frye and Leonard, 1952). Second, water quality deteriorates with depth in the eastern half of the Great Bend Prairie in the area south of the Arkansas River (Stullken and Fader, 1976) where salt-bearing units of Permian age serve as the bedrock. Thus, irrigation waters in this region are derived from only the uppermost portion of the aquifer and do not reflect integrated values for uranium concentrations within the entire water column of the aquifer.
The 20 to 172 ppb uranium concentration levels in the region of the Scott-Finney depression and the zone of less than 4 ppb uranium concentration levels that trends southeastward from a general area south of the Scott-Finney depression and the Arkansas River may have their origins in the same set of geologic events. During the Nebraskan time of the early Pleistocene, a major north-south drainage system extended southward through the present-day location of the ScottFinney depression and spread laterally into an area south of the present location of the Arkansas River, to alluviate an extensive basin lying west of the Crooked Creek-Fowler fault system (Fent, 1950; Frye and Leonard, 1952). The lack of surface and groundwater flow in recent time southward to the Arkansas River along the present surface expression of the north-south-trending Nebraskan drainage system has created an environment in southern Scott County and in the Scott-Finney depression that is conducive to the accumulation of soluble salts from surface weathering into the soils and groundwater of these areas (Hathaway and others, 1975, 1976). The highest uranium concentration of the present study is located in the Scott Basin area of southern Scott County, near the point where White Woman Creek enters the basin.
The low uranium concentration zone that trends southeastward south of the Scott-Finney depression and the Arkansas River may well be related to Early Pleistocene drainage patterns (Fent, 1950). This suggests that reworking of the older Ogallala Formation deposits and introduction of new material may have served to remove and dilute the uranium "source materials."
The Tertiary Ogallala Formation and Quaternary alluvial deposits are unconsolidated aquifers of major importance in the western half of Kansas. The general uranium mineralization potential of the rocks associated with these aquifer systems appears to be limited.
Anomalous uranium concentrations in water are identified in several areas, including the ScottFinney depression and the Arkansas River valley. Secondary silicified rocks of the Ogallala Formation in Clark and Meade counties also show uranium enrichment. Abundant uranium source materials in the form of volcanic ash occur within the area and mobilization of uranium from these sources is evident. However, the presence of reducing environments or other mechanisms for the concentration of uranium within these units cannot be demonstrated at present.
Additional studies are needed before more definitive statements of the uranium potential of adjoining older geological units (or the contact between the younger and older units) can be made.
We thank the following persons and organizations for providing us with analyses for some of the samples: C. Bunker and C. Bush, U.S. Geological Survey; J. B. Cowart, Florida State University; J. R. Dooley, U.S. Geological Survey; G. W. James, Kansas Geological Survey; U.S. Bureau of Mines; Bendix Field Engineering Corporation.
Bayne, C. K., 1976, Guidebook; 24th annual meeting, Midwestern Friends of the Pleistocene: Kansas Geological Survey Guidebook Series 1, p. 1-85.
Berendsen, P., 1977, Anomalous uranium concentrations related to paleo-drainage system in the Pliocene Ogallala Formation in southwestern Kansas [abs.]: Geological Society of America, Rocky Mountain Section Meeting, v. 9, no. 6, Missoula, Montana, 1977, proceedings, p. 708.
Berendsen, P., Wilson, F. W., Yarger, H. L., and Steeples, D. W., 1980, New data on major basement fractures in the tectonic development of eastern Kansas: International Basement Tectonics Symposium, 3rd, Durango, Colorado, 1978, Proceedings, in preparation.
Carey, S. J., Frye, J. C., Plummer, N., and Swineford, A., 1952, Kansas volcanic ash resources: Kansas Geological Survey Bulletin 96, pt. 1, 68 p. [available online]
Cole, V. B., 1976, Configuration of the top of Precambrian rocks in Kansas: Kansas Geological Survey Map M-7, scale 1:500,000. [available online]
Cowart, J. B., 1974, Uranium 234 and uranium 238 in the Carizzo Sandstone aquifer of south Texas: Ph.D. dissertation, Florida State University, 80 p.
Darton, N. H., 1899, Hydrology; in, Preliminary report on the geology and water resources of Nebraska west of the one hundred and third meridian: U.S. Geological Survey 19th Annual Report, pt. 4, p. 719-785. [available online]
Dooley, J. R., Conwell, C. N., Berendsen, P., Otton, J. K., Pierson, C. T., Hoisington, W. D., Lindsey, D. A., and Rosholt, J. N., 1977, Examples of uranium distribution graphics in geologic rock specimens illustrated with the radioluxograph, induced fission tracks, and other track methods; in, Short papers of the U. S. Geological Survey uranium-thorium symposium, 1977: U.S. Geological Survey, Circular 753, p. 32. [available online]
Elias, M. K., 1932, Grasses and other plants from the Tertiary rocks of Kansas and Colorado: Kansas University Science Bulletin, v. 20, pt. 2, no. 2, p. 333- 367.
Elias, M. K., 1942, Tertiary prairie grasses and other herbs from the High Plains: Geological Society of America Special Paper 41, 176 p.
Fent, O. S., 1950, Pleistocene drainage history of central Kansas: Transactions of the Kansas Academy of Science, v. 53, no. 1, p.81-90.
Fix, P. F., 1956, Geochemical prospecting for uranium by sampling ground and surface waters: International Conference on the Peaceful Uses of Atomic Energy, 1955, Proceedings: Geology of Uranium and Thorium, United Nations Publications, Sales no. 1956, IX 1, v , 6, p. 788-791.
Franks, P. C., and Swineford, A., 1959, Character and genesis of massive opal in Kimball Member, Ogallala Formation, Scott County, Kansas: Journal of Sedimentary Petrology, v. 29, no. 2, p , 186- 196.
Frye, J. C., Hess, R. H., and Holmes, E. O., Jr., 1942, Geology and ground-water resources of Meade County, Kansas: Kansas Geological Survey Bulletin 45, 152 p. [available online]
Frye, J. C., and Leonard, A. B., 1952, Pleistocene geology of Kansas: Kansas Geological Survey Bulletin 99, 230 p. [available online]
Frye, J. C., Leonard A. B., and Swineford, A., 1956, Stratigraphy of the Ogallala Formation (Neogene) of northern Kansas: Kansas Geological Survey Bulletin 118, 92 p. [available online]
Frye, J. C., and Swineford, A., 1946, Silicified rocks in the Ogallala Formation [Kansas]: Kansas Geological Survey Bulletin 64, pt. 2, p. 37-76. [available online]
Gutentag, E. D., and Stullken, L. E., 1974, Ground water in Haskell County, southwestern Kansas: U.S. Geological Survey Hydrologic Investigations Atlas HA-515. [available online]
Gutentag, E. D., and Weeks, J. B., 1980, Water table in the High Plains aquifer in 1978 in parts of Colorado, Kansas, Nebraska, New Mexico, Oklahoma, South Dakota, Texas, and Wyoming: U.S. Geological Survey Open-File Report, no. 80-50, 1 sheet. [available online]
Hathaway, L. R., 1977, Interpretation of uranium content of ground water in west-central Kansas; in, Short papers of the U. S. Geological Survey uranium-thorium symposium, 1977: U.S. Geological Survey, Circular 753, p. 65-66. [available online]
Hathaway, L. R., and James, G. W., 1977, Preconcentration of uranium in natural waters for x-ray fluorescence analysis: Advances in X-ray Analysis, v. 20, p. 453-458.
Hathaway, L. R., and James, G. W., 1975, Use of chelating ion-exchange resin in the determination of uranium in ground-water by X-ray fluorescence: Analytical Chemistry, v. 47, no. 12, p. 2035- 2037.
Hathaway, L. R., Carr, B. L., Flanagan, M. A., Galle, O. K., Waugh, T. C., Dickey, H. P., and Magnuson, L. M., 1977, Chemical quality of irrigation waters in southwestern Kansas: Kansas Geological Survey Chemical Quality Series 6, 35 p. [available online]
Hathaway, L. R., Carr, B. L., Galle, O. K., Magnuson, L. M., Waugh, T. C., and Dickey, H. P., 1976, Chemical quality of irrigation waters in Hamilton, Kearny, Finney, and northern Gray counties: Kansas Geological Survey Chemical Quality Series 4, 33 p. [available online]
Hathaway, L. R., Galle, O. K., Waugh, T. C., and Dickey, H. P., 1978, Chemical quality of irrigation waters in Ford County and the Great Bend Prairie of Kansas: Kansas Geological Survey Chemical Quality Series 7, 41 p. [available online]
Hathaway, L. R., and Macfarlane, P. A., 1980, Water quality in the Lower Paleozoic aquifers of the Tri-State area; in, D. D. Hemphill, ed., Trace substances in environmental health—XIV: University of Missouri, p. 148-154.
Hathaway, L. R., Magnuson, L. M., Carr, B. L., Galle, O. K., and Waugh, T. C., 1975, Chemical quality of irrigation waters in west-central Kansas: Kansas Geological Survey Chemical Quality Series 2, 46 p. [available online]
Hathaway, L. R., Waugh, T. C., Galle, O. K., and Dickey, H. P., 1979, Chemical quality of irrigation waters in northwestern Kansas: Kansas Geological Survey Chemical Quality Series 8, 45 p. [available online]
Haworth, E., 1897, Physiography of western Kansas: Kansas University Geological Survey Volume 2, p. 11-49. [available online]
Henry, C. D., and Tyner, G. N., 1978, Alteration and uranium release from rhyolitic igneous rocks: Examples from the Mitchell Mesa Rhyolite, Santana Tuff, Chinati Mountains Groups and Allen Complex, Trans-Pecos, Texas; in, Henry, C. D., and Walton, A. W., 1979, Formation of uranium ores by diagenesis of volcanic sediments: U.S. Department of Energy Report GYBX-23, p. VII-1–VII-1 09.
James, G. W., 1977a, Parts-per-million determinations of uranium and thorium in geologic samples by X-ray spectrometry: Analytical Chemistry, v , 49, no. 7, p. 967- 969.
James, G. W., 1977b, Uranium and thorium in volcanic ash deposits of Kansas: Implications for uranium exploration in the central Great Plains: Kansas Geological Survey Bulletin 211, pt. 4, p. 1- 3. [available online]
Jones, J. B., and Segnit, E. R., 1971, The nature of opal. I. Nomenclature and constituent phases: Journal of the Geological Society of Australia, v. 18, no. 1, p. 57-68.
Kume, J., and Spinazola, J. M., Geohydrology of sandstone aquifers of southwest Kansas: U.S. Geological Survey, in preparation.
Landis, E. R., 1960, Uranium content of ground and surface waters in a part of the central Great Plains: U. S. Geological Survey Bulletin 1087-G, p. 223-258. [available online]
Lobmeyer, D. H., and Sauer, C. G., 1974, Water resources of Hamilton County, southwestern Kansas: U.S. Geological Survey Hydrologic Investigations Atlas HA-516. [available online]
Merriam, D. F., 1963, The geologic history of Kansas: Kansas Geological Survey Bulletin 162, 317 p. [available online]
Pierce, A. P., Mytton, J. W., and Gott, G. B., 1956, Radioactive elements and their daughter products in the Texas Panhandle and other oil and gas fields in the U.S.: International Conference on the Peaceful Uses of Atomic Energy, 1955, Proceedings: Geology of Uranium and Thorium, United Nations Publications, Sales no. 1956, IX 1, v. 6, p. 494-498.
Schoewe, W. H., 1949, The geography of Kansas, Part II: Transactions of the Kansas Academy of Science, v , 52, no. 3, p , 261-333.
Scott, R. C., and Barker, F. B., 1962, Data on uranium and radium in ground water in the United States, 1954 to 1957: U.S. Geological Survey Professional Paper 426, 115 p , [available online]
Smith, H. T. U., 1940, Geological studies in southwestern Kansas: Kansas Geological Survey Bulletin 34, 212 p. [available online]
Stullken, L. E., and Fader, S. W., 1976, Hydrogeologic data from the Great Bend Prairie, south-central Kansas: Kansas Geological Survey Basic Data Series Ground Water Release 5, 50 p.
Swineford, A., Frye, J. C., and Leonard, A. B., 1955, Petrography of the Late Tertiary volcanic ash falls in the central Great Plains [Kansas-Nebraska]: Journal of Sedimentary Petrology, v. 25, no. 4, p. 243-261.
Swineford, A., and Frye, J. C., 1946, Petrographic comparison of pliocene and Pleistocene volcanic ash from western Kansas: Kansas Geological Survey Bulletin 64, pt. 1, p , 1-32. [available online]
Union Carbide, 1979, Hydrogeochemical and stream sediment reconnaissance basic data for Pratt NTMS quadrangle, Kansas: National Uranium Resource Evaluation Program Report GJBX-83, 36 p.
Waite, H. A., 1947, Geology and ground-water resources of Scott County, Kansas: Kansas Geological Survey Bulletin 66, 216 p. [available online]
Willoughby, K. L., and Berendsen, P., 1978, Structure and stratigraphy of Mississippian and older rocks along the Nemaha Ridge in east-central Kansas [abs s l : Geological Society of America Abstracts with Programs, v , 10, no. 1, p. 27.
Kansas Geological Survey
Placed on web Oct. 11, 2018; originally published 1981.
Comments to webadmin@kgs.ku.edu
The URL for this page is http://www.kgs.ku.edu/Publications/Bulletins/MRS9/index.html