![]()
Prev Page--The Dipmeter || Next Page--The Epilog
From the Dipmeter to Formation Image
Resistivity image logging extended the technology of the dipmeter by making microresistivity measurements from multiple buttons on each pad rather than a single button.
Although the records of microresistivity would be conventionally be presented as curves, the image presentation is made by displaying values on a gray-level scale and interpolating between buttons.
- white is assigned to high resistivity (low conductivity)
- black is assigned to low resistivity (high conductivity)
- shades of gray represent intermediate resistivity/conductivity between these extremes
As a result, the most basic stratigraphy is immediately apparent from the image where:
- shales appear as dark gray to black
- sandstones and carbonates as light gray to white
The gray-scale is usually modified to incorporate a false color addition of yellow-orange-brown, so that image distinctions are more obvious to the human eye and tends to mimic the rock as it would appear visually.
However, it must always be remembered that the image is a resistivity map of the formation which is NOT the same as would be seen on a core photograph.
Next, we will see how a section of Oread Limestone appears on an image log.
FMI Microresistivity Curves in the Oread Limestone
A formation microimaging (FMI) log was run in a well in the El Dorado field, Butler County, Kansas and the measurement curves for the Oread Limestone section are shown below.
- Track 1: Caliper and gamma-ray. The gamma-ray curve shows the shale-limestone stratigraphy of the Oread.
- Track 2: The borehole deviation from the vertical and the azimuth of Pad One
- Track 3: The microresistivity curves recorded by the buttons.
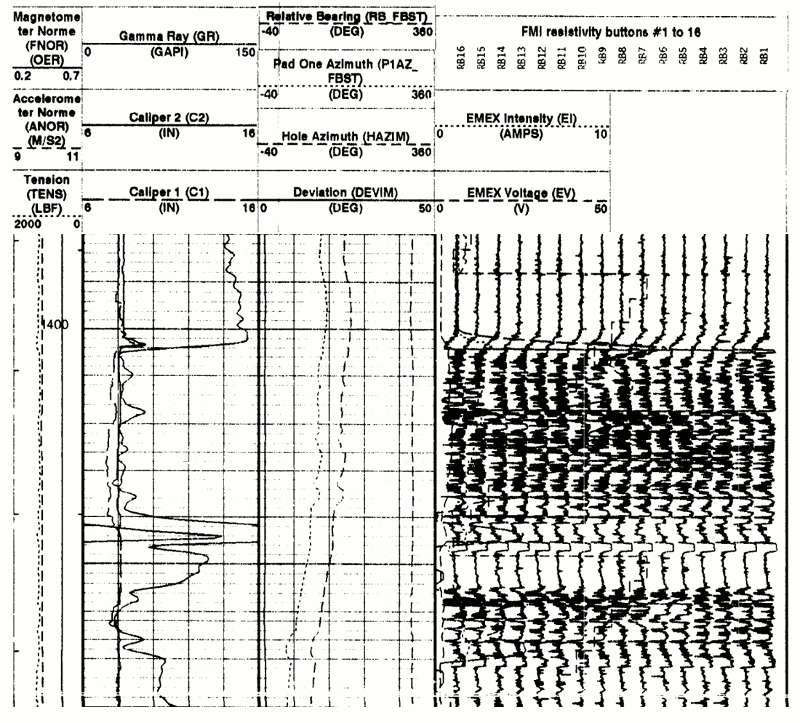
Next, we will see the transformation of the multiple microresistivity curves into a gray-level image.
Resistivity Image of the Oread Limestone
Now that the microresistivity measurements are plotted as a gray-level image, the lithological implications are easy to relate to Oread outcrops in Lawrence, Kansas.
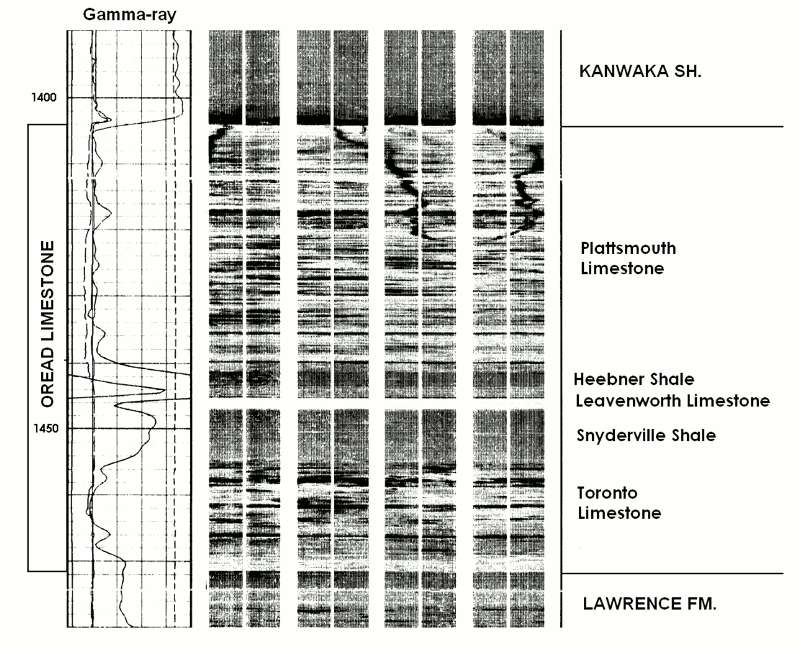
In reviewing an image log, you should also refer to the other logs for a more complete geological interpretation. In this case, we have the gamma-ray and caliper curves in Track 1.
- KANWAKA SHALE: Fairly homogeneous, low resistivity shale with darker, more conductive zone at the base that may be caused by the washout shown by the caliper.
- PLATTSMOUTH LIMESTONE: Rubbly bedding structure of this regressive limestone, with more conductive shalier interbeds shown by darker gray and matching increase in gamma-ray curve. Prominent features are the dark, crosscutting, jagged lines, which are fractures induced by drilling.
- HEEBNER SHALE: Upper gray-shale with relatively lower radioactivity and darker gray image from lower resistivity contrasted with Lower highly-radioactive black shale with lighter gray image resulting from higher resistivity caused by organic content.
- LEAVENWORTH LIMESTONE: Thin, clean transgressive limestone with white image caused by high resistivity.
- SNYDERVILLE SHALE:Silty (note reduced gamma-ray) regressive shale.
- TORONTO LIMESTONE: Limestone with irregular shale partings.
- LAWRENCE SHALE: Silty shale with laminar interbeds of silty zones (lighter gray) and shalier zones (darker gray).
This example is a fairly old image log and there are ongoing improvements in borehole imaging technology as shown by a more recent image log of the Plattsmouth Limestone next.
Plattsmouth Limestone Resistivity Image Logs from Two Neighboring Wells
These images show part of the Plattsmouth Limestone from two wells in Sumner County, Kansas that are less than two miles apart.
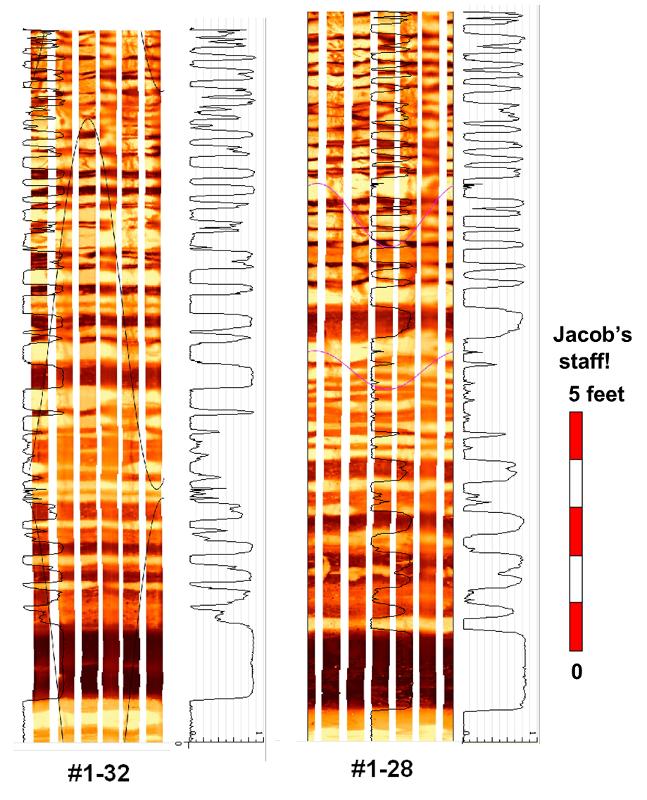
Although paper copies of image logs are routinely distributed to the well contractor, image files are also supplied in graphic formats such as TIFF.
Graphic files can be processed by imaging software.
In this example, the bedding structure image has been subdivided by (free!) image software.
The result can be used to identify correlateable bed units or, because the processed bedding profile is a digital record, can be analysed for cyclicity structure by using Fourier analysis or other signal tools.
In the next example, we see how an image log of a Morrow Sandstone section compares with a core taken from the same interval.
A Morrow Sandstone Resistivity Image and Core Comparison
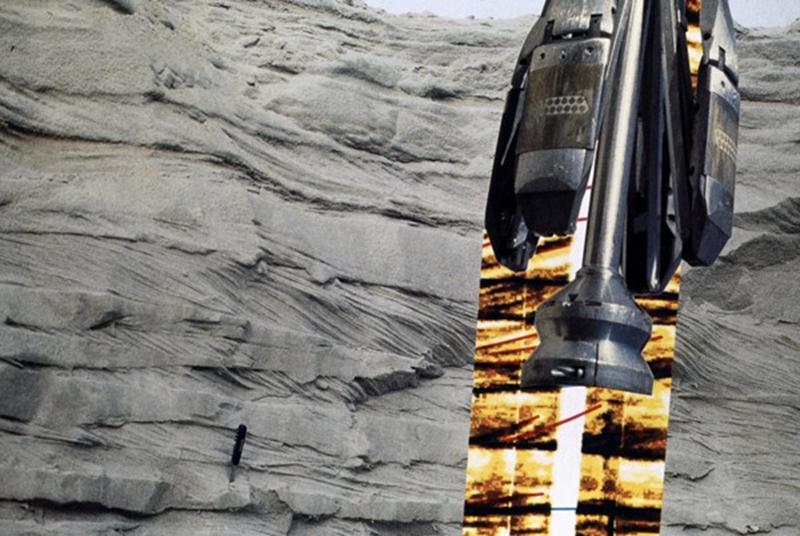
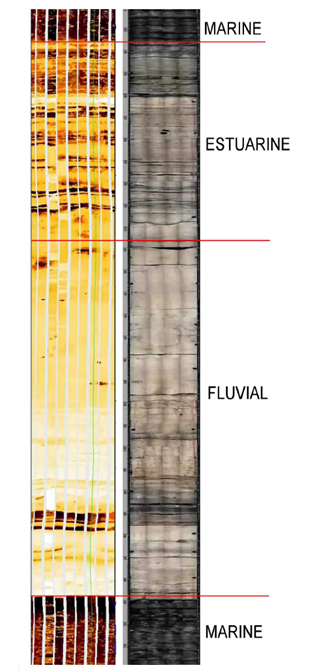
This example shows a comparison between a resistivity image log (left) and a core (right) of an Upper Morrow Sandstone channel from the Mustang East field in Morton County, Kansas, as described by DeVries(2006).
The complete poster of image log analysis by DeVries is available as a downloadable pdf file from:
http://www.searchanddiscovery.com/documents/2006/06032devries/images/devries.pdf
Adam DeVries made this study as part of his Master's thesis at Oklahoma State University, so image log studies are not confined to industry but are an academic option.
Resistivity image logs of clastic successions generally have an immediacy for visual interpretation by a geologist who has no background in traditional log analysis.
However two points should be borne in mind:
- This is an electrical image not an optical image, so that there will be strong similarities, but also some differences.
- The image is the rendition of a cylindrical borehole wall flattened into a plane, so that dipping planar features will sketch out sinusoids.
Next, we will make a more detailed examination of a Morrow Sandstone image log.
A Morrow Sandstone Resistivity Image Interpretation
The image log section corresponds to the interval marked as 'IMAGE' on the gamma-ray log.
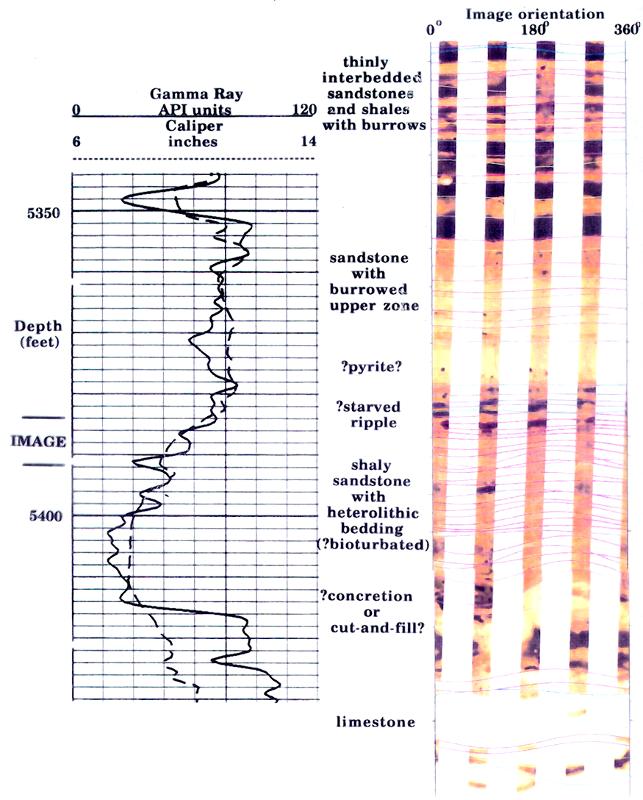
The image orientation is marked at the top of the image log, with south in the center (180 degrees) and north to the right and left ( zero and 360 degrees).
The vertical white bands on the image correspond to the gaps between the pads and show a drift in orientation as the tool rotated when it was drawn upwards through the borehole.
The sinusoidal taces on the image are planes computed from dipmeter processing of the image microresistivity curves. Each sinusoid peak azimuth is the updip direction; the sinusoid trough azimuth is the downdip direction.
The thin limestone at the base (see gamma-ray log) is the white band at the bottom of the image log.
Many of the heterolithic features within the sandstones and shales are probably caused by bioturbation, while some distinctive burrows can be seen in the thinly interbedded sandstones and shales at the top of the image section.
Some black blobs in the middle sandstone may be pyrite. As a metallic mineral, pyrite is highly conductive and so will show strong image contrast, provided that the crystals are large enough to be registered by the microresistivity buttons.
Image logs of shales will often contain interesting geological features, as shown by the Hushpuckney Shale example next.
Image Log of a Black Shale: The Pennsylvanian Hushpuckney
On the left is a resistivity image log of a Hushpuckney Shale section in a well drilled in Barber County, Kansas.
On the right is an X-radiograph of a Hushpuckney Shale core from Leavenworth County, Kansas together with its interpretation by Algeo and Maynard (2004).
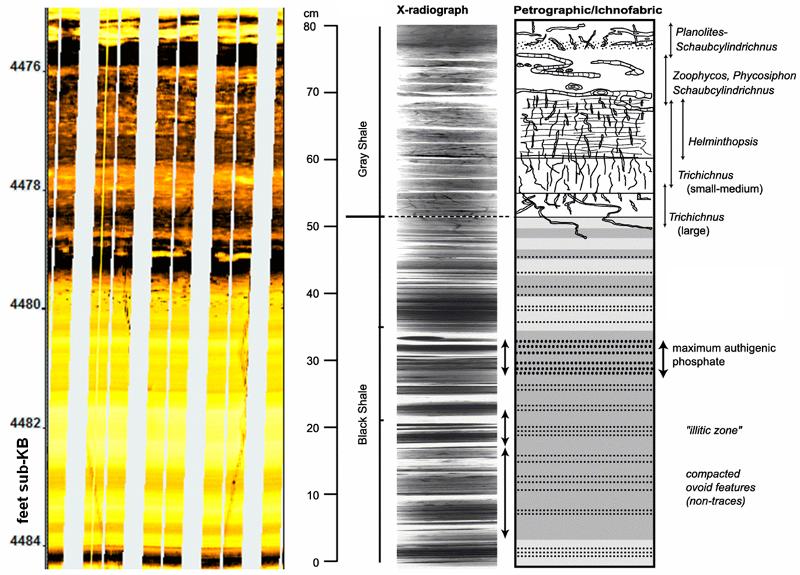
The Barber County Hushpuckney is from the extreme south of Kansas, where it is considerably thicker than the core from north-east Kansas.
However, it is easy to use the core interpretation as a basic guide to features seen on the image log.
In the lower, black shale phase, brighter yellow corresponds to higher resistivity, and picks out more carbonaceous-rich laminations that reflect varying anoxia in depositional environment.
In the upper, gray shale phase, the resistivity is lower, creating darker colors and burrowing features can be seen that disrupt the laminations.
Resistivity images of carbonates typically have less immediacy for a geologist trained in carbonate outcrop observation, but show distinctive geological features to a practised eye as shown by an Arbuckle Limestone section.
A Cambro-Ordovician Arbuckle Limestone Resistivity Image Example
This resistivity image is of an Arbuckle Limestone section from an injection well drilled in Finney County, Kansas.
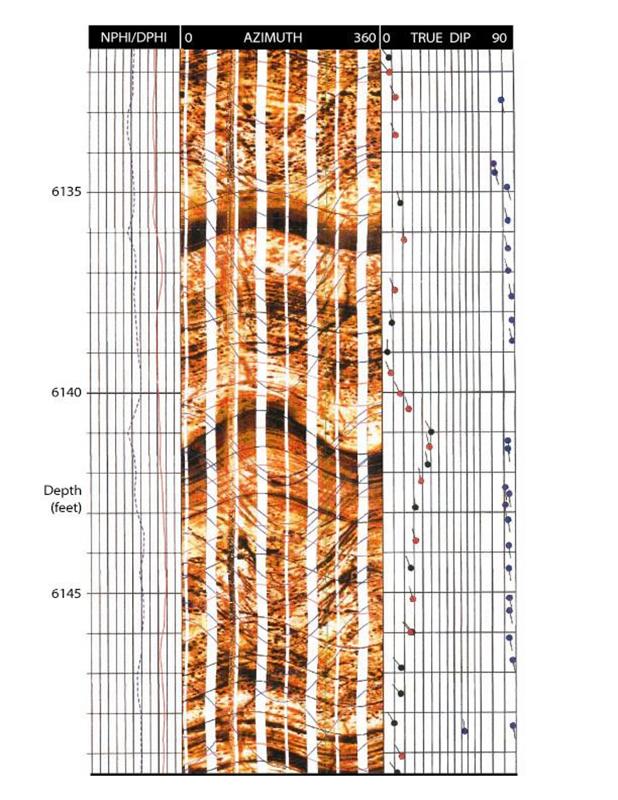
The overlay of the density and neutron porosity logs in Track 1 show the lithology to be a dolomite.
The wellbore was drilled directionally at an angle of 30 degrees from the vertical towards the WNW.
The orientation of the borehole accounts for the strong sinusoidal pattern to the banding of lower resistivity, darker intervals and higher resistivity, lighter intervals, which have low dips as related to true horizontal.
The broad bands discriminating bedding and their true dip is shown by the processed tadpoles on the left of Track 3 as a few degrees to the NNW.
The banding highlights the cyclic character of peritidal platform deposits, with darker colors discriminating shalier and more conductive beds.
The blue pattern of tadpoles in the center pick up a distinctive feature which could, conceivably, be a stromatolite.
Notice the mottling of darker, isolated blobs which reflects "vugs", large pores that would be visible in core. The low resistivity of the vugs is caused by their conductive mud-filtrate content.
The sinusoidal traces that are discordant to the depositional banding are fractures discriminated by dipmeter processing.
The fracture tadpoles are shown on the right of Track 3 and are close to vertical in orientation. Notice that some fracture tadpoles point roughly south and others point north, which demonstrates that the difference of a degree or two from the vertical can change dip orientation by 180 degrees. More important is that the fracture strike is about WSW-ENE.
Image logging is more expensive than conventional logs, so let's review the reasons why resistivity imaging would be recommended as part of a logging program.
Reasons for Running a Resistivity Image Log
When image logs were introduced in the 1980's, the low price of oil discouraged the widespread use of this technology by industry. However, during this period image logs were run extensively on legs of the Ocean Drilling Program. Image logs were eagerly accepted by shipboard scientists, many of whom had been indifferent to conventional logs. Apart from the visual immediacy of the image logs, they had two major advantages:
- For sections with incomplete, and often poor, core recovery, the continuous image log filled the missing gaps.
- The orientation data extracted from images enhanced sedimentological facies and transport direction analysis from core
Resistivity image logging has become progressively more common in industry applications, while tool technology continues to improve image quality and software image analysis becomes increasingly sophisticated.
- Thin beds: In sequences where production comes from thin beds whose discrimination is below the vertical resolution of conventional resistivity tools, such as offshore turbidite sand plays.
- Natural fractures: The location and orientation of natural fractures is an important aspect of mudstone resource plays. Drilling-induced fractures are generally more common, but natural fractures are important to production, particularly because they may be more extensive than fractures induced by fracking. Directional drilling will then be oriented orthogonally to natural fractures to maximize productivity.
Prev Page--The Dipmeter || Next Page--The Epilog
Kansas Geological Survey
Placed on web March 24, 2017.
Comments to webadmin@kgs.ku.edu
The URL for this page is http://www.kgs.ku.edu/Publications/Bulletins/LA/14_image.html