![]()
Prev Page--Geohydrology || Next Page--Development
Unconsolidated Aquifer System
The unconsolidated aquifer in Lane and Scott Counties is considered to be a single ground-water reservoir in which ground water is stored until it is discharged either naturally or by wells. All storage in the reservoir originated as precipitation either on the area or on contiguous areas upgradient on the water table. Inflow to the reservoir equals outflow plus or minus any change in storage in the reservoir. The major components of this general equation are discussed in the following sections.
Inflow to the Ground-Water Reservoir
Precipitation
Precipitation on the land surface within the area contributes inflow to the ground-water reservoir, principally during the growing season, in differing amounts dependent on duration and intensity of the rainfall, vegetation, and soil conditions. In irrigated areas, soil moisture for crop use commonly is maintained by irrigation. Therefore, precipitation that is in excess of the amount required to overcome soil-moisture deficiencies can percolate to the water table. In nonirrigated areas, precipitation supplies all of the soil moisture utilized by vegetation, and excess moisture for percolation to the water table is available only during periods of abnormally high rainfall. For this report, estimates of inflow from precipitation are based on the assumption that 10 percent of the precipitation on irrigated land during the growing season and 1 percent of the precipitation on nonirrigated land during the growing season percolates to the ground-water reservoir of Lane and Scott Counties. The inflow from precipitation during 1971 (a dry year) is estimated to have been 14,000 acre-feet (17 hm3) in Scott County and 3,000 acre-feet (4 hm3) in Lane County. During 1972 (a wet year), the inflow from precipitation is estimated to have been 24,000 acre-feet (30 hm3) in Scott County and 6,000 acre-feet (7 hm3) in Lane County.
Seepage of Irrigation Water
Some of the water withdrawn from the ground-water reservoir and applied for irrigation is "lost" to deep percolation (percolation below the root zone). Using figures experimentally derived by Meyer and others (1953) for irrigated land in Finney County, about 20 percent of the irrigation water applied to irrigated land in Lane and Scott Counties is assumed to be returned to the ground-water reservoir. Using pumpage figures developed in the section on annual withdrawals, seepage from irrigation water applied in 1971 was about 30,000 acre-feet (37 hm3) in Scott County and 6,000 acre-feet (7 hm3) in Lane County. Seepage from irrigation water in 1972 was about 19,000 acre-feet (23 hm3) in Scott County and 5,000 acre-feet (6 hm3) in Lane County. The lesser amount in 1972 is attributed to lesser application of irrigation water in a wet year.
Subsurface Inflow
Ground-water movement into the area occurs primarily along the Scott-Wichita County line. Net movement along the Finney-Scott line was almost zero in January 1973. The flow is computed by summing flow through incremental sections of the saturated deposits along the total section. Flow through each section is determined by multiplying the average hydraulic conductivity by the hydraulic gradient and by the area in each section. If water-table contours are not parallel to the section, a further adjustment is made for nonperpendicular flow.
Gross values computed from those used for incremental sections along the Scott-Wichita County line are: a total saturated area of 5,834,400 square feet (542,000 m2), a weighted mean hydraulic gradient of 0.0029, and a weighted mean hydraulic conductivity value of 64 ft/day (19 m/day). Using these values, which are discussed later in this report, subsurface inflow to Lane and Scott Counties is estimated to be about 9,000 acre-ft/yr (11 hm3/yr).
Streamflow Losses
An infrequent source of recharge to the ground-water reservoir in the counties is the infiltration of water from ephemeral stream channels during periods of flow. Streamflow in Lane and Scott Counties is primarily a function of the frequency and amount of precipitation that runs off from summer storms. All streams entering the two counties and those in the interior area are ephemeral (normally dry). Drainage from western Scott County flows toward the "ScottFinney depression" in the central part of the county. All the streams dissipate in or near the depression except Ladder Creek.
Whitewoman Creek begins about 20 miles (32 km) west of the Colorado-Kansas State line and terminates in a closed basin (Whitewoman Basin) south of Scott City. A streamflow gage (Station No. 07138650) was established in 1966 on Whitewoman Creek in Wichita County, 20 miles (32 km) west of the Scott County line. The average annual discharge during 5 years of record at this site was 964 acre-feet (1.2 hm3). Slagle and Weakly (personal commun., 1974) speculate that, if the average annual flow recorded at the gaging station occurred in one rise, infiltration into the channel bed would reduce the flow to zero before reaching Scott County. Only extreme flows on rare occasions or small flows resulting from runoff of local storms would reach Scott County and debouch into Whitewoman Basin. Ground-water recharge in Scott County from infiltration of streamflow that originated outside the county is considered too small and indeterminate on an annual basis to be designated as part of the ground-water inventory. Infiltration of streamflow that originates within the county is considered to be included with the estimate of inflow from precipitation.
Outflow from the Ground-Water Reservoir
Withdrawals by Wells
By far the largest outflow from the ground-water reservoir in Lane and Scott Counties is the withdrawal of water for irrigation. Detailed information about the distribution of wells and the amount of water pumped is given later in this report. The annual pumpage ranged from 120,000 acre-feet (150 hm3) during a wet year in 1972 to 180,000 acre-feet (220 hm3) during a dry year in 1971.
Subsurface Outflow
Subsurface outflow is toward the south and east. An estimated 1,000 to 3,000 acre-feet (1.2 to 3.7 hm3) of ground water flows out of the main body of the unconsolidated aquifer each year by underflow into adjacent areas where saturated deposits are less than 10 feet (3 m) thick. Fractures and solution cavities similar to those described in the section on chalk aquifer also are presumed to conduct water from the main body of the unconsolidated aquifer.
Streamflow Gains
Streams are the natural drains of the ground-water reservoir. The streams that intersect the water table and discharge water from the reservoir are Ladder Creek, the North, Middle, and South Forks of Walnut Creek, Hackberry Creek, and numerous small tributaries of the Smoky Hill River that drain the northern part of the area.
Ladder Creek is an ephemeral stream partly incised into the Ogallala Formation where it enters Scott County. At a point 6 miles (10 km) north-north-west of Scott City, Ladder Creek turns northward. Twelve miles (19 km) north of Scott City, the stream cuts into the bedrock where it gains flow from many springs and seeps at the base of the Ogallala Formation. A dam across the stream utilizes the deep valley to capture flow from streams and springs to produce Lake Scott.
Discharge measurements made during the summer and winter of 1951-52 (Bradley and Johnson, 1957) document perennial flow in Ladder Creek at a point 22 miles (35 km) west of the Scott-Wichita County line. The 1951-52 measurements indicate a base inflow at the west Scott County line of 7 ft3/s (0.2 m3/s); whereas, the present base inflow is zero. The 1951-52 measurements also document a base flow of 13 ft3/s (0.4 m3/s) at the north Scott County line and at the stream gaging station (Station No. 06859500) 10 miles (16 km) further downstream. By assuming that the base flow at the north county line and at the gaging station are equal to any gains in discharge, and by using 1972 fall and winter records at the gaging station (Water resources data for Kansas, part 1. Surface water records, 1972), the base flow of Ladder Creek at the north Scott County line is determined to be about 3 ft3/s (0.08 m3/s). This represents an annual reduction in ground-water contribution of about 2,000 acre-feet (2.5 hm3) in Scott County alone, and a reduction of about 7,000 acre-feet (8.6 hm3) through the entire upstream drainage (Scott and Wichita Counties). This reduction in base flow (ground-water contribution) is attributed to the extensive pumpage of ground water for irrigation.
The annual base flow of Ladder Creek at the north boundary of Scott County in 1972 was about 2,000 acre-feet (2.5 hm3). None of the other streams have significant perennial flow, although they receive water from numerous springs and seeps at the base of the Ogallala Formation.
Evapotranspiration
Water may be discharged from the ground-water reservoir by evapotranspiration, which is the combined process of evaporation and of transpiration by plants. Considerable amounts of water can be lost by this process in areas where the water table is near me land surface. In Lane and Scott Counties, however, evapotranspiration directly from the ground-water reservoir is considered negligible because the water table is well below the root zone nearly everywhere in the area.
Inventory Summary
A ground-water budget for Scott County is given below. Data are inadequate to prepare a similar budget for Lane County.
| Ground-water Budget for Scott County | ||||
|---|---|---|---|---|
| Acre-feet per year1 | ||||
| 1971 (Dry year) |
1972 (Wet year) |
|||
| Inflow to the ground-water reservoir: | ||||
| Precipitation | ||||
| Irrigated land | 11,000 | 19,000 | ||
| Nonirrigated land | 3,000 | 5,000 | ||
| Subsurface Inflow2 | 9,000 | 9,000 | ||
| Total | 23,000 | 33,000 | ||
| Outflow from the ground-water reservoir: | ||||
| Net withdrawals by wells3 | 120,000 | 76,000 | ||
| Subsurface outflow2 | 2,000 | 2,000 | ||
| Streamflow gains2 | 2,000 | 2,000 | ||
| Total | 124,000 | 80,000 | ||
| Change in storage: | ||||
| Calculated from above figures | -101,000 | -47,000 | ||
| Average water-level change | -1.87 ft | -.54 ft | ||
| Changes in storage determined using average water-level change and a specific yield of 15 percent (for comparison purposes here only) | -106,000 | -31,000 | ||
| 1. Acre-feet per year times 1.233 × 10⁻³ equals cubic hectometers per year. 2. A constant value selected from previously given ranges. 3. Total pumpage less return by seepage from irrigation. |
||||
As shown by the water budget of Scott County, inflow to the ground-water reservoir in the county from precipitation and subsurface flow was 23,000 and 33,000 acre-feet (28 and 41 hm3) in 1971 and 1972 respectively. In addition to inflow from precipitation and subsurface flow, a part of the total water applied for irrigation returned to the reservoir by percolation. Because irrigation water is applied to the soil to supply adequate moisture for plant growth, more supplemental water is required during a dry growing season than is required during a wet growing season. As discussed in the section on Seepage of Irrigation Water, it is assumed that 20 percent of withdrawal by wells subsequently returns to the ground-water reservoir. The total amount of water pumped for irrigation in Scott County, as discussed in the section on Annual Withdrawals, was 150,000 acre-feet (185 hm3) in 1971 and 95,000 acre-feet (117 hm3) in 1972. The part of the total water pumped that returns to the reservoir in Scott County is estimated to be 30,000 acre-feet (37 hm3) in 1971 and 19,000 acre-feet (23 hm3) in 1972. As indicated in the water budget for Scott County, the effect of seepage from irrigation would reduce the amount of water withdrawn from storage to 120,000 acre-feet (148 hm3) in 1971 and 76,000 acre-feet (94 hm3) in 1972.
If the seepage of irrigation water is added to the inflow given in the budget for Scott County, the total water contributed to the reservoir would be 53,000 acre-feet (65 hm3) in 1971 and 52,000 acre-feet (64 hm3) in 1972. Thus, it would appear that the amount of water contributed to the reservoir from inflow and seepage remains relatively constant from year to year when there is little change in irrigated acreage.
Aquifer Properties
A geologic unit containing sufficient saturated permeable material to yield significant quantities of water to wells and springs is known as an aquifer. The principal hydraulic properties of aquifers are their ability to store and to transmit water. The ability to store water is expressed by the storage coefficient, and the ability to transmit water is expressed by the transmissivity.
The storage coefficient (S) is a measure of the volume of water that an aquifer releases from or takes into storage per unit surface area of the aquifer per unit change in head. If the water in the aquifer is unconfined, the storage coefficient is virtually equal to the specific yield. The specific yield is defined as the ratio of (1) the volume of water that the rock or soil, after being saturated, will yield by gravity to (2) the volume of the rock or soil.
Transmissivity (T) is the rate at which water of the prevailing kinematic viscosity is transmitted through a unit width of the aquifer under unit hydraulic gradient. Hydraulic conductivity (K) is defined as the volume of water at the existing kinematic viscosity that will move in unit time under a unit hydraulic gradient through a unit area measured at right angles to the direction of flow. Hydraulic conductivity, as used in this study, is transmissivity divided by the thickness of water-yielding material. The effective thickness is that part of the saturated aquifer material that yields most of the water to wells (i.e., loose sand and gravel).
The specific capacity of a well is the rate of discharge from a well divided by the draw down (difference between pumping level and static level) of the water level within the well; it varies slowly with duration of discharge. The duration of specific-capacity tests, reported in this study, ranged from 2 to 6 hours. Specific capacity is a measure of overall well performance, and is roughly proportional to transmissivity.
The transmissivity and the storage coefficient can be determined by several types of aquifer-test analyses of the effect of a discharging well on water levels in the pumped well and in nearby observation wells. During this investigation seven aquifer tests were made to determine the hydraulic properties of the aquifer. Data from the tests are tabulated in the summary of aquifer tests (table 2). Values determined by these tests pertain only to the water-yielding material for the duration of the test. Storage coefficients computed from a test of short duration generally are much less than specific yield values.
Table 2--Summary of aquifer tests.
| Well number | Transmissivity (ft2 per day) |
Storage coefficient |
Hydraulic conductivity (ft per day) |
Depth to water (feet) |
Effective thickness (feet) |
Saturated thickness (feet) |
Well depth (feet) |
Average discharge (gpm) |
Specific capacity (gpm per ft drawdown) |
Duration of test (min) |
Apparent radius of influence (feet) |
|---|---|---|---|---|---|---|---|---|---|---|---|
| 17-27-28acc | 2,440 | 0.032 | 70 | 90 | 35 | 35 | 126 | 140 | 12 | 7,000 | 600 |
| 17-30W-20bbc | 3,500 | .01 | 55 | 101 | 38 | 60 | 165 | 600 | 15 | 2,400 | 1,300 |
| 18-28W-18acc | 5,700 | 1---- | 130 | 60 | 44 | 44 | 104 | 625 | 38 | 20,300 | 1---- |
| 18-34W-23ccd | 2,960 | .18 | 179 | 117 | 17 | 17 | 140 | 150 | 17 | 3,600 | 200 |
| 20-32W-20adb | 3,200 | .001 | 44 | 92 | 72 | 89 | 190 2 | 455 | 12 | 5,700 | 5,500 |
| 20-33W-18abc | 6,000 | .14 | 104 | 103 | 60 | 80 | 164 | 625 | 32 | 30,000 | 1,300 |
| 20-33W-26caa | 9,900 | .001 | 309 | 92 | 32 | 70 | 144 | 440 | 31 | 6,700 | 5,200 |
| 1. Indefinite because of deviations from theoretical assumptions. 2. Estimated. | |||||||||||
Storage coefficients of 0.05 to 0.30 indicate unconfined (water-table) conditions; 0.001 to 0.05 indicate semiconfined conditions (Ferris and others, 1962). As indicated by table 2, the storage coefficients show values in the unconfined (water-table) range at wells 18-28W-18aac, 18-34W-23ccd, and 20-33W-18abc. Although the value for the storage coefficient at 17-27W-28acc indicates semiconfined conditions, the geology at the test site indicates that the aquifer should be unconfined (see log in Stullken and others, 1974). If the aquifer test had been conducted for a longer period of time, the resulting storage coefficient probably would have been in the unconfined range. The storage coefficient at 17-30W-20bbc indicates localized semiconfined conditions at the aquifer test site. Confined to semiconfined conditions are indicated by the storage coefficients of wells 20-32W-20adb and 20-33W-26caa.
The apparent radius of influence of a pumping well, as used in this report, is the greatest distance at which a drawdown of 1 foot (0.3 m) would occur on the cone of depression. This apparent radius, noted on table 2, is a theoretical value calculated for the duration of the test. Distances range from 200 feet (61 m) where the aquifer is unconfined to 5,500 feet (1,700 m) where the aquifer is confined. The apparent radius of influence varies at any site with the rate and duration of pumpage, areal variations of hydraulic conductivity, storage coefficient, and homogeneity of the aquifer.
The results of the seven aquifer tests made in this study represent the range of short-term operation conditions in the unconsolidated aquifer. Two of the tests are described fully because they are considered representative of the aquifer under operative field conditions.
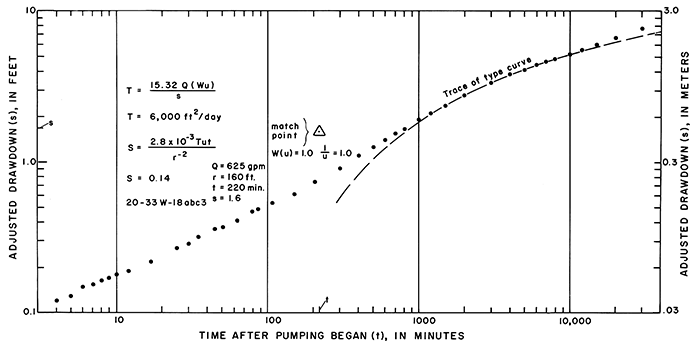
The aquifer test using well 20-33W-18abc (owned by Harold Williams) was conducted for 30,000 minutes (20.8 days) from April 6 to 27, 1972. The well discharge for the test was 625 gpm (39.4 L/s). At the test site the aquifer consists of sand and gravel in the Ogallala Formation. Observation well 20-33W-18abc2 was drilled at a distance of 80 feet (24.4 m) from the pumped well (see log of well in Stullken and others, 1974), and observation well 20-33W-18abc3 was drilled 160 feet (49 m) from the pumped well. The static water level in the pumped well and the two observation wells was about 103 feet (31 m) below the land surface at the start of the test. The initial saturated thickness at the pumped well and the two observation wells was about 60 feet (18 m).
A continuous record of water levels in the observation wells was obtained using electrical water-sensing devices coupled to water-level recorders. Figure 6 shows the curve of drawdown versus time derived from water-level measurements in observation well 20-33W-1Babc3 160 feet (49 m) east of the pumped well. Drawdown data were matched to the Theis non equilibrium type curve (Theis, 1935; and Jacob, 1944). Data from 3 to 1,000 minutes in the test are considered unreliable for use in the analysis because the contribution of water by gravity drainage from the sand and gravel layers was still significant. Data from 1,000 to 12,000 minutes in the test give a reasonably good match on the Theis nonequilibrium type curve. The data later than 12,000 minutes, which deviate from the trace of the curve, indicate accelerated drawdown, probably due to interference effects of pumping from nearby wells. These late-time data, therefore, are not reliable for analysis of aquifer constants. The transmissivity and storage coefficients were computed to be 6,000 ft2/day (560 m2/day) and 0.14 respectively as shown in table 2 and on figure 6.
Figure 6--Drawdown of water level in observation well 20-33W-18abc3, plotted against time in minutes after pumping began.
Results from aquifer-test analyses for thin unconfined aquifers with large drawdowns are questionable because the nonequilibrium formula does not take into account the thinning of the saturated zone as drawdown increases (Stallman, 1965). The aquifer test at well 1B-2BW-1Bacc (owned by Jay Walker) illustrates the problem of a thinning saturated zone and large drawdown.
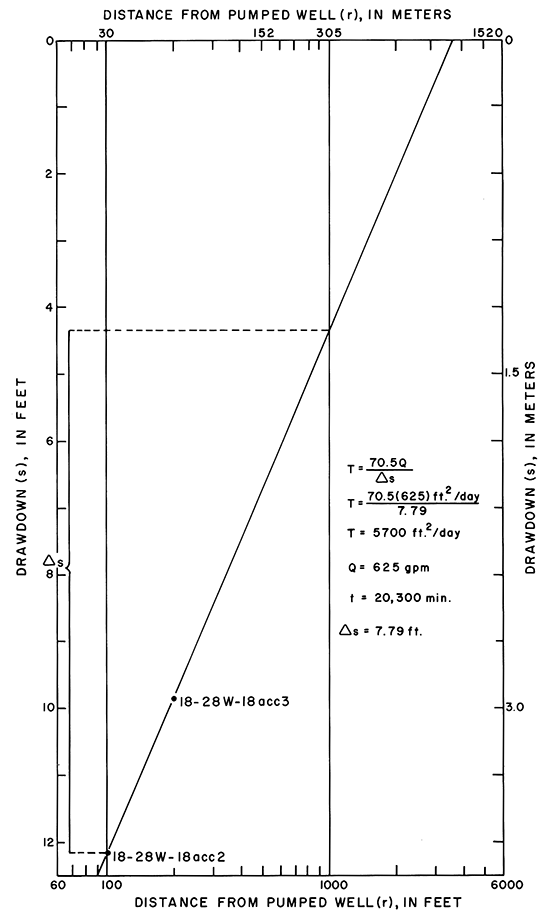
The test was run from August 9 to 23, 1972; it lasted 20,300 minutes, or 14.1 days. The well discharge averaged 625 gpm (39.4 L/s), which was measured by both an inline, propeller-driven, accumulating water meter and, periodically, by a pitot-tube water meter. At the test site the aquifer consists of sand and gravel of the Ogallala Formation, which fills a bedrock channel. Observation well 1B-2BW-1Bacc2 was drilled 100 feet (30 m) south of the pumped well (see log in Stullken and others, 1974), and observation well 1B-2BW-1Bacc3 was drilled 200 feet (61 m) south of the pumped well. The static water level at the start of the test was 60 feet (18 m) and the initial saturated thickness was 44 feet (13 m).
The water levels were recorded and the data adjusted for dewatering using the method by Jacob (1944). Figure 7 shows draw down plotted versus distance from the pumped well at the end of the test (20,300 minutes). The distance-drawdown curve represents a section through the cone of depression at the time of 20,300 minutes. The data were analyzed by the Thiem method (Thiem, 1906) for calculating transmissivity and by the Jacob intercept method (Ferris and others, 1962) for calculating the storage coefficient. Results of the aquifer-test analysis indicate a transmissivity of 5,700 ft2/day (530 m2/day) and an apparent storage coefficient of 0.013. A storage coefficient in this range would indicate that the water in the aquifer is semiconfined. However, the lithology at the observation wells show that semiconfinement should not exist at this location. Jacob (1944) points out that equations describing aquifer constants are valid for confined, homogenous, isotropic aquifers, or for similar unconfined aquifers where the drawdowns are small with respect to the initial saturated thickness. After 20,300 minutes of pumping, the saturated thickness was reduced by about 56 percent at the pumped well, 28 percent at the observation well 100 feet (30 m) away, and 23 percent at the observation well 200 feet (61 m) away. The authors believe that the exceptionally high ratio of drawdown to initial saturated thickness greatly affected the analysis, with minor influence from slow drainage as the well was pumped, resulting in the calculation of a much lower storage coefficient than field observation suggested. The transmissivity value, however, is not as greatly affected by deviation from the theoretical assumptions.
Figure 7--Drawdown of water levels in observation wells 20,300 minutes after pumping began in well 18-28W-18acc.
Additional transmissivity values were derived from the calculated specific-capacity values of 30 well-production tests, as summarized in table 3. The specific-capacity values were used to calculate the ability of the well to obtain water from the aquifer when the well is pumped at a rate sufficient to produce a drawdown equivalent to 70 percent of the effective saturated thickness. The transmissivity in feet squared per day can be estimated by multiplying the specific capacity by 203, which is the median of values ranging from 150 to 320 derived from the relation of specific capacity to transmissivity in the seven aquifer tests (table 2).
Table 3--Summary of data from well-production tests.
| Range (30 tests) |
Median | |
|---|---|---|
| Specific capacity (gpm per ft drawdown) |
5 to 50 | 18 |
| Transmissivity (ft2 per day) |
885 to 10,500 | 4,200 |
| Hydraulic conductivity (ft per day) |
22 to 309 | 81 |
| Saturated thickness (feet) |
17 to 145 | 60 |
| Effective thickness (feet) |
5 to 93 | 40 |
| Effective thickness (percent) |
25 to 100 | 80 |
| Potential yield (gpm) |
145 to 2,400 | 825 |
In areas where data from aquifer tests and well-production tests were lacking, the transmissivity values were estimated from drillers' and sample logs of wells and test holes using a method described by Fader and others (1964). The method involves assigning a hydraulic conductivity to each layer of material penetrated between the water table and the bedrock. The transmissivity of each layer is equal to the thickness of that layer multiplied by its hydraulic conductivity. The estimated transmissivity of the water-yielding section is the summation of the transmissivities computed for each layer. Values of hydraulic conductivity (table 3) ranged from 309 ft/day (94 m/day) for very coarse grained material to 22 ft/day (7 m/day) for fine silty sand with a median value of 81 ft/day (25 m/day). In areas where the water-yielding materials are mostly fine grained, the average hydraulic conductivities were about 40 ft/day (12 m/day). This method is subjective because lower or higher values of hydraulic conductivity may be assigned to a particular layer of material according to the collection methods employed and the experience and judgment of the observer.
All three methods of obtaining transmissivity data were used to prepare the transmissivity map shown on plate 3. The transmissivity values for coarse-grained deposits greatly exceed those for fine-grained deposits of equal thickness. The transmissivity values are greatest in areas where the bedrock channels are filled with loose coarse-grained alluvial materials. Material deposited away from the main channels is fine grained and the transmissivity values are correspondingly small.
The distribution of values used to prepare the transmissivity map of the unconsolidated aquifer was determined using the following input data (listed by degree of accuracy):
- From aquifer tests (table 2)
- From well-production data (2- to 6-hour stepdrawdown tests) reported by water-well contractors
- By estimation of transmissivity values from logs of test holes.
The transmissivity map can be used as a general guide for estimating the potential yield of wells, but decisions to drill wells should not be made solely on estimated transmissivity values. Local changes in lithologic character of the unconsolidated aquifer result in areal transmissivity changes too variable to map in detail. Test drilling would be necessary to determine whether or not the lithology of the aquifer at a selected site indicated a potential yield to wells adequate for the intended use.
Water-Table Configuration
The configuration of the water table in Lane and Scott Counties is shown on plate 2. Data for this map were obtained during the winter (January 1973) when the effects of seasonal pumping for irrigation were at a minimum. The major features of the waterlevel map are the shape and slope of the water surface. Contours were not shown where water levels are at or near the bedrock surface or isolated from the main body of the unconsolidated aquifer.
Confining conditions occur locally in Lane and Scott Counties where the alluvial deposits are extremely heterogeneous. In parts of the major south-trending trough, differences in head occur between water-yielding layers during periods of heavy pumpage because movement of water between layers is retarded by beds of clay. During the intervening periods of little pumpage, the beds of clay also retard the upward movement of water in response to artesian pressure to reach a static level (potentiometric surface) not significantly different from the water table. Therefore, the two surfaces are not differentiated in plate 2.
The water surface generally slopes eastward across the study area at about 10 feet per mile (1.9 m/km) and the water movement is in that direction. In the vicinity of the buried south-trending trough south of Scott City, the slope of the water surface changes direction to southward and flattens to about 3 feet per mile (0.6 m/km). The change in direction is caused partly by the effect of the prominent bedrock high north of Dry Lake (pl. 1). Flattening of the gradient, as evidenced by the widely spaced contours, probably is due to high conductivity of the material through which the water is moving, increased thickness of water-bearing materials, or both. The area defined by the widely spaced contours is underlain by very highly conductive sand and gravel deposits that fill the south-trending trough and its tributaries. In the area west of Shallow Water, the configuration of the water surface partly reflects the flow of water towards a center of intensive pumping, which has distorted the general flow pattern.
Closely spaced contours in the two counties indicate a steep slope of the water surface that probably is due to low hydraulic conductivity, reduced thickness of water-bearing materials, or both. The areas defined by closely spaced contours, however, may not have less water available to wells than areas defined by more widely spaced contours. A thin, highly conductive aquifer can yield as much water as a thick aquifer having a low conductivity. Wells in thin, very conductive deposits in the tributary valleys in Tps. 17-20 S., R. 34 W. have greater yields than wells in the adjacent areas having less conductive materials, although both areas have closely spaced contours.
The unnamed tributary of Ladder Creek that flows through Timber Canyon is an example of a gaining stream because it has intercepted the water table. Thus, the upstream flexure of contours shows flow toward the stream. The lack of upstream flexures in other areas where contour lines cross stream valleys indicates that the water table lies below the streambed, and that the streams receive no contribution from ground water.
In Lane County the area within the main body of the unconsolidated aquifer includes 34 percent of the county or 244 square miles (632 km2), The area within the main body in Scott County includes 81 percent of the county or 589 square miles (1,526 km2). In the area outside of the main body, the unconsolidated aquifer is extremely thin or absent. Ground water may occur in isolated channels cut into the bedrock, as in the area east of Dry Lake in T. 20 S., R. 31 W., Scott County. Wells in this area are developed in the alluvium of a small stream. Data were not available to accurately delineate the water table in areas where the aquifer is thin or in areas of rough topography where tributaries of the Smoky Hill River dissect the upland surface.
Two small areas within the main body of the unconsolidated aquifer are shown to be dry. In these areas, in T. 20 S., Rs. 33-34 W., Scott County, and T. 18 S., R. 29 W., Lane County, the water table probably exists in the chalk aquifer because the bedrock surface lies above the surrounding water table. To obtain a domestic or stock supply, wells must be drilled to either the chalk or the sandstone aquifers.
Saturated Thickness
The saturated thickness of the unconsolidated deposits is shown on plate 2. 'Within the main body of the unconsolidated aquifer, the saturated thickness ranges from less than 40 feet (12 m) to about 160 feet (49 m). Generally the deposits that fill the south-trending trough in Scott County contain the greatest saturated thickness. Outside of this trough, the saturated thickness generally does not exceed 80 feet (24 m) in Lane or Scott Counties.
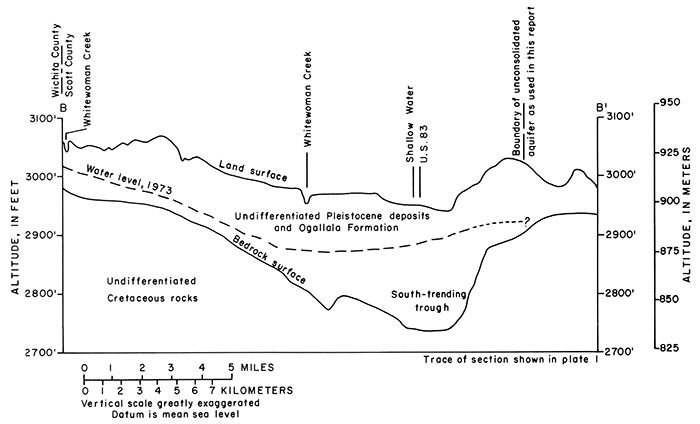
The general relation of the land surface, the water table, and bedrock surface is shown on geohydrologic sections A-A' (fig. 8) and B-B' (fig. 9). The sections illustrate that the saturated thickness is greatly influenced by the configuration of the bedrock surface. The effect of the bedrock high on saturated thickness east of the deep south-trending trough is illustrated by section B-B'.
Figure 8--Geohydrologic section A-A'.
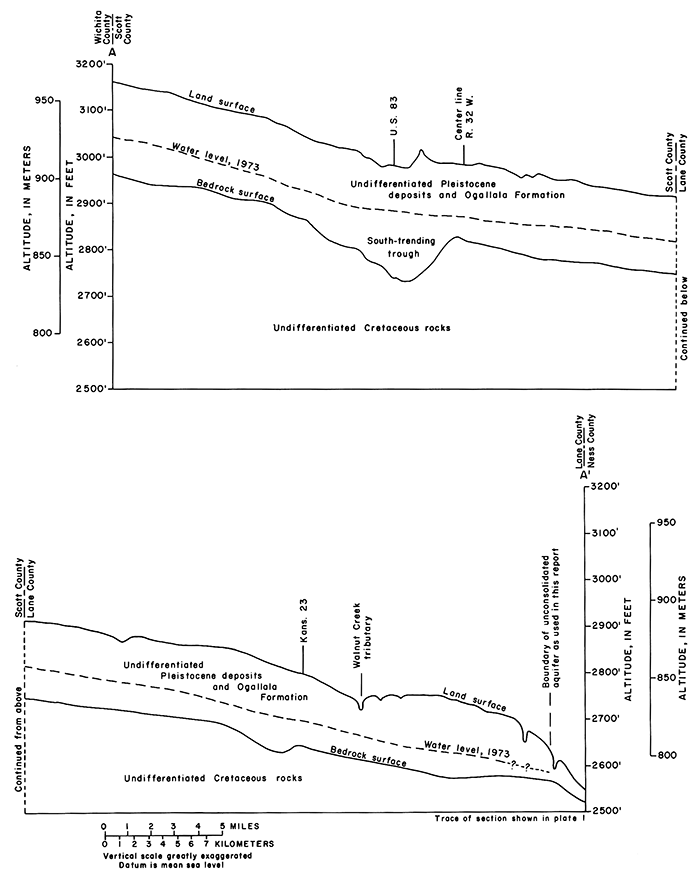
Figure 9--Geohydrologic section B-B'.
A large saturated thickness does not guarantee a successful irrigation well. Test hole 19-32W-8dcc (see Stullken and others, 1974, for log of well) is in an area where saturated thickness is about 150 feet (46 m), but the widely spaced layers of water-yielding poorly sorted sand and gravel consist of only 20 feet (6 m) or 13 percent of the total thickness. It would be difficult at this location to develop a well producing 100 gpm (6.3 L/s). On the other hand, irrigation wells in eastern Lane and western Scott Counties have been developed in as little as 20 feet (6 m) of saturated, well-sorted sand and gravel. The log of test hole 18-34W-33ccd3 (see Stullken and others, 1974, for log of well) indicates that all the 21 feet (6 m) of saturated deposits are water-yielding, and that a well at this site should produce about 150 to 200 gpm (9.4 to 12.6 L/s).
In some areas outside the main body of the unconsolidated aquifer, an irrigation well might be developed where very thin saturated deposits overlie and are in hydraulic connection with fractures and solution openings in the chalk aquifer. In other areas, isolated channels may have a sufficient saturated thickness and may contain enough water-yielding materials to supply irrigation wells.
The distribution, thickness, degree of sorting, and hydraulic conductivity of water-yielding materials within the saturated section are important considerations in developing an irrigation supply. Saturated thickness, however, can be used as an approximation in locating a possible well site. The water-well contractor generally can estimate well yields by calculating the percent of water-yielding materials within the total saturated section. (See section on potential yield.)
The amount of ground water stored in the unconsolidated aquifer in Lane and Scott Counties can be computed by planimetering the saturated-thickness intervals shown on plate 2, multiplying by the average saturated thickness of each interval, summing the products, and multiplying this summation (volume) by the specific yield. The unconsolidated aquifer, in general, has a specific yield (storage coefficient) between 0.15 and 0.20 (Meyer and others, 1970; Pearl and others, 1972). A storage coefficient of 0.15 would also be representative of aquifer tests in the unconfined main body of the unconsolidated aquifer (table 2). In the south-trending trough, numerous beds of low hydraulic conductivity separate the various water-yielding layers and result in confined or semiconfined conditions. The specific yield in this area probably ranges from 0.01 to 0.15. Aquifer tests in the trough area have been made using wells completed in the lower more confined water-bearing layers. Storage coefficients determined from these tests are as low as 0.001 (table 2). The area considered as confined, generally coinciding with the south-trending trough, contains about 10 percent of the study area and about 20 percent of the total saturated thickness of the unconsolidated aquifer in Lane and Scott Counties.
Allowing for the range in specific yield, the total volume of water in storage in Lane and Scott Counties is estimated to be between 4 and 6 million acre-feet (4,900 and 7,400 hm3) as of January 1973. Assuming that only 70 percent of the total volume of water is recoverable by wells, between 2.8 and 4.2 million acre-feet (3,500 and 5,200 hm3) are available for pumping.
Chemical Quality
Chemical character of ground water in the study area is indicated by the selected analyses shown in table 4. More analyses are published in the basic-data report. (See table 4 in Stullken and others, 1974.) The analyses show only the dissolved mineral content of the water, not its sanitary condition. For a discussion of the significance of chemical constituents in ground water, the reader is referred to the reports of Waite, 1947; Prescott, 1951; and Meyer and others, 1970.
Table 4--Chemical analyses of water from selected wells and springs in Lane and Scott Counties. [Dissolved constituents and hardness given in milligrams per liter. Analyses by Kansas Department of Health and Environment.]
| Well number | Well depth (feet) |
Geologic source1 |
Date of collection |
Temp. (°C) |
Dissolved solids (residue at 180°C) |
Dissolved silica (SiO2) |
Iron (Fe) |
Dissolved manganese (Mn) |
Dissolved calcium (Ca) |
Dissolved magnesium (Mg) |
Sodium and potassium (Na + K) |
Bicarbonate (HCO3) |
Dissolved sulfate (SO4) |
Dissolved chloride (Cl) |
Dissolved fluoride (F) |
Dissolved nitrate (NO3) |
Hardness (CaCO3) | Specific conductance (micromhos at 25°C) |
pH | ||
|---|---|---|---|---|---|---|---|---|---|---|---|---|---|---|---|---|---|---|---|---|---|
| Total | Carbonate | Noncarbonate | |||||||||||||||||||
| Lane | |||||||||||||||||||||
| 16-28W-32cac | 110 | To | 8-5-1971 | 15.5 | 294 | 21 | .06 | .0 | 48 | 19 | 30 | 244 | 25 | J3 | 3.2 | 2.9 | 200 | 200 | 0 | 450 | 7.7 |
| 16-29W-11ccc | 749 | Kd | 9-15-1948 | 18.0 | 932 | 9.2 | .98 | 5.2 | 3.0 | 380 | 734 | 39 | 110 | 8.0 | .7 | 26 | 26 | 0 | |||
| 17-27W-28acc | 127 | To | 8-5-1971 | 15.0 | 318 | J3 | .05 | .0 | 59 | 20 | 25 | 232 | 40 | 21 | 2.4 | 8.0 | 230 | 191 | 39 | 500 | 7.8 |
| 17-30W-20bbc | 165 | To | 8-5-1971 | 15.5 | 316 | 22 | .06 | .0 | 54 | 17 | 32 | 224 | 48 | J8 | 2.2 | 8.4 | 200 | 180 | 20 | 490 | 7.8 |
| 18-28W-16ccd | 55 | To | 6-18-1971 | 15.0 | 380 | 65 | l.l | .0 | 45 | 24 | 45 | 288 | 24 | 18 | 4.4 | 13 | 210 | 210 | 0 | 570 | 8.1 |
| 19-29W-7bab | To | 7-27-1971 | 15.0 | 340 | 18 | .62 | .0 | 6-1 | 23 | 22 | 281 | 7.5 | 10 | .8 | 45 | 250 | 226 | 24 | 540 | 7.7 | |
| 20-27W-12a | Spring | Kn | 6-21-1971 | 13.0 | 704 | 21 | .15 | .0 | 130 | 18 | 85 | 300 | 200 | 63 | .5 | 38 | -100 | 250 | 150 | 1,070 | 7.4 |
| 20-29W-3ccb | 80 | To | 7-23-1971 | 17.0 | 384 | 14 | .06 | .0 | 58 | 22 | 46 | 254 | 43 | 29 | 1.0 | 35 | 240 | 213 | 27 | 620 | 7.8 |
| Scott | |||||||||||||||||||||
| 16-33W-13ba | Spring | To | 8-5-1971 | 16.0 | 272 | 14 | .11 | .0 | 45 | 14 | 31 | 207 | 33 | 12 | 2.0 | 9.7 | 170 | 170 | 0 | 440 | 7.7 |
| 16-33W-30bab | 187 | To | 8-12-1971 | 15.5 | :300 | 'r | .19 | .0 | 43 | 18 | 32 | 207 | 38 | 14 | 2.0 | 9.7 | 180 | 168 | 12 | 430 | 8.1 |
| 17-31W-27aba | 187 | To | 6-16-6-1 | 380 | 46 | .00 | .0 | 56 | 20 | 42 | 237 | 60 | 26 | 2.2 | 11 | 220 | 192 | 28 | 540 | 7.6 | |
| 17-34W-16acb | 208 | To | 7-10-1964 | 351 | 41 | .00 | .0 | -16 | 22 | 39 | 222 | 64 | 18 | 2.2 | 8.9 | 210 | 186 | 24 | 530 | 7.4 | |
| 18-33W-13dad | 225 | Qu | 4-10-1968 | 326 | 52 | .00 | .0 | 50 | 18 | 30 | 229 | 38 | 14 | 1.6 | 10 | 200 | 189 | 11 | 480 | 7.9 | |
| 18-33W-22bcc | 120 | To | 12-21-1971 | 14.0 | 7.38 | 11 | .27 | .0 | 140 | 46 | 41 | 303 | 200 | 95 | 1.0 | 17 | 530 | 250 | 280 | 1,100 | 7.9 |
| 19-31W-16cba | 76 | Kn | 8-12-1971 | 15.0 | 362 | 26 | .29 | .0 | 75 | 12 | 29 | 254 | 40 | 29 | .4 | 9.7 | 240 | 212 | 28 | 510 | 7.8 |
| 19-32W-30bab2 | 200 | Qu To |
8-3-1964 | 579 | 31 | .01 | .0 | 69 | -12 | 79 | 366 | 40 | 25 | 2.2 | 6.2 | 340 | 296 | 44 | 880 | 7.4 | |
| 19-33W-12ddc2 | 140 | To | 8-5-1971 | 14.0 | 2,250 | 17 | .10 | .0 | 240 | 160 | 260 | 364 | 1,100 | 200 | 2.4 | 12 | 1,200 | 260 | 940 | 2,900 | 7.5 |
| 20-32W- 7cba | 112 | To | 8-5-1971 | 13.5 | 1,020 | 21 | .08 | .0 | 150 | 63 | 101 | 351 | 390 | 90 | 2.0 | 13 | 630 | 290 | 340 | 1,470 | 7.6 |
| 20-33W-16cbb2 | 137 | To | 7-10-1964 | &bnsp; | 321 | 30 | .00 | .0 | 56 | 21 | 26 | 210 | 49 | 28 | .8 | 7.1 | 230 | 176 | 54 | 500 | 7.4 |
| 1 Geologic units abbreviated as follows: Kd, Dakota Formation; Kn, Niobrara Chalk; To, Ogallala Formation; Qu, undifferentiated Pleistocene deposits. |
|||||||||||||||||||||
Results of chemical analyses show that concentrations of some constituents in ground water from Lane and Scott Counties exceed the limits recommended by the Kansas Department of Health and Environment for drinking water. These limits are listed below in milligrams per liter (mg/L):
| Chloride (Cl) | 250 |
| Fluoride (F) | 1.2 |
| Iron (Fe) | .3 |
| Manganese (Mn) | .05 |
| Nitrate (NO3) | 45 |
| Sulfate (SO4) | 250 |
| Dissolved solids | 500 |
Dissolved fluoride and dissolved nitrate may be health hazards when present in concentrations much higher than the recommended limits (U.S. Public Health Service, 1962, pp. 41, 47-50). Fluoride concentrations greater than 1.5 mg/L may cause mottled tooth enamel if the water is consumed by children during the period of formation of permanent teeth (Dean, 1936). Bone changes may occur when water containing more than 8 mg/L fluoride is consumed for a long period of time (Shaw, 1954), but such changes have not been noted in the United States (U.S. Public Health Service, 1962, p. 41). Concentrations of fluoride from 1.0 to 1.2 mg/L in drinking water can aid in preventing tooth decay (Kansas State Board of Health, 1973). Water from several of the wells listed in table 4 contained higher-than-recommended concentrations of fluoride.
Water containing nitrate in concentrations greater than 45 mg/L may cause methemoglobinemia, or cyanosis, in infants and the public should be informed of the danger in areas where high concentrations occur (U.S. Public Health Service, 1962, p. 50). Water containing 45 mg/L nitrate was found in one well listed in table 4 and higher-than-normal concentrations were found in two other water samples. In Lane and Scott Counties, such high concentrations of nitrate generally indicate local pollution of ground water by animal wastes that enter the water through improperly sealed wells or by percolation through permeable sediments above the water table.
Water Types
The results of chemical analyses of water samples from the unconsolidated aquifer (Ogallala Formation and Pleistocene deposits) and one sample from a well in the chalk aquifer (Niobrara Chalk) indicate that the water, classed by predominant ions, generally is a calcium bicarbonate type and ranges in hardness from 200 to 530 mg/L, although there are some exceptions. Well 19-32W-30bab2 yields a magnesium bicarbonate water, well 19-33W-12ddc2 yields a magnesium sulfate water, and well 20-32W-7cba yields a calcium sulfate water. These wells are located in an area of a shallow water table and undrained surface depressions. Under these conditions, residual salts resulting from evaporation accumulate in fine- to medium-textured soils. Subsequent flushing of the more soluble salts from the soil causes relative enrichment of magnesium, sodium, sulfate, and chloride ions in the ground water (Meyer and others, 1970).
Water from most wells in the unconsolidated and chalk aquifers is suitable for most domestic, stock, and irrigation uses. Water from wells in the sandstone aquifer (Dakota Formation) is of the sodium bicarbonate type and the analysis shown in table 4 and figure 10 indicates the water is unsuitable for most uses. Water from the sandstone aquifer should be analyzed as to suitability for the intended use.
Suitability for Irrigation
The development and maintenance of successful irrigation requires the control of salinity and alkalinity of soils, as well as supplying irrigation water to the land. The chemical characteristics of water that are most important in determining its suitability for irrigation in Lane and Scott Counties are: (1) total concentration of soluble salts, and (2) relative proportion of sodium to other principal cations (calcium, magnesium, and potassium). The total concentration of soluble salts in irrigation water can be expressed in terms of electrical conductivity. Electrical conductivity is the ability of the solution to conduct an electrical current, and is expressed in micro mhos per centimeter at 25° Celsius. Water with a conductivity value (fig. 10) below 750 micromhos/cm at 25°C is satisfactory for irrigation insofar as salt content is concerned, although crops sensitive to salt may be adversely affected by irrigation water with conductivity values in the range 250 to 750 micromhos/cm at 25°C. Water in the range 750 to 2,250 micromhos/cm at 25°C is widely used, and satisfactory crop growth may be obtained under favorable soil-drainage conditions and good management. However, saline soil conditions will develop when leaching is incomplete and excess soluble salts are deposited in the root zone. Very few instances are known where water with conductivity values greater than 2,250 micromhos/cm at 25°C has been used successfully. The use of large quantities of such water on soils and subsoils with excellent drainage may allow the more salt-tolerant crops to be grown.
Figure 10 indicates that water in the chalk aquifer and in the unconsolidated aquifer is in the C2-S1 class. This represents medium-salinity water (C2) that can be used if moderate leaching occurs. Moderately salt-tolerant plants generally can be grown without special salinity control practices. Low-sodium water (Sl) can be used on most soils with scant danger of the development of harmful levels of exchangeable sodium.
Figure 10--Suitability of water for irrigation.
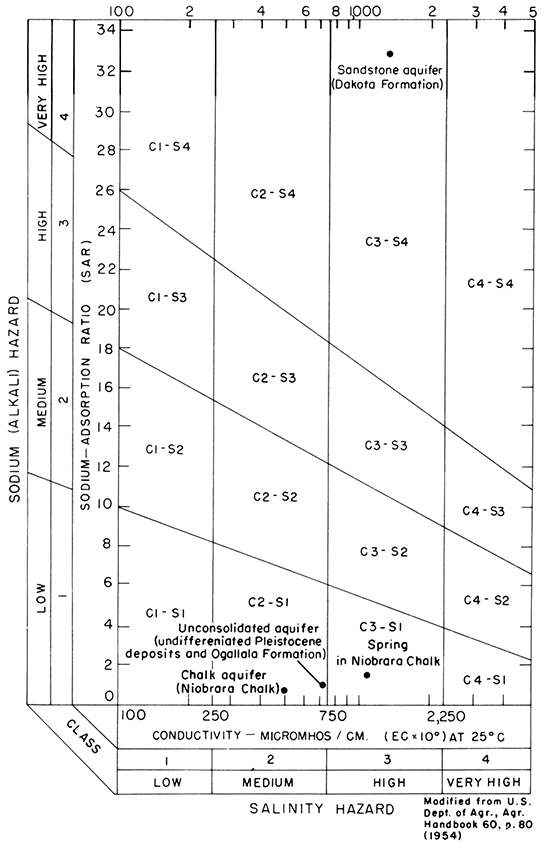
The sample of water from a spring issuing from the Niobrara Chalk in eastern Lane County (20-27W-12a) is in the C3-S1 class which indicates that it is a high-salinity water (C3) and would need special management even on adequately drained soils growing salt-tolerant plants. Water in the chalk aquifer generally is classified with water from the unconsolidated aquifer, except for the spring issuing from Niobrara Chalk. The similarity of chemical quality is further evidence that water in the chalk aquifer is supplied by drainage from the overlying unconsolidated aquifer.
The sample of water from the Dakota Formation (16-29W-11ccc) lies in the C3-S4 class. This is a high-salinity water (C3) combined with a very high-sodium water (S4); it is unfit for all types of irrigation, including lawns. The possibility does exist that better-quality water than the water in this sample might be found elsewhere in the sandstone aquifer.
Prev Page--Geohydrology || Next Page--Development
Kansas Geological Survey, Geohydrology
Placed on web June 24, 2013; originally published 1976.
Comments to webadmin@kgs.ku.edu
The URL for this page is http://www.kgs.ku.edu/Publications/Bulletins/IRR1/04_aquif.html