![]()
![]()
![]()
Prev--Pleistocene loess in Kansas || Next--Soils and geomorphic surfaces
(reprinted from the January-February 1984, vol. 22, no. 1, issue of Ground Water)
Aquifers found in glacial buried valleys are a major source of good-quality ground water in northeastern Kansas. The extent and character of many of these deposits are not known precisely, so a detailed study of the buried valleys was undertaken. Test drilling, Landsat imagery, shallow-earth-temperature measurements, seismic refraction, surface electrical resistivity, and gravity data were used to evaluate two sites in Nemaha and Jefferson counties. Tonal patterns on springtime Landsat imagery and winter/summer anomalies in shallow-earth temperatures were quick and inexpensive methods used in locating some glacial buried aquifers and suggested areas for more intensive field studies. Reversed seismic refraction and resistivity surveys were generally reliable indicators of the presence or absence of glacial buried valleys, with most depth determinations being within 25% of test-drilling results. The effectiveness of expensive test-hole drilling was greatly increased by integrating remote-sensing, shallow-earth-temperature, seismic, and resistivity techniques in the two buried-valley test areas. A gravity profile allowed precise definition of the extent of one of the channels after the other techniques had been used for general information.
As population and demand for water increase, ground-water supplies are gaining significance in northeastern Kansas. They are especially important during times of low precipitation, when surface-water supplies decline. Although bedrock formations in the area generally contain little, if any, high-quality water, large quantities of fresh-water may be obtained from deposits in glacial buried valleys. To locate these aquifers, a program integrating remote-sensing, geophysical, and test-drilling techniques has been used.
Two small test sites were chosen from the general study region, which includes 16 counties in northeastern Kansas (fig. 1). The distinctive test sites include a broad, deep channel in Nemaha County and a very narrow, deep channel in Jefferson County. They were chosen to evaluate the applicability of the remote-sensing and geophysical methods for delineating buried valleys in the larger study region. The general study area represents the counties that were entirely or partially glaciated during pre-Illinoian time. Quaternary deposits exposed in northeastern Kansas include glacial drift (till, outwash, and lacustrine deposits), loess, and alluvium. Pennsylvanian and Permian shale, limestone, and sandstone bedrock formations occur near the land surface in other areas.
Figure 1--General buried-valley study area and test sites.
The general location of preglacial drainage ways is shown in fig. 2. The buried valleys may be up to 3 mi (5 km) wide, 400 ft (120 m) deep, and more than 75 mi (120 km) long. Deposits filling these valleys range from clayey sediments to sand and gravel. Many of the buried-valley aquifers are confined, while others are unconfined. Water levels are commonly between 5 and 50 ft (1.5-15 m) below the land surface, but locally they may exceed 100 ft (30 m). Aquifer yields range to approximately 500 gal/min (31 L/sec).
To investigate the 16-county study area, data have been compiled from such sources as water-, oil-, and gas-well drillers; engineering firms; and previous hydrogeologic studies. Naturally, in the 9,500 mi2 (24,600 km2) region are many areas with little or no reliable data. Positive results in the Nemaha and Jefferson County test sites demonstrate the benefit of using remote-sensing, temperature-profiling, seismic, resistivity, and gravity methods to maximize the effectiveness of test drilling for locating and evaluating other glacial buried-valley aquifers.
Figure 2--Preglacial drainage map of northeastern Kansas (after Dreeszen and Burchett, 1971) and test sites.
The remote sensing, temperature, seismic, and resistivity methods used in this study are described by Denne et al. (1982). The gravity technique is detailed by Heider (1982). Only a brief discussion of the research methods and references is included here.
Springtime Landsat imagery has been shown to be useful for analysis of glacial deposits in the Midwest (Peterson et al., 1975; Lucas and Taranik, 1977), so imagery from March, April, and May was evaluated for northeastern Kansas. On several false-color composite images, tonal patterns were identified that were thought to be associated with buried valleys in Nemaha, Marshall, and other counties. These image patterns form faint curving paths that cut across landscape features, but often follow topographic highs. The image patterns have a blue-gray color on the false-color composites and dark-gray tones on black-and-white prints of the infrared spectral bands. They are probably related to variations in surficial materials, which in turn influence variations in soil-moisture content. These differences are most apparent in spring when the growth of vegetation is just beginning. When these images are compared to the preglacial drainage map of the lower Missouri basin (Dreeszen and Burchett, 1971), a general correspondence between image patterns and some mapped buried valleys can be seen.
Computer-enhanced imagery proved to be more useful than unenhanced standard products in delineating tonal patterns thought to be associated with buried valleys. Available EDIES (EROS Data Center Digital Image Enhancement System) imagery was evaluated for the study area. To delineate image patterns even more readily, a linear-contrast-enhancement technique (for a general discussion, see Taranik, 1978) was applied to a springtime Landsat scene at the U.S. Geological Survey's EROS Data Center. An interactive multispectral image-analyzing system (General Electric Image 100) was used to maximize the difference between the light and dark image tones associated with the buried channel in Nemaha County on an infrared band (Landsat, band 7, May 3, 1976, ID #246716171). The enhanced band 7 was recorded on film by a laser-beam recorder. A subscene covering the study area was extracted photographically and printed at 1:125,000 scale. A pattern analysis was completed for this subscene, and areas thought to have buried valleys were delineated. This approach formed the strategy for more intensive field-exploration techniques.
Seismic-refraction techniques were developed largely in the 1920's and 30's for petroleum exploration. Although for petroleum prospecting, reflection profiling has largely supplanted refraction work, seismic refraction remains a viable means of rapid, inexpensive probing of the earth for reconnaissance, for delineation of the deep earth crust, and for very shallow geologic evaluation. In addition, refraction profiling provides a direct means of measuring the seismic P-wave velocity of the high-velocity layers in the earth, a measurement that reflection techniques can only indirectly and inaccurately determine. Refraction prospecting is thoroughly covered in the literature (Musgrave, 1967; Dobrin, 1976).
Reversed-refraction profiling was used in these studies. It involves placing shots at either end of the geophone (receiver) spread such that measurements are made in both directions of the line. This technique can allow appropriate interpretations of many situations which would be unresolved by unreversed, single-ended refraction profiling. For example, reversed profiling provides a measure of true velocity and dip, confirms faults and lateral velocity change, and substantiates the interpretation of travel-time anomalies.
Several assumptions are made in reversed-refraction profiling:
Violations of these assumptions affect the interpretability of the data and accuracy of the results. Areas with glacial tills and/or alluvium can challenge some of the assumptions. Sand and clay lenses or channel deposits in tills and velocity anisotropy of alluvium may violate item 2 (Denne et al., 1982), and results of this study suggest that rugosity of the till/alluvium-bedrock interface may be beyond the tolerances of item 3. However, the units being measured are of adequate thickness (item 4). The presence of low- velocity zones (item 5) would cause calculated bedrock depths to be too deep.
Data were recorded onto magnetic tape using an Input/Output DHR (Digital High Resolution) 1632 seismograph. (The use of specific product names throughout the text is for identification only and does not imply endorsement by the Kansas Geological Survey.) In Jefferson County, data were recorded on eight channels using up to 1.5 lbs (0.68 kg) of explosives. The remainder of the data were recorded with 12 channels using either an earth compactor Mini-SOSIE (Barbier and Viallix, 1973) or Betsy Seisgun source. Betsy Seisgun is an eight-gauge ring-blaster kiln gun designed to fire a 3-ounce (85-g) slug into the ground vertically.
Data analyses were done using a hand-held computer and program by Stander (1977). The program solved for true velocity, thickness, and dip for any number of layers. Computer-enhancement processing (filtering) was occasionally done to aid first-pick arrival. In general, the reduction of refraction data is done in the field on a real-time basis. This procedure is advisable as the evaluation of results can then affect the field work.
Surface geoelectric methods can be used to locate hydrogeologic targets of interest in the subsurface, providing the target is sufficiently large and differs enough in resistivity from surrounding material to be distinguished. The minimum relative size of a target necessary for detection increases with depth below the land surface. Layered materials with high-resistivity values [greater than 200 ohm-ft (61 ohm-m)] such as sand, gravel, and limestone can usually be distinguished from lower-resistivity materials such as clay and shale, providing the individual layers are of adequate thickness.
Vertical electrical soundings (VES) are used to determine the vertical differences in apparent resistivity caused by different geologic units (Zohdy et al., 1974). In this study, the Schlumberger electrode array (Zohdy et al., 1974) was used to generate apparent resistivity curves. Values of apparent resistivity were calculated from measurements of a controlled source of current transmitted through the outer probes in the array and the potential difference between the inner probes and a computation of a geometric factor for the array. Inaccuracies caused by lateral inhomogeneities in the shallow subsurface are minimized using the Schlumberger array.
Apparent resistivity data were collected using a Bison Model 2390 Signal Enhancement Resistivity System. The VES curves were interpreted using an automated inversion program developed by Zohdy (1973). The program computes a geoelectric layering of the subsurface that is consistent with the apparent resistivity data.
Shallow-earth temperature profiling for aquifers uses variations in the thermal properties of geologic materials and water (Cartwright, 1968). Unconsolidated sediments have relatively low thermal conductivities, water is intermediate, and bedrock units have much higher values. The materials, therefore, respond differently to a changing temperature environment. The presence of water in unconsolidated deposits significantly changes the thermal properties of the deposits because of the very high specific heat of water and its greater thermal conductivity. The water may then cause a shallow aquifer to act as a heat sink or a heat source. If an aquifer has distinct lateral boundaries and if the temperature effects of other heat sources or losses can be eliminated or evaluated, a positive (warm) anomaly would be expected over it in winter, and a negative anomaly would be expected in summer.
Field measurement of soil temperatures in the south-western part of the general study area indicates that diurnal-temperature effects are not significant there at depths of 4 ft (1.2 m), so this depth was adopted for our study. The 4-ft (1.2-m)-deep measurement holes were drilled using a hand probe or truck-mounted core barrel or auger. The instrumentation for measuring soil temperature consisted of a general-purpose thermistor probe epoxied at the end of a 0.375-inch (0.95-cm)-diameter clear-plastic rigid tube and a battery-powered, lightweight YSI (Yellow Springs Instrument Co., Inc.) model-46 telethermometer.
Bedrock formations are typically more dense than the overlying glacial sediments. If the density contrast between glacial sediments and bedrock is large enough, bedrock relief should be detectable by gravity measurements (Carmichael and Henry, 1977). A depression in the bedrock surface, which is filled with sediments, causes a gravity low in comparison to a flat-bedrock topography.
To test the applicability of this technique in the glaciated portion of northeastern Kansas, a gravity profile was taken over a known buried valley in Jefferson County. Gravity measurements, using a Lacoste-Romberg Model G meter (no. 245), were taken every 50 ft (15 m) over a distance of 2,300 ft (690 m). The elevations of measurement stations were surveyed to 0.01 ft (0.003 m), but benchmark control allows certainty to only ±0.5 ft (0.015 m), which corresponds to a gravity-measurement uncertainty of ±0.03 milligals. Repeated base-station readings were used to make gravity corrections for the earth's tidal variation and for meter drift. A Bouguer gravity-anomaly value was calculated for each station using a density of 2.0 gm/cm3. Terrain corrections were not required because of the low relief. A linear regional gradient, determined by least squares, of 0.023 milligals/100 ft (30 m) along the profile was subtracted from the Bouguer anomaly values. A forward modeling program, based on prism calculations of Goodacre (1973), was used to model the bedrock relief underlying the profile. Bedrock and glacial-fill densities were estimated from borehole-density logs in the area. For further details on gravity-data acquisition, reduction, and modeling techniques used, see Heider (1982).
Test drilling was used to verify the presence of buried valleys and to evaluate the character of the aquifers. Shallow (less that 107 ft [33 m]) auger holes and deep (100-400 ft [30-122 m]) rotary holes were drilled. In addition, logs were obtained from water-well and oil and gas drillers, engineering firms. and other government agencies. In the two test areas. more holes were drilled in regions where interpretations of remote-sensing and geophysical data suggested the presence of buried valleys. In both drill-hole and geophysical analyses. differentiating glacial clays from shale bedrock was often difficult.
Two small areas in Nemaha and Jefferson counties were intensively studied using a combination of the methods previously discussed. These locations were chosen for their distinctive types of buried valleys. One channel ranged up to 3 mi (5 km) in width and 400 ft (120 m) in depth. while the other is only about 500 ft (150 m) wide in places, but is still 100-200 ft (30-60 m) deep.
The major buried valley of northeastern Kansas is a tributary of the ancestral Grand River in Missouri . It occurs in the southern part of Nemaha County, Kansas (fig. 2), where the valley fill is known to be as much as 380 ft (116 m) thick. A basal gravel, generally less than 20 ft (6 m) thick, is overlain by heterogeneous clayey sediments, and sand and gravel layers are found between the clays. Aquifer yields range to about 350 gpm (22 L/sec).
Figure 3--Enhanced band 7 Landsat subscene for northeastern Kansas. Image 10 #246716171, path 29, row 33, May 3, 1976.
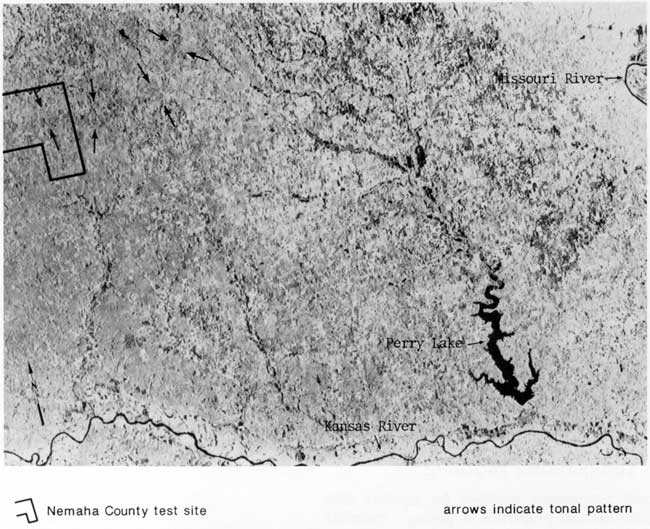
Most of Nemaha County is covered by glacial drift. Alluvial deposits occur along most of the modern streams, and bedrock outcrops are found in the extreme southern, northern, and locally in the central parts of the county.
On Landsat imagery for Nemaha County, variations in topography, land use, and surficial materials with their attendant moisture content form complex, interrelated patterns to be analyzed. Using conventional techniques of air-photo interpretation, a narrow band of dark-gray tone that curves from the southeast part of Marshall County to the east-central part of Nemaha County was delineated on the enhanced band 7 subscene from May 3, 1976 (fig. 3). For more than 10 mi (16 km) in southwest Nemaha County, the axis of the major buried valley as mapped by Ward (1974) falls within the tonal pattern delineated from the image. Seemingly, the entire pattern may be associated with a lobate-end moraine and ice-marginal drainage.
A test line of thermal, resistivity, seismic, and drill-hole sites in Nemaha County is shown in fig. 4. The buried-valley axes as mapped by Ward (1974), and the orientation and extent of the pattern delineated from the enhanced Landsat imagery also are shown. On the Landsat image, the northern boundary of the tonal pattern is distinct, while the southern edge is less well defined because of gradational changes in tone.
Figure 4--Test sites in parts of Nemaha and Marshall counties.
The surface topography and field data from the Nemaha County test line are profiled in fig. 5. The outer limits of the valley system along this profile are defined at least by bedrock exposures at the south end (site J) and 1 mi (1.6 km) north of A. The seven rotary test holes were drilled for the present study.
Test-hole data at Band D indicate a steeply sloping north valley wall. This correlates well with the north edge of the Landsat pattern. The deepest part of the channel occurs between D and E, and these holes contain 8-19 ft (2-5.8 m) of basal gravel and sand. The Landsat pattern extends only about 0.5 mi (0.8 km) south of E, but test-hole F, with 8 ft (2 m) of basal sand and gravel, seems to be on the gently sloping south side of the valley. This interpretation is contrary to Ward's (1974) bedrock topographic map, which shows a bedrock high (between F and G).
The main-channel axis does pass near D as mapped by Ward (1974), but a major tributary does not go through G. A test hole at G revealed 149 ft (45 m) of silty and fine sandy glaciofluvial material overlain by 52 ft (16 m) of till, but the bedrock elevation was 130 ft (40 m) above the 1,000-ft (305-m) contour as previously mapped. Test-hole G also seems to be on the gently sloping south valley wall of the main channel.
Interpretations of resistivity data yielded bedrock depths (fig. 5) that were generally within 25% of actual test-hole values. Bedrock depths were interpreted to be shallower than was indicated from drill-hole data at sites H, F, and D. The resistivity estimate was 3% off at E, and no drill-hole information is available at site I. The discrepancies between the estimated and actual depths to bedrock could be attributed to a number of factors including the accuracy of the instrument, lack of sufficient resistivity contrast between the bedrock and glacial materials, and too few vertical electrical soundings for the complex geoelectric layering in the subsurface. The maximum current that can be transmitted by the Bison instrument is 0.1 amps. The ability to transmit greater amounts of current would have allowed for more reproducible values of the potential-difference measurement, and thus a more accurate apparent resistivity curve. Additionally, more VES sites along the profile would have produced better correlation laterally between VES sites and could have facilitated the depth-to-bedrock determinations in this geologically complex setting.
Figure 5--Data profile for Nemaha County test line; letter above profile indicates test site.
Results of the reversed seismic-refraction profile suggest general agreement with drill-hole data. There is, however, a consistent tendency for the refraction results to be too deep, suggesting the presence of a low-velocity zone. One of the fundamental problems of seismic work is that frequently some uncertainty exists as to where the measurement comes from. For instance, unlike the drill, seismic energy does not travel straight up and down but rather takes the most expedient path. This means that the depth points may be placed with some error and could even be out of the plane of the profile.
The seismic bedrock point under E shows a deep valley which, by drill evidence may not exist. Because this "valley" is determined by only one measurement, it could be an error, but the data defy interpretation that would reduce the error. Possibly the drill hole was close to a narrow valley that the seismic measurement found. At B, the unconsolidated deposits are thin, so a deeper layer within the bedrock may have been selected instead of the first contact. Disregarding the measurements at E and B, the bedrock depth errors are less than 20%.
The temperatures measured in late summer 1980 are profiled above the cross section in fig. 5. The general pattern indicates a broad temperature depression over the main buried valley, a temperature recovery over the shallower bedrock, and a decline over the area formerly mapped as a tributary (G). Data south of G (not plotted) are unreliable because they were obtained after a local thunderstorm.
The average temperature over the northern bedrock high (A to C) is 23.4°C (74.1 °F). Over the gently sloping south wall (south of F to just north of G), the average is 22.9°C (73.2°F). The average temperature over the buried valley (D to F) is 22.3°C (72.1°F). The temperature averages include isolated highs, some of which could be due to holes that were several inches less than 4 ft (1.2 m) deep or to surficial deposits with abundant lime concretions. The high-thermal conductivity of carbonates as opposed to clays and sands may be responsible for elevated temperatures. Qualitative corrections for such microenvironmental variables suggest that temperature anomalies relative to the buried topography are even stronger than the raw data shown in fig. 5 indicate.
Jefferson County (fig. 2) is southeast of Nemaha County and is bounded on the south by the Kansas River. The tributary Delaware River was dammed in 1970 and now forms Perry Lake. The geology of Jefferson County was mapped in the late 1960's (Winslow, 1972), and most of the western part of the county was shown as Upper Pennsylvanian shales and limestones with some glacial drift covering the hilltops.
A narrow buried valley between exposures of bedrock less than 0.5 mi (0.8 km) apart was discovered when a commerical driller put in wells on several 10-acre (40,470 m2) parcels of land that had been subdivided in connection with the development of Perry Lake. Although shallow bedrock and low yields were found on most lots, more than 100 ft (30 m) of glaciofluvial sands and gravels were found on one lot. A rural-water-district well was subsequently drilled close to the private well, and a 25-hr pump test on the public well at 500 gpm (31 L/sec) produced a water-level decline in this well from the static level of 2 ft (0.6 m) to 40 ft (12 m) below land surface, with stabilization occurring after only about eight hours. Recent work by the Kansas Geological Survey (KGS) has shown that these wells are in a buried valley that is at least 1.5 mi (2.4 km) long and that trends northeast-southwest (fig. 6). The width of the deep channel in one location where known is only about 500 ft (150 m).
Figure 6--Test sites in part of Jefferson County.
Landsat imagery has been analyzed for this area, but no tonal pattern that could be associated with the buried valley was identified. The lack of success in differentiating this buried valley probably relates to a channel width being less than two times that of the instantaneous field of view (79 m [260 ft]) of the multispectral scanner and to the landscape spectral characteristics. The low contrast between materials surrounding and those overlying the buried valley prevents differentiation of this alluvial aquifer.
Thermal, resistivity, seismic, gravity, and test-hole studies were conducted along the lines shown in fig. 6. The rural water district drilled its well and several test holes southeast of the middle of line A, but subsequent KGS field work showed considerably greater saturated thicknesses of sand and gravel west of the well. Shallow bedrock occurs in the northwest and southeast parts of the area near line A. The narrow buried valley, up to 200 ft (60 m) deep, occurs between the bedrock highs.
Resistivity data interpreted for sites near line A yielded bedrock depths that were inconsistent with drill-hole values. Apparently the resistivity contrast between the sand and gravel aquifer and the underlying limestone bedrock was insufficient for good evaluations.
Temperature measurements were made at approximately 100-ft (30-m) intervals across the buried valley near the rural-water-district well in the winter of 1979-1980 and the summer of 1980 (Denne et al., 1982). The summer and winter data show general cooling and warming trends, respectively, over the buried valley, but some inconsistencies were observed.
Although resistivity and temperature measurements did not precisely define the bured valley near the rural-water-district well, a gravity profile taken along line A (fig. 6) provided excellent results. Residual Bouguer gravity values were derived by removing a least-squares-determined linear regional trend from the original Bouguer values. The residual gravity profile (fig. 7) exhibits a well-defined and symmetrical negative anomaly (-0.5 milligals) over the buried valley. The depths to bedrock from two drill holes were used as controls for the gravity modeling. The subsurface formation thicknesses were estimated from previous work in Jefferson County (Winslow, 1972) coupled with bottom-hole bedrock-sample descriptions from the two drill holes. The bedrock densities (2.43-2.51 gm/cm3) were estimated from a compensated neutron-formation-density log run on a drill hole located in Wabaunsee County, approximately 35 mi (56 km) west of the Jefferson County test site. Because all the subsurface beds had dips of less than 1°, they were approximated to be flat-lying for purposes of gravity modeling.
Figure 7--Gravity profile along test line A in Jefferson County.
Good agreement between the calculated and measured gravity profiles was achieved for glacial channel-fill densities (ρ0F) between 2.1 and 2.2 gm/cm3. The gravity modeling predicts a valley depth of 203±52 ft (61±15 m). This result is consistent with a maximum known depth to bedrock of 167 ft (50 m) found in a drill hole located along the glacial-valley trend approximately 200 ft (60 m) southwest of the gravity profile.
To determine the length and orientation of the buried valley, data were collected along lines B, C, and D (fig. 6). Significant variability in topography, cultural features, vegetation, and soil types occurs along these data lines. As could be expected, then, temperature profiles for lines B-D (fig. 8) are not as conclusive as those near line A. In general, however, warm temperatures were found over the buried valley in winter (1979-1980), and cool temperatures were found in the summers of 1979 and 1980.
Figure 8--Data profiles B, C, and D for Jefferson County test lines.
Reversed seismic-refraction data (fig. 8) suggested the presence of the buried valley in lines B and C, and this was confirmed by drill holes. Seismic data for the middle of line B are not shown because the absolute bedrock depth was not determined; the geophone spread only provided a depth greater than 70 ft (21 m). Resistivity data indicated that the valley axis occurs in the western part of profile D, and preliminary augering (not to bedrock in the channel) supports this interpretation. The east wall of the channel occurs in the middle of line D where resistivity analysis showed the bedrock depth to be 14 ft (4 m). A test hole there encountered a high-resistivity limestone bedrock at 19 ft (6 m) below a relatively low-resistivity glacial clay. The buried channel is now known to extend southwest-northeast for more than 1.5 mi (2.4 km).
The combination of remote sensing, geophysical techniques, and test drilling has proved useful for delineating some buried valleys in northeastern Kansas. Analysis of tonal patterns on springtime Landsat imagery provides a quick and inexpensive first step for selecting field-study sites. Buried channels associated with the patterns tend to be relatively large, and the land surface over the buried valley must have distinctive spectral characteristics for it to be differentiated from the surroundings.
Shallow-earth temperature profiling is a good reconnaissance tool for selecting sites for more intensive and expensive field investigations. Cool and warm temperature anomalies occur over buried-valley aquifers in summer and winter, respectively. To avoid data that could mask the effect of an anomaly, measurements should be made with minimal microclimatic and microenvironmental variations, or quantitative factors should be developed to compensate for the variables.
Resistivity and reversed seismic-refraction surveys generally give bedrock depths within 25% of those determined by more expensive and time-consuming test-hole drilling. Errors in depths calculated from the resistivity and seismic data may occur in areas where clays are interbedded with sand or where insufficient contrast occurs between unconsolidated deposits and bedrock (e.g., clayey till over weathered shale). Logs from drill holes should be used to check and to calibrate geophysical interpretations, because they provide the final, most detailed description of aquifer location and character.
The Jefferson County case study demonstrates that the gravity method is very effective in determining cross sectional shape and depth of buried valleys in areas of relatively thin glacial-till cover above bedrock. Gravity modeling, along with drill-hole control, indicates that the density contrast between the Jefferson County channel-fill material (glaciofluvial sands and gravels) and bedrock is 0.33±0.05 gm/cm3. The density contrast for channel-fill material with a significant component of clayey sediments would probably be greater, thus providing even more favorable conditions for application of the gravity method. In areas of relatively thick glacial-till cover, the gravity method would be less effective. For example, the maximum thickness of till cover over the Jefferson County test area that would have allowed a measurable gravity anomaly (approximately 0.2 mgals) would have been approximately 100 ft (30 m).
The remote-sensing and geophysical techniques help in the selection of optimal drill sites over buried valleys. Data obtained by drilling are expensive and require much time. Although one 300-ft (90-m)-deep hole could be drilled and logged by three people in one day, a seismic profile for the same site would take five or six people one hour. A similar resistivity analysis would take three people about two hours in the field and one person another hour for data interpretation. For the detailed 0.5-mi (0.8-km) gravity profile in Jefferson County, two people were required for approximately two days to survey elevations and to take gravity field measurements. One person was required for about one month to reduce and to interpret the gravity data. Depending on the spacing of measurements, temperature profiles for several miles could be done by two people in one day. Using Landsat imagery, hundreds of square miles could be analyzed by one person in one day.
All of the methods described were applied to the test sites. They helped to define the width and shape of the major buried valley in Nemaha County, and they helped delineate the extent and the orientation of the narrow channel in Jefferson County. The remote-sensing, temperature-profiling, resistivity, reversed seismic-refraction, and gravity techniques are now being used in various combinations together with test drilling to locate and to evaluate buried-valley aquifers in other parts of northeastern Kansas.
We would like to acknowledge the many staff of the Kansas Geological Survey for their assistance in field work, data analysis, and report preparation and review.
Barbier, M.G., and Viallix, J. R., 1973. SOSIE--a new tool for marine seismology: Geophysics, v. 38, no. 4, p. 673-683.
Carmichael, R. S., and Henry, G., 1977, Gravity exploration for ground water and bedrock topography in glaciated areas: Geophysics. v. 42, no. 4, p. 850-859.
Cartwright, K., 1968, Temperature prospecting for shallow glacial and alluvial aquifers in Illinois: Illinois Geological Survey, Circular 433, 41 p.
Denne, J. E., Steeples, D. W., Sophocleous, M.A., Severini, A. F., and Lucas, J. R., 1982, An integrated approach for locating glacial buried valleys: Kansas Geological Survey, Ground-water Series 5, 22 p. [available online]
Dobrin, M. B., 1976, Introduction to geophysical prospecting: McGraw-Hill, Inc., New York, 630 p.
Dreeszen. V. H., and Burchett, R. R., 1971, Buried valleys in the lower pan of the Missouri River basin; in, Pleistocene Stratigraphy of Missouri River Valley Along the Kansas-Missouri Border: Kansas Geological Survey, Special Distribution Publication 53, p. 21-25.
Goodacre, A. K., 1973, Some comments on the calculation of the gravitational and magnetic attraction of a homogeneous rectangular prism: Geophysical Prospecting, v. 21, no. 1, p. 66-69.
Heider, F., 1982, Gravity profile over a buried valley in northeastern Kansas: Kansas Geological Survey, Open-file Report, M.S. research project, 55 p.
Lucas, J. R., and Taranik, J. V., 1977, Late Wisconsinan deglaciation of the upper Midwest interpreted from a springtime Landsat mosaic: Proceedings of the 11th International Symposium on Remote Sensing of Environment, Environmental Research Institute of Michigan, Ann Arbor, Michigan, p. 991-992.
Musgrave. A. W., ed., 1967, Seismic-refraction prospecting: Society of Exploration Geophysicists, 604 p.
Peterson, J. B., Goodrick, F. E., and Melhorn, W. N., 1975, Delineation of a buried preglacial valley with Landsat-1 data: Proceedings of NASA Earth Resources Survey Symposium. v. 1-A, p. 97-99.
Stander, T. W., 1977, Computer program for interpretation of seismic-refraction data: Environmental Geology and Geophysics Section, Kansas Geological Survey, Lawrence. Kansas, unpublished research.
Taranik, I. V., 1978, Principles of computer processing of Landsat data for geologic applications: U.S. Geological Survey, Open-file Report 78-117, 50 p.
Ward. J. R., 1974, Geohydrology of Nemaha County, northeastern Kansas: Kansas Geological Survey, Ground-water Series 2, 19 p. [available online]
Winslow, J. D., 1972, Geohydrology of Jefferson County, northeastern Kansas: Kansas Geological Survey, Bulletin 202, part 4, 20 p. [available online]
Zohdy, A. A. R., 1973, A computer program for the automatic interpretation of Schlumberger sounding curves over horizontally stratified media: U.S. Geological Survey, Report GD-74-017, 31 p.
Zohdy, A. A. R., Eaton, G. P., and Mabey, D. R., 1974, Application of surface geophysics to ground-water investigations: U.S. Geological Survey. Techniques of water-resources investigations of the U.S. Geological Survey, Book 2, Chapter D1, 116 p.
Prev--Pleistocene loess in Kansas || Next--Soils and geomorphic surfaces
Kansas Geological Survey
Comments to webadmin@kgs.ku.edu
Web version updated March 16, 2010. Original publication date 1987.
URL=http://www.kgs.ku.edu/Publications/Bulletins/GB5/Denne/index.html