Kansas Geological Survey, Ground Water Series 5, originally published in 1982
As the glaciers retreated from northeastern Kansas, they left behind deposits of sand and gravel that filled up older river valleys. These deposits hold good-quality water that can be pumped for human use.
In this study, the authors experimented with ways to find these valleys without having to drill many expensive test holes. Operating in areas of Nemaha and Jefferson counties where glacial buried valleys were thought to occur, they combined a number of techniques to predict the best places to drill test holes. Differences in temperatures at shallow depths were studied; seismic refraction and electrical resistivity surveys were made; and Landsat images were examined. All of these techniques were quicker and cheaper than drilling holes and helped to better define the buried-valley channels.
Aquifers found in glacial buried valleys are a major source of good-quality groundwater in northeastern Kansas. The extent and character of many of these deposits are not precisely known, so a detailed study of the buried valleys was undertaken. Test drilling, Landsat imagery, shallow-earth temperature measurements, seismic refraction, and surface electrical resistivity were used to evaluate two sites in Nemaha and Jefferson counties. Tonal patterns on spring-time Landsat imagery and winter/summer anomalies in shallow-earth temperatures were quick and inexpensive methods for locating some glacial-buried aquifers and suggested areas for more intensive field studies. Reversed seismic refraction and resistivity surveys were generally reliable indicators of the presence or absence of glacial buried valleys, with most depth determinations being within 25 percent of test-drilling results. The effectiveness of expensive test-hole drilling was greatly increased by integrating remote-sensing, shallow-earth temperature, seismic, and resistivity techniques in the two buried-valley test areas.
As population and demand for water increase, groundwater supplies are gaining significance in northeastern Kansas. They are especially important during times of low precipitation, when surface-water supplies decline. Although bedrock formations in the area generally contain little, if any, high-quality water, large quantities of fresh water may be obtained from deposits in glacial buried valleys. To locate these aquifers, a program integrating remote sensing, geophysical, and test-drilling techniques has been used.
Two small test sites were chosen from the general study region, which includes 16 counties in northeastern Kansas (Fig. 1). The distinctive test sites include a broad, deep channel in Nemaha County and a very narrow, deep channel in Jefferson County. They were chosen to evaluate the applicability of the remote sensing and geophysical methods for delineating buried valleys in the larger study region.
Figure 1--General buried-valley study area and test sites.
The general study area represents the counties that were entirely or partially glaciated during pre-Illinoian time. Quaternary deposits exposed in northeastern Kansas include glacial drift (till, outwash, and lacustrine deposits), loess, and alluvium. Pennsylvanian and Permian shale, limestone, and sandstone bedrock formations occur near the land surface in other areas.
The general location of preglacial drainageways is shown in Figure 2. The buried valleys may be up to three miles (5 km) wide, 400 feet (120 m) deep, and more than 75 miles, (120 km) long. Deposits filling these valleys range from clayey sediments to sand and gravel. Many of the buried-valley aquifers are confined, while others are unconfined. Water levels are commonly between 5 and 50 feet (1.5 and 15 m) below the land surface, but locally they may exceed 100 feet (30 m). Aquifer yields range to approximately 500 gallons per minute (31 l/sec).
Figure 2--Preglacial drainage map of northeastern Kansas. (After Dreeszen and Burchett, 1971.)
To investigate the 16-county study area, data have been compiled from such sources as water-, oil-, and gas-well drillers; engineering firms; and previous hydrogeologic studies. In the 9,500 square mile (24,600 km2) region there are naturally many areas with little or no reliable data. Positive results in the Nemaha and Jefferson test sites demonstrate the benefit of using remote-sensing, temperature-profiling, seismic, and resistivity methods to maximize the effectiveness of test drilling for-locating and evaluating other glacial buried-valley aquifers.
The NASA Landsat satellites have been gathering earth resources data since 1972. Each of the three Landsat systems operates at an altitude of 570 miles (917 km). Image data collected from the multispectral scanner are formatted to cover an area of about 115 miles (185 km) by 115 miles per scene. Parts of four Landsat scenes cover northeastern Kansas, including the general study area.
In research conducted by Lucas and Taranik (1977), late April to early May Landsat imagery proved to be most useful for analysis of Quaternary landforms and materials in the upper Midwest. Using a June 9, 1973, Landsat image for central Indiana, Peterson and others (1975) delineated a 40 mile- (64 km) long buried valley. For the present study in the lower Midwest, imagery from March, April, and May was evaluated. On several false-color composite images of northeastern Kansas, tonal patterns were identified that were thought to be associated with buried valleys in Nemaha, Marshall, and other counties. These image patterns form faint curving paths that cut across landscape features, but often follow topographic highs. When compared to the preglacial drainage map of the lower Missouri Basin (Dreeszen and Burchett, 1971), there is a general correspondence between image patterns and some mapped buried valleys.
The image patterns have a blue-gray color on the false-color composites and dark gray tones on black-and-white prints of the infrared spectral bands. They are probably related to variations in surficial materials, which in turn influence variations in soil moisture content. These differences are most apparent in spring when the growth of vegetation is just beginning.
Computer-enhanced imagery proved to be more useful than unenhanced standard products in delineating tonal patterns thought to be associated with buried valleys. Available EDIES (EROS Data Center Digital Image Enhancement System) imagery was evaluated for the study area. When compared to unenhanced imagery, tones of interest were more distinct and patterns were more prominent on the EDIES products.
To delineate image patterns even more readily, a linear-contrast-enhancement technique (for a general discussion, see Taranik, 1978) was applied to a spring-time Landsat scene at the U. S. Geological Survey's EROS Data Center. An interactive multispectral image-analyzing system (General Electric Image 100) was used to maximize the difference between the light and dark image tones associated with the buried channel in Nemaha County on an infrared band (Landsat, band 7, May 3, 1976, ID #246716171). The enhanced band 7 was recorded on film by a laserbeam recorder. A subscene covering the study area was extracted photographically and printed at 1:125,000 scale. A pattern analysis was completed for this subscene, and areas thought to have buried valleys were delineated. This approach formed the strategy for more intensive field-exploration techniques.
Seismic refraction involves the measurement of the velocity of sound waves in geologic layers. Typical velocities from this study area, in order of increasing depth, are 3,000-5,000 ft/sec (900-1,500 m/sec) for near-surface soil, loess, or sand; 5,000-7,500 ft/sec (1,500-2,300 m/sec) for till; 8,000-12,000 ft/sec (2,400-3,700 m/sec) for shale; and 12,000-19,000 ft/sec (3,700-5,800 m/sec) for limestone bedrock. The velocity of sound in water is about 4,800 ft/sec (1,460 m/sec) so the degree of water saturation is a factor in the observed velocity of near-surface layers, particularly in sands and gravels.
Seismic P-wave (primary wave) first arrivals on a multichannel seismogram are generally easy to fit to one or more straight lines. Each geologic layer that has a seismic velocity greater than the layer above it will manifest itself with its own straight line. The reciprocals of the slopes of those straight lines represent the velocities of the geologic layers present. The intercepts of the straight lines in conjunction with the velocities then allow the analyst to calculate the thicknesses of the layers by standard algebraic methods. (For a more detailed discussion, see Dobrin, 1976.)
Two different field techniques, reversed and unreversed refraction profiles (Dobrin, 1976), were used. There are three geologic assumptions made in the use of the unreversed refraction method:
In practice, in areas of glacial till and/or alluvium, one or all of the above assumptions may be violated. For example, sand or clay lenses may occur in either environment, and channel deposits of different ages may truncate the units. Recent vertical seismic profiling in boreholes and shallow-reflection experiments in northeastern Kansas have demonstrated some of these violations. These include, for example, the anisotropic nature of alluvium in the Kansas River Valley, where the horizontal seismic velocity in the north-south direction is approximately 30 percent higher than in the vertical direction; and the presence of low-velocity layers, not suspected by inspection of samples obtained by rotary drilling, in both the Kansas and Blue River valleys.
Depths calculated from unreversed refraction data are subject to additional errors if any dip is present. The reversed method removes the dip error. The refraction profile is reversed simply by interchanging the position of the shot hole and the geophones. Seismic energy has a different apparent velocity when traveling up-dip than it does travelling down-dip. The field-reversal process allows the analyst to solve m athematically for both true dip and true velocity within the constraints of the assumptions mentioned earlier.
The data were gathered with an Input/Output DHR (Digital High Resolution) 1632 digital seismograph. Part of the data were recorded on eight channels using up to 1.5 pounds (0.68 kg) of explosives. The remainder of the data were recorded with 12 channels using the MiniSOSIE recording technique (Barbier and Viallix, 1973) and about 1,000 impacts from an engine-driven earth compactor at each shotpoint. [Note: The use of specific product names throughout the text is for identification only and does not imply endorsement by the Kansas Geological Survey.]
Data were recorded on digital tape for later playback and enhancement in addition to being plotted in the field. Data analyses were done with a computer program (Stander, 1977). Slopes and intercepts were obtained from least-squares fits to time-distance points picked manually from seismograms. The program then solved for true velocity, thickness, and true dip for any number of layers.
Electrical resistivity techniques can be used to determine the position of horizontally stratified geologic units when these units vary in their resistance to electricity. Typical values of resistivity found in the study area are 10 to 30 ohm-ft (3-9 ohm-m) for clay, 200 to 500 ohm-ft (61-152 ohm-m) for sand, and 70 to 150 ohm-ft (21-46 ohm-m) for mixtures of clay and sand. Shale values are 20 to 50 ohm-ft (6-15 ohm-m), and limestone values are more than 500 ohm-ft (152 ohm-m).
Vertical Electrical Soundings (VES) are used to determine the vertical differences in apparent resistivity caused by different geologic units (Zohdy and others, 1974). A controlled current field is imposed on the geologic units by use of a current source, usually a battery, connected to the earth by two probes. As the space between probes is increased, the current flow lines penetrate deeper. The potential field caused by the imposed current field is measured with two probes positioned a specified distance away from the current probes. The apparent resistivity is calculated for a specific current-probe spacing using Ohm's Law modified to comply with the geometric pattern of the current and potential probes. Apparent resistivity is an overall average resistivity caused by all geologic units that are influenced by the current flow lines. VES curves are constructed by plotting apparent resistivity versus one-half the current-probe spacing. Hence, differences in apparent resistivity with increasing probe spacing indicate different geologic layers with depth.
Data were collected using a Bison Model 2390 Signal Enhancement Resistivity System. Noise caused by normal telluric earth currents and other sources was averaged out by signal enhancement. Inaccuracies caused by lateral inhomogeneities were minimized along with required field time by the use of the Schlumberger electrode configuration (Zohdy and others, 1974). The VES curves were interpreted using modified versions of computer programs written by Zohdy (1973). The modifications provided a closer representation of the field data because of the utilization of twice the usual amount of computer input data required to interpret smoothed VES curves.
Shallow-earth temperature profiling for aquifers uses variations in the thermal properties of geologic materials and water (Cartwright, 1968). Unconsolidated sediments have relatively low thermal conductivities, water is intermediate, and bedrock units have much higher values. The materials, therefore, respond differently to a changing temperature environment. Bedrock temperatures, for example, show a greater fluctuation in a smaller amount of time than temperatures of unconsolidated sediments.
The presence of water in unconsolidated deposits significantly changes the thermal properties of the deposits because of the very high specific heat of water and its greater thermal conductivity. The water may then cause a shallow aquifer to act as a heat sink (i.e., absorbing heat) or a heat source. The aquifer's disturbance of the geothermal gradient may influence near-surface soil temperatures. If an aquifer has distinct lateral boundaries and if the temperature effects of other heat sources or losses can be eliminated or evaluated, a positive (warm) anomaly would be expected over it in winter, and a negative anomaly would be expected in summer. As Cartwright (1968) confirmed by measurements in Illinois, the size of the anomaly is dependent on the thermal properties of the overburden, the temperature difference between the surface and aquifer, the depth of burial, and probably the thickness and permeability of the aquifer.
It is well documented that, with increasing soil depth, the magnitude of temperature fluctuations decreases and the temperature maxima appear later in time. For this study, temperatures were measured below the depth influenced by diurnal temperature changes but within the depth range of the annual changes. Field measurement of soil temperatures near Manhattan, Kansas (in Riley County in the southwestern part of the general study area), indicated that the diurnal effects were not significant there at depths of four feet (1.2 m) (Fig. 3). Therefore, this depth was adopted for our study.
Figure 3--Soil temperatures in the Manhattan, Kansas, area. (A) 7:00 a.m., August 1963, (B) 8:00 a.m., March 1962. Temperature data provided by Agricultural Experiment Stations, Kansas State University, Manhattan, Kansas.
Proper field procedures are necessary to obtain soil-temperature measurements free of microclimatic differences. The diurnal fluctuation is effectively eliminated by taking the readings at four feet (1.2 m). Slow temperature changes at this depth can be minimized by taking a large number of measurements within short periods of time, probably one to two days. Measurements at the adopted depth also eliminate frozen-soil effects, which tend to obliterate anomalies. Rain can also reduce temperature variations, depending on the permeability of the soil and the amount of rain.
Vegetation differences, direction and degree of slope, soil color, albedo, moisture content, and other factors that affect soil temperatures were not evaluated systematically in this study, nor are quantitative relationships given in the literature. These factors can be minimized in the field, however, by choosing station sites that allow the most uniformity. Buried pipelines, which could also influence temperature, were avoided.
We used very simple instrumentation for measuring soil temperatures. It consisted of a general-purpose thermistor probe epoxied at the end of a 0.375 inch- (0.95 cm) diameter clear-plastic, rigid tube that can be inserted into any hole larger than the diameter of the tube. A battery-powered, light-weight YSI (Yellow Springs Instrument Co., Inc.) model 46 tele-thermometer was used to measure soil temperatures.
The four-foot- (1.2 m) deep measurement holes were drilled using a hand probe or truck-mounted core barrel or auger. Experience has shown that it is valid to make temperature measurements a few hours after drilling. The temperature was monitored periodically until the probe reached equilibrium with the soil. The holes were meanwhile covered with light-colored cardboard or styrofoam.
Temperature profiles were constructed for the study area. Because the purpose of our temperature prospecting was to evaluate the general applicability of this method in locating buried valleys and not to engage in a detailed thermal study evaluating all influencing microenvironmental factors, no attempt was made to eliminate masking data. Our interest was in the main trends of the temperature fluctuations.
Test drilling was used to verify the presence of buried valleys and to evaluate the character of the aquifers. Shallow (less than 107 feet [33 ml) auger holes and deep (100-400 feet [30-122 m]) rotary holes were drilled. In addition, logs were obtained from water-well and oil and gas drillers, engineering firms, and other government agencies. In the two test areas, more holes were drilled in regions where interpretations of remote-sensing and geophysical data suggested the presence of buried valleys.
Two small areas in Nemaha and Jefferson counties were intensively studied using a combination of the methods previously discussed. These locations were chosen for their distinctive types of buried valleys. One channel ranges up to 3 miles (5 km) in width and 400 feet (120 m) in depth, while the other is only about 500 feet (150 m) wide in places, but is still 100 to 200 feet (30-60 m) deep.
The major buried valley of northeastern Kansas is a tributary of the ancestral Grand River in Missouri. It occurs in the southern part of Nemaha County, Kansas (Fig. 4), where the valley fill is known to be as much as 380 feet (116 m) thick. A basal gravel, generally less than 20 feet (6 m) thick, is overlain by heterogeneous clayey sediments, and sand and gravel layers are found between the clays. Aquifer yields range to about 350 gpm (22 l/sec).
Figure 4--Buried valleys and bedrock topography of Nemaha County, Kansas (from Ward, 1974).
Taken by itself, the geologic map of Nemaha County (Ward, 1974) gives little evidence for the presence of the deep buried-valley system. Alluvial deposits are mapped along most of the modern streams, and bedrock outcrops are found in the extreme southern and northern and locally in the central parts of the county. Most of the area, however, is covered by glacial drift.
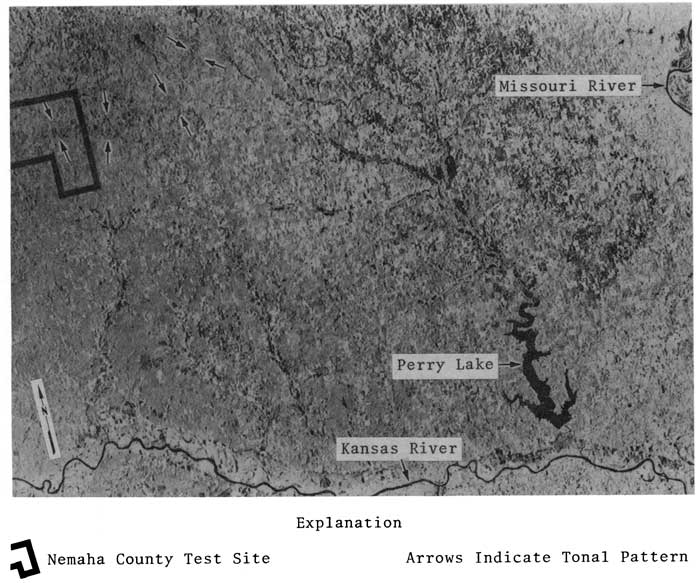
In contrast to the geologic map, Landsat imagery for Nemaha County suggests less uniformity. Variations in topography, land use, and surficial materials with their attendant moisture content form complex, interrelated patterns to be analyzed. Using conventional techniques of air-photo interpretation, a narrow band of dark gray tone that curves from the southwest to the east-central part of the county was delineated on the enhanced band 7 subscene from May 3, 1976 (Fig. 5). For more than 10 miles (16 km) in the southwest, the axis of the major buried valley as mapped by Ward (1974) falls within the tonal pattern delineated from the image. It appears that the entire pattern may be associated with a lobate end moraine and ice marginal drainage, and field investigations of the pattern area will be discussed in another paper.
Figure 5--Enhanced band 7 Landsat subscene for northeastern Kansas. (image ID #246716171, Path 29, Row 33, May 3, 1976.)
A test line of thermal, resistivity, seismic, and drill-hole sites in Nemaha County is shown in Figure 6. The buried valley axes from Figure 4 and the orientation and extent of the pattern delineated from the enhanced Landsat imagery are also shown. On the Landsat image, the northern boundary of the tonal pattern is distinct, while the southern edge is less well defined because of gradational changes in tone. The 1:125,000 scale Landsat print extends one mile into Marshall County, although the original image extended several miles farther west. Drill-hole sites and the extension of the channel into Marshall County are indicated in Figure 6 and discussed at the end of this section.
Figure 6--Test sites in parts of Nemaha and Marshall counties.
The surface topography and field data from the Nemaha County test line are profiled in Figure 7. The outer limits of the valley system along this profile are defined at least by bedrock exposures at the south end (site M) and one mile (1.6 km) north of A. The seven rotary test holes were drilled for the present study.
Figure 7--Data profile for Nemaha County test line. Letter above profile indicates test site. Temperature measured in September 1980.
Figure 7, cont.--Geologic sections for test-site columns.
Test-hole data at C and E indicate a steeply sloping north valley wall. This correlates well with the north edge of the Landsat pattern. The deepest part of the channel occurs between E and F, and these holes contain 8 to 19 feet (2-5.8 m) of basal gravel and sand. The Landsat pattern extends only about 0.5 mile (0.8 km) south of F, but test hole G, with 8 feet (2 m) of basal sand and gravel, appears to be on the gently sloping south side of the valley. This interpretation is contrary to Ward's (1974) bedrock topographic map. His map (Fig. 4) shows a bedrock high in Sections 5 and 6, T. 5 S., R. 11 E. (between F and G). However, no field data could be found to support the 1100-foot (335-m) contour in this area. A test hole at a site midway between F and G, chosen from temperature and seismic data discussed below, should define whether the main channel with its basal gravel is three miles (5 km) wide or is instead two narrower channels.
The main-channel axis does pass near E as mapped by Ward (1974), but a major tributary does not go through J. A test hole at J revealed 149 feet (45 m) of silty and fine sandy glaciofluvial material overlain by 52 feet (16 m) of till, but the bedrock elevation was 130 feet (40 m) above the 1000-foot (305 m) contour as previously mapped. It appears that J is on the gently sloping south valley wall of the main channel, although it is possible that a narrow channel could pass north of J.
For the Nemaha County profile (Fig. 7), interpretations of resistivity data yielded bedrock depths that were generally within 25 percent of actual test-hole values. The inconsistency of the results could be attributed to a number of factors, including the great probing depths (usually greater than 300 feet [90 m]); the thick clays between sand and gravel deposits; a possible basal clay, weathered bedrock, or poor-quality water zone just above bedrock; or a small overall electrical-resistivity contrast between the unconsolidated deposits and bedrock. Test-hole drilling at K indicated a significant error in the bedrock depth determined from resistivity data for this point. Comparison of the drill log to the VES curve indicated which slopes and inflections on the curve correspond to various geologic units. This calibration process has increased the certainty of proper correlations for this area in the future.
Bedrock levels calculated from two unreversed seismic-refraction profiles were in error by 0 percent (F) and 22 percent (E) compared to test-hole results. Errors in other seismic results could be attributed to the violation of assumptions discussed previously in the "Techniques" section. For example, the presence of low-velocity zones, particularly noticeable on the seismogram for H, would cause calculated bedrock levels to be too deep. The unreversed nature of the profiles is another source of error where the refracting surface is not horizontal. The shot to geophone direction for B and I was down the expected dip of the valley wall, so the calculated bedrock levels are again too deep. Where the shot was probably up-dip (A and H), the bedrock values may be too shallow.
A reversed seismic-refraction profile was recently completed along the test line (June 1981). Preliminary evaluation of the data suggests the presence of several small channels below the level of the main wide valley. A slight bedrock high between F and G is indicated (Knapp, 1981).
The temperatures measured in late summer 1980 are profiled above the cross section in Figure 7. The general pattern indicates a broad temperature depression over the main buried valley, a temperature recovery over the shallower bedrock, and a decline over the area formerly mapped as a tributary (J). Data south of J (not plotted) are unreliable because they were obtained after a local thunderstorm.
The average temperature over the northern bedrock high (A to D) is 23.4°C (74.1°F). Over the gently sloping south wall (south of G to I), the average is 22.9°C (73.2°F). The average temperature over the buried valley (E to G) is 22.3°C (72.1°F). The temperature averages include isolated highs, some of which could be due to holes that were several inches less than four feet deep or to surficial deposits with abundant lime concretions. The higher thermal conductivity of carbonates as opposed to clays and sands may be responsible for elevated temperatures. Qualitative corrections for such microenvironmental variables suggest that temperature anomalies relative to the buried topography are even stronger than the raw data shown in Figure 7 indicate.
From Nemaha County, the tonal pattern observed on the Landsat imagery continues westward into Marshall County (Fig. 6). The original imagery covers several more miles in Marshall County than does the 1:125,000 scale print, and it suggests that the tonal pattern continues both westward and northwestward from Nemaha County. Test-hole and water-well drill-hole data are available at the sites shown. A contour map prepared from the bedrock-elevation data suggests that the axis of the main channel in Marshall County trends northwestward from a point about 0.5 mile (0.8 km) south of where it was mapped by Ward (1974) at the Nemaha County border. Additional work will be done in this area.
Jefferson County (Fig. 8) is southeast of Nemaha County and is bounded on the south by the Kansas River. The tributary Delaware River was dammed in 1970 and now forms Perry Lake. The geology of Jefferson County was mapped in the late 1960's (Winslow, 1972), and most of the western part of the county was shown as Upper Pennsylvanian shales and limestones with some glacial drift covering the hilltops.
Figure 8--Jefferson County, Kansas.
A narrow buried valley between exposures of bedrock less than 0.5 mile (0.8 km) apart was discovered when a commercial driller put in wells on several 10-acre (40,470 m2) parcels of land that had been subdivided in connection with the development of Perry Lake. Although shallow bedrock and low yields were found on most lots, more than 100 feet (30 m) of glaciofluvial sands and gravels were found on one lot. A rural-water-district well was subsequently drilled close to the private well, and a 25-hour pump test at 500 gpm (31 l/sec) produced a water-level decline from two feet to 40 feet (0.6 m-12 m), with stabilization occurring after only about eight hours. Recent work by the Kansas Geological Survey (KGS) has shown that these wells are in a buried valley that is at least 1.5 miles (2.4 km) long and trends northeast-southwest (Fig. 9). The width of the deep channel in one location where known is only about 500 feet (150 m).
Landsat imagery has been analyzed for this area, but no tonal pattern that could be associated with the buried valley was identified. The lack of success in differentiating this buried valley probably relates to a channel width less than two times that of the instantaneous field of view (79 m [260 ft]) of the multispectral scanner and to the landscape spectral characteristics. The low contrast between materials surrounding and those overlying the buried valley prevents differentiation of this alluvial aquifer.
Thermal, resistivity, seismic, and test-hole studies were conducted along the lines shown in Figure 9. The data obtained along lines labeled A through D are profiled together with the surface topography in Figure 10. The rural water district drilled its well (site 4 on profile B in Fig. 10) near a small creek and test holes at sites 5, 6, 8, and 9. Later KGS field work showed considerably greater saturated thicknesses of sand and gravel west of the well (e.g., sites 7, 3, and 2). Shallow bedrock occurs in the far northwest corner of the area (site 1) and east of the creek at sites 6, 8, and 9. The narrow buried valley, up to 200 feet (60 m) deep, occurs between the bedrock highs.
Figure 9--Test sites in part of Jefferson County, Kansas.
Figure 10--Data profiles A, B, C, and D for Jefferson County test lines. Number above profile indicates test site. Uppermost temperatures measured in August 1980; lower temperatures measured in March 1980.
Figure 10, cont.--Geologic sections for test-site columns.
Resistivity data interpreted for sites 1, 4, and 7 yielded bedrock depths within 10 percent of those determined by test holes. The accuracy of these results in Jefferson County as opposed to those in Nemaha County could be attributed to the relatively clean buried sand deposit, small thicknesses of interbedded clays, and a distinguishable electrical contrast between bedrock and the overlying sand deposit. The depth to sand and the layer thicknesses determined from the resistivity data also correlated well with values determined by test-hole drilling.
Temperature measurements were made at approximately 100-foot (30-m) intervals across the buried valley near the rural-water-district well in the winter of 1979-1980 and the summer of 1980. The summer data show a general cooling trend from the west toward the stream. Eastward of the stream, where the bedrock approaches the land surface, there is a consistent and expected rise in temperatures. Values over the buried valley range from 20°C (68°F) near the present stream to nearly 24°C (75°F), although the higher temperatures toward the west were at first thought to represent a bedrock high. Test drilling at site 3, however, showed a deep portion of the valley instead of shallow bedrock. The winter-time data indicate a consistent cooling trend eastward from the stream toward the shallow shale and sandstone. The temperature over the buried valley is generally warmer during winter, but there is an anomalously cool zone that coincides at least in part with the previously mentioned summer warm zone. Possible explanations for the anomalies include a slightly depressed water level and/or the presence of eroded soil (evident on maps by Dickey and others, 1977) in these areas.
In general, microenvironmental factors are believed to be relatively uniform in the area near the rural-w ater-di strict well (lines A through D). Much greater variability in topography, cultural features, vegetation, and soil types occurs along data lines E, F, and G. As could be expected, then, temperature profiles for lines E through G (Fig. 11) are not as conclusive. In general, however, warm temperatures were found over the buried valley in winter (1979-1980), and cool temperatures were found in the summers of 1979 and 1980.
Reversed seismic-refraction data suggested the presence of the buried va~ley in lines E and F, and this was confirmed by drill holes. Resistivity data indicated that the valley axis occurs approximately 0.3 mile (0.5 km) east of the west end of profile G, and preliminary augering (not to bedrock in the channel) supports this interpretation. The buried channel is now known to extend southwest-northeast for more than 1.5 miles (2.4 km).
Figure 11--Data profiles E, F, and G for Jefferson County test lines. Numbers above profile for test-site reference only. Uppermost temperatures measured in August 1980; lower temperatures measured in March 1980.
Figure 11, cont.--Geologic sections for test-site columns.
The combination of remote sensing, geophysical techniques, and test drilling has proven useful for delineating some buried valleys in northeastern Kansas. Analysis of tonal patterns on spring-time Landsat imagery provides a quick and inexpensive first step for selecting field-study sites. Buried channels associated with the patterns tend to be relatively large, and the land surface over the buried valley must have distinctive spectral characteristics for it to be differentiated from the surroundings.
Shallow-earth temperature profiling is a good reconnaissance tool for selecting sites for more intensive and expensive field investigations. Cool and warm temperature anomalies occur over buried-valley aquifers in summer and winter, respectively. To avoid data that could mask the effect of an anomaly, measurements should be made with minimal microclimatic and microenvironmental variations, or quantitative factors should be developed to compensate for the variables.
Resistivity and reversed seismicrefraction surveys generally give bedrock depths within 25 percent of those determined by more expensive and time-consuming test-hole drilling. Errors in depths calculated from the resistivity and seismic data may occur in areas where clays are interbedded with sands or where there is insufficient contrast between unconsolidated deposits and bedrock (e.g., clayey till over weathered shale). Logs from drill holes should be used to check and calibrate geophysical interpretations, because they provide the final, most detailed description of aquifer location and character.
The remote-sensing and geophysical techniques help in the selection of optimal drill sites over buried valleys. Obtaining data by drilling is expensive and requires much time. Although one 300-foot- (90 m) deep hole could be drilled and logged by three people in one day, a seismic profile for the same site would take five or six people one hour. A similar resistivity analysis would take three people about two hours. Depending on the spacing of measurements, temperature profiles for several miles could be done by two people in one day. Using Landsat imagery, hundreds of square miles could be analyzed by one person in one day.
All of the methods described were applied to the two test sites. They helped to define the width and shape of the major buried valley in Nemaha County, and they helped delineate the extent and orientation of the narrow channel in Jefferson County. The remote-sensing, temperature-profiling, resistivity, and reversed seismic-refraction techniques are now being used in various combinations together with test drilling to locate and evaluate buried valley aquifers in other parts of northeastern Kansas.
We gratefully acknowledge the following people for their contributions to our research. Mark Ziegler, David Svingen, P. Allen Macfarlane, Thomas McClain, Harold Dickey, and the KGS drill and seismic crews provided field assistance. David Kvam and Tom Stander assisted in reduction of the seismic data. Donna Stetz helped to select the Landsat imagery used. Jennifer Sims and Patricia Acker provided the graphics, and Kaye Long typed the manuscript. Howard O'Connor, Carl McElwee, and Manoutchehr Heidari reviewed the paper. We thank them and all others who supported this study.
Barbier, M. G., and Viallix, J. R., 1973, SOSIE: A new tool for marine seismology: Geophysics, v. 38, no. 4, p. 673-683.
Cartwright, K., 1968, Temperature prospecting for shallow glacial and alluvial aquifers in Illinois: Illinois Geological Survey, Circular 433, 41 p.
Dickey, H. P., Zimmerman, J. L., and Rowland, H. T., 1977, Soil survey of Jefferson County, Kansas: U. S. Department of Agriculture, Soil Conservation Service, 67 p. plus plates.
Dobrin, M. B., 1976, Introduction to geophysical prospecting: New York, McGraw-Hill, 630 p.
Dreeszen, V. H., and Burchett, R. R., 1971, Buried valleys in the lower part of the Missouri River Basin; in, Pleistocene stratigraphy of Missouri River Valley along the Kansas-Missouri border: Kansas Geological Survey, Special Distribution Publication 53, p. 21-25.
Knapp, R. W., 1981, Personal communication: Environmental Geology and Geophysics Section, Kansas Geological Survey.
Lucas, J. R., and Taranik, J. V., 1977, Late Wisconsinan deglaciation of the upper Midwest interpreted from a springtime Landsat Mosaic: Proceedings of the 11th International Symposium on Remote Sensing of Environment, Environmental Research Institute of Michigan, Ann Arbor, Michigan, p. 991-992.
Peterson, J. B., Goodrick, F. E., and Melhorn, W. N., 1975, Delineation of a buried pre-glacial valley with Landsat-1 data: NASA Earth Resources Survey Symposium, Houston, Texas, Proceedings, v. I-A, p. 97-99.
Stander, T. W., 1977, Computer program for interpretation of seismic refraction data: Unpublished, Environmental Geology and Geophysics Section, Kansas Geological Survey.
Taranik, J. V., 1978, Principles of computer processing of Landsat data for geologic applications: U.S. Geological Survey, Open-File Report 78-117, 50 p. [available online]
Ward, J. R., 1974, Geohydrology of Nemaha County, northeastern Kansas: Kansas Geological Survey Ground Water Series 2, 19 p. [available online]
Winslow, J. D., 1972, Geohydrology of Jefferson County, northeastern Kansas: Kansas Geological Survey Bulletin 202, part 4, 20 p. [available online]
Zohdy, A. A. R., 1973, A computer program for the automatic interpretation of Schlumberger sounding curves over horizontally stratified media: U.S. Geological Survey, Report GD-74-017, 31 p.
Zohdy, A. A. R., Eaton, G. P., and Mabey, D. R., 1974, Application of surface geophysics to ground-water investigations: Techniques of water-resources investigations of the United States Geological Survey: U.S. Geological Survey, Book 2, Chapter D1, 116 p. [available online]
Kansas Geological Survey, An Integrated Approach for Locating Glacial Buried Valleys
Placed on web June 18, 2012; originally published in 1982.
Comments to webadmin@kgs.ku.edu
The URL for this page is http://www.kgs.ku.edu/Publications/Bulletins/GW5/index.html