![]()
Prev Page--Digital model || Next Page--Alleviation and Summary
Water Quality
Owing to the large amounts of saline-water disposal that have occurred and the subsequent mixing of water from several geologic units, it is not feasible to "type" the ground water in the Wellington aquifer. Table 1 gives the results of chemical analyses of ground-water samples derived from the Wellington aquifer and of a whole salt sample procured from the mine operated by Interpace Salt Co., Hutchinson, Kansas. This sample was dissolved in deionized water until a chloride concentration of 180,000 mg/L was attained. Analyses were made by the Water and Sewage Laboratory of the Kansas Department of Health and Environment or the U.S. Geological Survey.
The analyses indicate that the water in the Wellington aquifer is of a sodium-chloride type. The relatively low chloride concentration in the sample collected from well 16-3W-3CDC is a result of the well being located less than one-quarter mile from an active oilfield-brine disposal well. Saline water pumped from a deeper horizon in association with oil production is injected into this disposal well. The chloride concentration of the injected water is lower than the chloride concentration thought to be representative of undiluted water from the Wellington aquifer.
A series of seepage and salinity measurements were made on major streams in the southern part of the study area in an attempt to determine the magnitude of saline-water discharge from the Wellington aquifer to freshwater streams (fig. 9). Except for the Ninnescah River, which is regulated by Cheney Reservoir (located about 40 miles upstream from Belle Plaine), the measurements were made during low-flow conditions. There had been no precipitation for about 2' weeks prior to the measurements.
Figure 9. Measuring sites for seepage and salinity measurements (November 1977), surface-water gaging stations, and areas of saline-water contamination. A larger version of this figure is available.
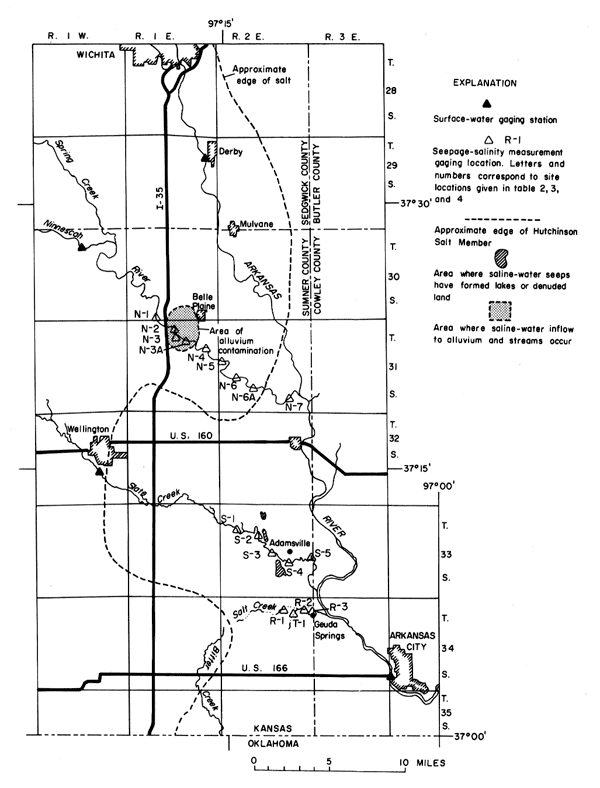
Water quality, with respect to chloride, is marginal in the Ninnescah River upstream from the area where the stream flows over the Wellington aquifer, (fig. 9). The Kansas Department of Health and Environment recommends a maximum concentration of 250 mg/L chloride in drinking water. The Kansas Water Resources Board reports that chloride concentration in the Ninnescah River at the Peck gaging station (about 10 miles upstream from the area of saline-water inflow) is greater than 250 mg/L 33 percent of the time and that the maximum recorded chloride concentration was 421 mg/L at a discharge of 43 ft3/s (J. D. Hargadine, oral commun., 1977). The source(s) of chloride in the Ninnescah River at this location is attributed to inflow of saline water from Permian-age evaporite deposits in areas to the west of the study area.
Walters (1961) reported on the high chloride concentrations in the alluvium in a 2-mi2 area west of Belle Plaine where the Ninnescah River flows over the Wellington aquifer. Analyses of water samples from several augered test holes and wells screened in the basal part of the alluvium in this area Indicated chloride concentrations ranging from 1,700 to 160,000 mg/L. The source of chloride gained in the reach between site N-2 and site N-3A (11 ft3/s) evidently is from the Wellington aquifer where chloride concentrations are about 180,000 mg/L (table 1).
The seepage and salinity measurements along this reach of the Wellington aquifer indicate an increase in chloride load from 95 tons per day (tons/d) at site H-2 to 115 tons/d at site H-7 (a 14-mile reach) (fig. 9 and table 2).
Table 2. Results of seepage and salinity measurements on Ninnescah River, November 1976.
| Location (see fig. 9) |
River mile upstream from mouth |
Measured discharge (ft3/s) |
Gain or loss (ft3/s) |
Calcium (mg/L) |
Magnesium (mg/L) |
Sodium (mg/L) |
Sodium load (tons/d) |
Chloride (mg/L) |
Chloride load (tons/d) |
Sodium/ chloride ratio |
|---|---|---|---|---|---|---|---|---|---|---|
| N-1 | 17.0 | 120 | 78 | 15 | 196 | 63.5 | 291 | 94 | 0.67 | |
| N-2 | 15.5 | 122 | 2.0 | 77 | 15 | 191 | 62.9 | 289 | 95 | 0.66 |
| N-3 | 14.6 | 126 | 4.0 | 77 | 15 | 194 | 66.0 | 291 | 99 | 0.67 |
| N-3A | 13.8 | 131 | 5.0 | 80 | 15 | 199 | 70.4 | 307 | 109 | 0.65 |
| N-4 | 11.6 | 130 | -1.0 | 78 | 16 | 202 | 70.9 | 303 | 106 | 0.67 |
| N-5 | 9.6 | 132 | 2.0 | 78 | 17 | 201 | 71.6 | 307 | 109 | 0.65 |
| N-6 | 6.6 | 133 | 1.0 | 80 | 15 | 199 | 71.4 | 302 | 108 | 0.66 |
| N-6A | 4.7 | 130 | -3.0 | 83 | 13 | 199 | 69.8 | 304 | 107 | 0.65 |
| N-7 | 1.2 | 141 | 11.0 | 80 | 16 | 200 | 76.1 | 301 | 115 | 0.66 |
| Overall net gain | 21.0 | 21 | ||||||||
Slate Creek contains water of good quality upstream from the saline-water inflow area. Results of the seepage and salinity measurements mentioned earlier showed increases in chloride concentrations along the reach of saline-water inflow from 78 mg/L (0.78 tons/d) at site S-1 to 3,540 mg/L (44 tons/d) at site S-3. The overall net gain in chloride load in the reach from site S-1 to site S-5 was 35.5 tons/d, while the net increase in discharge was 0.68 ft3/s (fig. 9 and table 3). Also, there are several large seeps in the area (secs. 4, 9, 15, 22, 26, and 27, T. 33 S., R. 2 E.) where saline-water outflow from the Wellington aquifer has formed moderate-sized lakes and has denuded large areas of land. The chloride concentrations of water samples taken from a lake in 33-2E-16AB and from a sink-hole in 33-2E-26BB were 11,300 mg/L and 16,600 mg/L, respectively.
Table 3. Results of seepage and salinity measurements on Slate Creek, November 1976.
| Location (see fig. 9) |
River mile upstream from mouth |
Measured discharge (ft3/s) |
Gain or loss (ft3/s) |
Calcium (mg/L) |
Magnesium (mg/L) |
Sodium (mg/L) |
Sodium load (tons/d) |
Chloride (mg/L) |
Chloride load (tons/d) |
Sodium/ chloride ratio |
|---|---|---|---|---|---|---|---|---|---|---|
| S-1 | 14.5 | 3.73 | 91 | 41 | 71.0 | 0.72 | 78.0 | 0.78 | 0.91 | |
| S-2 | 11.6 | 3.82 | 0.09 | 139 | 48 | 340 | 3.51 | 500 | 5.18 | 0.68 |
| S-3 | 9.3 | 4.58 | 0.76 | 259 | 80 | 2,350 | 29.1 | 3,540 | 43.8 | 0.66 |
| S-4 | 5.9 | 4.08 | -0.50 | 246 | 79 | 2,160 | 23.8 | 3,300 | 36.3 | 0.65 |
| S-5 | 3.5 | 4.41 | 0.33 | 250 | 77 | 2,000 | 23.8 | 3,050 | 36.3 | 0.66 |
| Overall net gain | 0.68 | 23.8 | 35.52 | |||||||
| 33-2E-16AB | lake | 496 | 142 | 7,300 | 11,300 | 0.65 | ||||
| 33-2E-26BB | lake | 1,264 | 186 | 10,800 | 16,650 | 0.65 | ||||
Salt Creek, west of Geuda Springs, is a small stream that contributes very little chloride load to the Arkansas River (fig. 9 and table 4). Seepage and salinity measurements during low-flow conditions in November 1976, Indicated an increase in chloride load from 0.10 tons/d at site R-1 upstream from the saline-water inflow area to 2.2 tons/d at site R-3 just north of Geuda Springs and an increase in discharge from 0.10 ft3/s to 0.46 ft3/s.
Table 4. Results of seepage and salinity measurements on Salt Creek, November 1976.
| Location (see fig. 9) |
River mile upstream from mouth |
Measured discharge (ft3/s) |
Gain or loss (ft3/s) |
Calcium (mg/L) |
Magnesium (mg/L) |
Sodium (mg/L) |
Sodium load (tons/d) |
Chloride (mg/L) |
Chloride load (tons/d) |
Sodium/ chloride ratio |
|---|---|---|---|---|---|---|---|---|---|---|
| R-1 | 4.1 | 0.10 | 628 | 123 | 201 | 0.05 | 390 | 0.10 | 0.52 | |
| T-1a | 2.5 | 0.06 | 860 | 184 | 410 | 0.07 | 1,440 | 0.23 | 0.28 | |
| R-2 | 2.0 | 0.32 | 0.16 | 744 | 140 | 410 | 0.35 | 990 | 0.86 | 0.41 |
| R-3 | 1.2 | 0.46 | 0.14 | 744 | 135 | 960 | 1.19 | 1,780 | 2.2 | 0.54 |
| Overall net gain | 0.30 | 1.14 | 2.1 | |||||||
| aTributary measuring site. | ||||||||||
Leonard (1964) states that in Kansas oilfield brines the ratio of sodium plus potassium to the concentration of chloride is virtually constant despite wide differences in dissolved-solids concentration. The sodium-to-chloride ratio of water containing oilfield brine is normally less than 0.60. In brines from the Wellington aquifer, the ratios are slightly higher than 0.60, and in sewage effluent they are normally even higher. Excluding potassium, the ratios would be slightly lower.
Sodium-to-chloride ratios for samples from the Wellington aquifer are given in table 1, and sodium-to-chloride ratios of water samples collected during the seepage and salinity measurements are given in tables 2. 3, and 4. The ratios in water samples collected from the Ninnescah River are similar to the ratios in water from the Wellington aquifer (table 2).
Sodium-to-chloride ratios in water from Slate Creek, with the exception of site S-1 also are similar to ratios in water from the Wellington aquifer (table 3). Site S-1 is upstream from the saline-water inflow area.
Sodium-to-chloride ratios in water samples collected from the seepage and salinity measurements along Salt Creek Indicate that at least part of the salt contamination is due to oilfield activities. Although Salt Creek basin drains an area in which there is oilfield activity, the author toured the entire drainage of Salt Creek and could find no obvious evidence of present contamination due to these activities. However, It is possible that some ground-water inflow Into the tributary reflects contamination that has occurred in the past.
High concentrations of calcium and magnesium chloride are indicative of brine produced in association with oil in Kansas. The analysis for site T-1 shows a magnesium concentration of 184 mg/L compared with 123 mg/L, 140 mg/L, and 135 mg/L for sites R-1, R-2, and R-3, respectively (table 4). These values also are high compared with magnesium concentrations of water samples collected from Ninnescah River and Slate Creek (tables 2 and 3).
Although some of the saline water in Salt Creek may be due to past contamination from oilfield activities, it is evident that the Wellington aquifer contributes saline-water inflow to the stream. Numerous salt seeps and saline water in Salt Creek were noted before oilfield activities commenced in the 1920's. Thus, possible contamination owing to past oilfield activities may be masking the contamination resulting from saline-water inflow from the Wellington aquifer.
The mean daily natural saltwater discharge and chloride-load gain in the Arkansas River and its tributaries between Derby and Arkansas City during 1969-74 were computed by regression analysis procedures. A computer program developed by J. M. McNellis (oral commun., 1977) calculates the first-degree log regression equation formed by regressing the dependent variable, instantaneous chloride concentration, against the independent variable and instantaneous discharge. The derived regression equation is of the form:
10I x RC x log Q = 0,
where I = Intercept, in log units;
RC = regression equation; and
Q = instantaneous discharge.
The derived regression equation is used with mean daily stream discharge to derive mean daily chloride concentrations in milligrams per liter. If it is assumed that the saltwater moving through the Wellington aquifer is saturated (180,000 mg/L), the mean daily chloride concentrations and mean daily discharges can be used in the following equation to calculate the average chloride load in tons per day:
load (tons per day) = .0027 x Cl-(mg/L) x Q(ft3/s),
where .0027 is a conversion factor, and Q = mean daily discharge.
The net mean daily increase in chloride load attributable to ground-water inflow to the Arkansas River can be estimated by subtracting the calculated chloride loads at the Derby and Peck gaging stations from the load calculated at the Arkansas City station (fig. 9). A. H. Diaz (oral commun., 1977) states that about 90 percent of the increase in chloride load between Derby and Arkansas City is attributable to ground-water inflow. The remaining load is derived from various municipal waste-treatment facilities and oilfield operations.
Slate Creek downstream from Wellington also exhibits an increase in chloride load due to ground-water inflow from the Wellington aquifer (fig. 8 and table 3). However, because chloride analyses were not available for Slate Creek, the chloride load was determined in a different manner. Salinity and seepage measurements were made during low-flow conditions in November 1976, along the reach of Slate Creek where water high in chloride and sulfate concentration flows from the gypsum-dissolution zone of the Wellington aquifer into the stream.
The average mean daily discharge for the nearest upstream gaging station, Slate Creek near Wellington, during 1970-74 was 60.1 ft3/s. The chloride concentration of 78 mg/L obtained at the upper end of the seepage run was assumed to represent an average concentration for the stream. Also, it was assumed that any increase in chloride concentration downstream from this point was due to ground-water inflow to the stream (there is no indication of contamination from oilfield operations). Thus, the chloride load already in the stream above the area of saline-water inflow was computed to average 12.66 tons/d. This value also was subtracted from the chloride load computed at the Arkansas City station.
Table 5 lists the parameters derived for substitution into the first-degree log equation that is used to compute the chloride concentrations at the various stations. Table 5 also lists the computed chloride load that is believed due to ground-water inflow from the Wellington aquifer. Based on these criteria, the amount of chloride-load gain Into the Arkansas River and its tributaries between Derby and Arkansas City averaged 294 tons/d. J. B. Gillespie (oral commun., 1978) reports that for the water years 1974-77 an average of 369 tons/d of saltwater entered the Smoky Hill River between New Cambria and Solomon. Thus, the total amount of chloride load contributed to the fresh water system as a result of natural inflow from the Wellington aquifer is about 663 tons/d.
Table 5. Parameters used to determine chloride load due to ground-water inflow to the Arkansas River between Derby and Arkansas City. Q = discharge, in cubic feet per second.
| Station | Number of chloride analyses (1969-1974) |
Mean daily discharge (ft3/s) |
Cl--Q correlation coefficient |
Intercept (I) |
Cl--Q regression coefficient (RC) |
Cl- load (tons/d) |
|---|---|---|---|---|---|---|
| Arkansas River at Arkansas City (Sta. No. 08146500) |
238 | 2,428 | -0.827 | 4.14 | -0.537 | 1,226 |
| Arkansas River at Derby (Sta. No. 08144550) |
78 | 1,609 | -0.874 | 4.11 | -0.560 | 727 |
| Ninnescah River near Peck (Sta. No. 0814550) |
60 | 521 | -0.837 | 3.23 | -0.400 | 160 |
| Slate Creek below Wellington | 60 | 12.66 | ||||
| Total Chloride load increase | 326.34 | |||||
| Chloride load increase due to ground-water inflow | 293.7a | |||||
| aTotal chloride load increase x 0.90 (A.M. Diaz, U.S. Geological Survey, oral commun., 1977). | ||||||
If it is assumed that the water in the Wellington aquifer is saturated (180,000 mg/L), the mean daily saltwater discharge to the streamflow system may be calculated by the equation:
Q(ft3/s) = (chloride load (tons/d)) / (0.0027 x 180.000 mg/L)
Thus, the rate of saltwater inflow would be 0.60 ft3/s to the Arkansas River and 0.76 ft3/s to the Smoky Hill River.
Prev Page--Digital model || Next Page--Alleviation and Summary
Kansas Geological Survey, Geology
Placed on web Jan. 2006; originally published 1981.
Comments to webadmin@kgs.ku.edu
The URL for this page is http://www.kgs.ku.edu/Publications/Bulletins/CQS9/06_qual.html